• Skip to primary navigation
  • Skip to main content
  • Skip to primary sidebar

PMI

  • Home
  • Products
  • Library
    • Videos
      • All
      • Bolt Quality Tests
      • Promotional Videos
      • Support Videos
      • Power Quality Decoded
    • White Papers
      • All
      • Artificial Intelligence
      • Case Studies
      • Communications
        • All Communications
        • Cellular Communications
        • General Communications
      • Distributed Generation
      • IEEE Standards
      • Power Quality
        • All Power Quality
        • Analyzing Waveforms
        • Flicker
        • PQ Data Analysis
        • PQ Theory
      • Products
        • All Products
        • Boomerang
        • Boomerang SCADA
        • Box Recorder
        • Canvass
        • Eagle
        • Flex CT
        • Guardian
        • Merlin™
        • Meter Sockets
        • PQ Canvass
        • ProVision
        • Revolution
        • TLAR
        • Using PMI Recorders
      • Voltage
        • All Voltage
        • CVR
        • Voltage Sag
        • Voltage Unbalance
      • Harmonics
  • Training
    • All
    • PDH Eligible Classes
    • On-Site Training
    • Live Webinars
  • Support
  • Our Company
    • About
    • Contact
    • Join Our Team!
    • Receive our Newsletter
    • PQ Resources
    • Power Quality Solutions
  • Account
  • Cart - 0 items

FAQs

The Provision User Interface

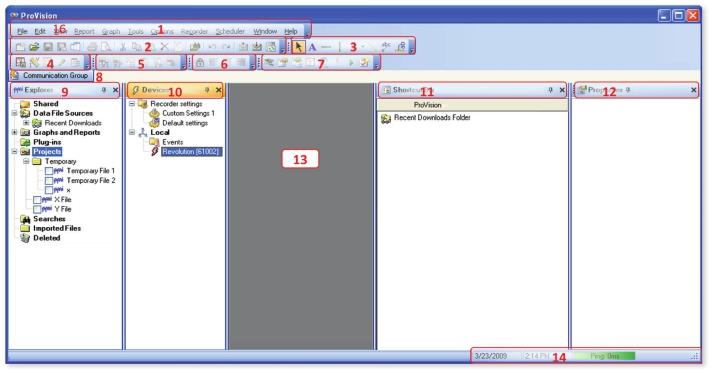
The Provision user interface

The Provision user interface

  1. Menu Toolbar: File, Edit, View, Report, Graph, Tools, Options, Recorder, Scheduler, Window, and Help menu
  2. Standard Buttons: Create a New Project, Open, Save, Save Graph As Template, Merge Files, Print, Print Preview, Cut, Copy, Paste, Delete, Edit Report Header, Find in Files, Undo, Redo, Send Via E-mail, Receive Via E-mail, and Sync Mobile buttons
  3. Graph Annotation Buttons: Pointer For Annotation, Text Annotation, Horizontal Line Annotation, Vertical Line Annotation, Arrow Annotation, Line Annotation, Pointer Annotation, and X Axis Annotation buttons
  4. Advanced Buttons: Capture View, Scale Factor, New Mixed Graph, Legend Editor, and Select Plots buttons
  5. Waveform Buttons: V/I Waveform, Real Power Waveform, Harmonic Graph, Vector Graph, Parametric Waveform, and Record Waveform buttons
  6. Trace Moving Buttons: Unlock X Axis, Left Justify On Axis, Center Justify On Axis, and Right Justify On Axis buttons
  7. Recorder Buttons: Add, Retrieve Settings, Initialize, Identify, Date and Time, Standby, Ready, and Add Event buttons
  8. Communication Group Window: Displays the status of communication tasks
  9. Explorer Tree: Watcher folders, Recent Downloads, Graphs and Reports, Projects, Searches, Imported Files, Deleted Files
  10. Devices Tree: Recorder Initialization Settings, Events, and connected recorders
  11. Provision Shortcuts
  12. Properties Window: Properties of currently viewed graph
  13. Main Workspace: Main workspace where all graphs and reports will open
  14. Date, Time, and Provision Intercommunicator Status: Place file in Projects folder, right-click on the file, and select Send by E-mail
    1. Select Send selected object to the following address (Microsoft Outlook users only) and type in recipient’s e-mail address, or select Save object to file you could send later, type in file name, browse to desired directory, save the file, and send via e-mail as an attachment.
  15. View Menu: Use the View menu to hide and unhide the Communication Group Window, Explorer Tree, Devices Tree, Shortcut Bar, Status Bar and Properties Window. These can also be pinned or unpinned so that they are either always displayed or automatically minimized when the cursor is moved away from them.
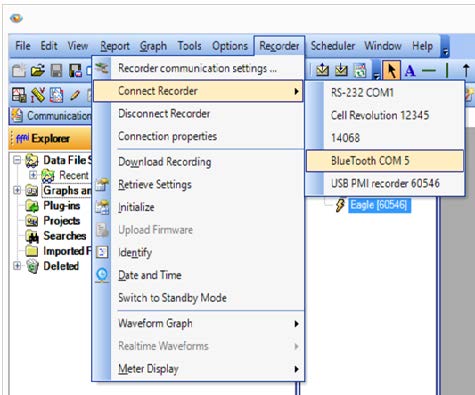
Connecting to a PMI recorder

Connecting to a PMI recorder

First Time on a Computer

  • Disconnect any recorders to your machine
  • Install the latest version of ProVision found here under “software”.
  • If using a USB connection: Install the USB Device Driver for Windows found here under “software”.
  • Restart ProVision software.

USB

  • ProVision automatically scans for any connected PMI recorder
  • Detected recorders are displayed in the devices tree in Provision

Cell modem

  • PMI technical support will need to be contacted to initially configure your cell devices
  • Select the recorder tab, then select connect recorder and the recorder name or serial number listed

Serial

  • Serial recorders will need external power applied to the recorder
  • Select the recorder tab, then select connect recorder and the PMI USB adapter cable

Bluetooth

  • First, use the PC’s blueTooth manager to pair the PC to the recorder (pmi is the pairing code)
  • Use the outgoing COMM port number that is created to configure Provision.
    • Select the options tab, then communications port settings. Click the add button, then serial. Name the connection and select a serial port number. Check the “This is a Bluetooth Connection” box and save.
  • Select the recorder tab, then select connect recorder and the blueTooth recorder name

WiFi

  • First, use the PC’s network manager to connect to the recorders WiFi network. Use the recorder’s WiFi address when configuring Provision.
  • The latest Provision software can be installed from the PMI website: https://powermonitors.com/product/provision/
  • The latest USB driver – needed to connect all recorders to Provision, can also be downloaded from the PMI website: https://powermonitors.com/downloads/ and click the software tab.
  • Software CDs are available on request
  • Save and execute the .msi files then select all the default options during the installation.
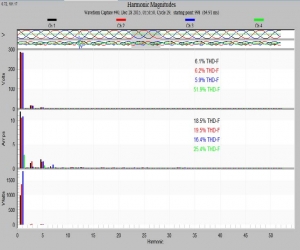
Example 2: With fundamental displayed

With fundamental displayed

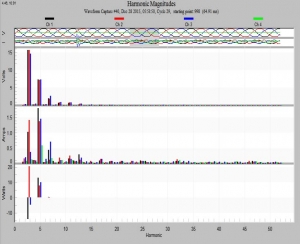
Example 2A: Without fundamental. Toggle using the ‘f’key

Without fundamental. Toggle using the ‘f’key

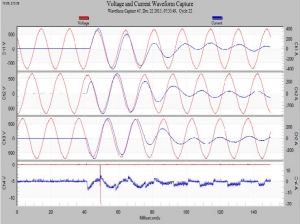
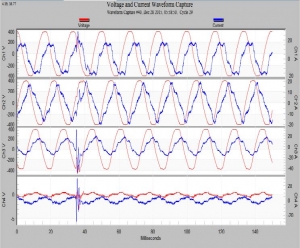
standard-wavefore-capture-graph

Standard waveform capture graph

Example 1A: Using the 3 to toggle between 3-phase and individual phase views

Using the 3 to toggle between 3-phase and individual phase views

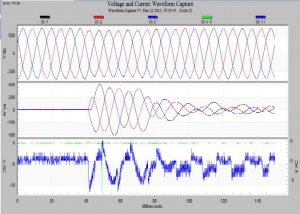
Example 1B: Use the L to select different waveforms

Use the L to select different waveforms

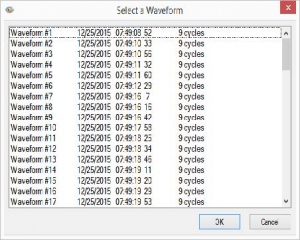
Example 1C: List of waveforms

List of waveforms

Ctrl+O: Open file
Ctrl+X: Cut
Ctrl+S: Save file
Ctrl+V: Paste
Ctrl+P: Print
Ctrl+C: Copy
Ctrl+Z: Undo
Ctrl+Y: Redo
F1: Help
Ctrl+Shift+U: Full screen
Ctrl+Shift+F: Find in files
Ctrl+Shift+B: Display or hide the shortcut bar

q Brings up the same menu as right-clicking
e,x Export dialog (Saves graphs as images)
p Print graph
s Toggle between color and black and white
d Export text dialog
k Increase line thickness
j Decrease line thickness
b Set the upper and lower bounds
m Maximize graph
t Toggle the Point Table ON or OFF

  • Move your mouse to a peak on the graph, your cursor will turn into a finger, left-click mouse to set the reference line.
  • With the Point Table ON you can: Use arrow keys (or page up/down) to move the ‘Point’ to the previous or next point.

Zooming: Zoom in on any graph. Left click mouse and hold, then drag mouse over the area to zoom in on. Release the left button to zoom into the window you made. Supports multiple zooms

  • Use arrow keys to move the zoomed window left or right, through the interval data.

u Undo one zoom level
z Undo all zoom levels

3 Toggle between 3-phase and individual phase views
I Toggle between line-to-neutral voltages and line-to-line voltages only if recorded as a WYE
L Select a different waveform
f Toggle fundamental harmonic
Page Up: Move to previous waveform capture
Page Down: Move to next waveform capture

  • « Go to Previous Page
  • Page 1
  • Page 2
  • Page 3
  • Page 4

Primary Sidebar

Have a PQ question? Ask Merlin™ — free. Send it to askmerlin@powermonitors.com or text (540) 383-3144.

Power Monitors, Inc. — Tools you Need. People you Trust.

Power Monitors, Inc. is an industry-leading product design and manufacturing firm based in Mt. Crawford, Virginia. PMI® strives to solve power quality problems by listening to our customers and working with them to design and manufacture products. Total customer satisfaction is the primary goal of all PMI® staff.

24/7 Tech Support 800.296.4120

Resources

  • White Papers
  • Videos
  • Training
  • Live Webinars
  • PQ Resources
  • Support

Company

  • About Us
  • Contact
  • Careers
  • Newsletter
  • Product Registration
  • Terms & Conditions
800 N Main St, Mt Crawford, VA 22841 | Toll Free 800.296.4120 | Fax 540.432.9430
© 2026 Power Monitors, Inc.