
Power Quality Solutions
Power Quality Solutions Built for Modern Utilities
See how power quality monitoring and analysis tools help utilities run a more reliable grid.
Request Live DemoThe Modern Grid Challenge
Power Quality: A Growing Challenge for Today’s Grid
Modern life depends on a steady supply of high-quality power. But maintaining that standard is getting harder every year. Electricity generation, delivery and consumption are all changing fast — and utility engineers are facing power quality challenges their predecessors never saw.
A decade ago, simple voltage monitoring was enough. Not anymore. Utilities now need high-resolution power quality analyzers that can capture sub-cycle transients, harmonic distortion and fast voltage fluctuations — the kind of disturbances conventional meters miss entirely.
Why Power Quality Problems Matter
As more electronics connect to the grid, they both depend on and disrupt power quality. Sensitive devices are easily affected by voltage sags, harmonics, flicker and transients. They can also create these same problems for other customers on the same circuit. The result: equipment failures, costly downtime, regulatory pressure, and premature transformer aging.
For critical systems like medical devices, data centers and manufacturing machinery, even a momentary disturbance can have major consequences. A single voltage sag lasting only a few cycles can shut down a semiconductor fab, spoil a pharmaceutical batch, or trigger hours of data center recovery.
Five forces reshaping power quality on the grid
on Revolution recorders
white papers published
power quality solutions
technical support
The PMI Solution
How Power Monitors, Inc. Solves Power Quality Challenges
At Power Monitors, Inc. (PMI), we equip utilities with the tools and expertise to tackle power quality challenges quickly and confidently. For more than three decades, our recorders and analyzers have helped engineers track down intermittent disturbances, verify compliance, and answer customer complaints with real data.
The PMI Ecosystem
The PMI Power Quality Ecosystem
PMI offers three flagship power quality recorders plus Merlin™, our AI-powered analytics platform. Need a compact investigative tool? A meter-base recorder? A high-speed substation instrument? There’s a PMI solution for the job. Every recorder connects to our cloud platform and to Merlin™, so your team can share data and investigate events from anywhere.
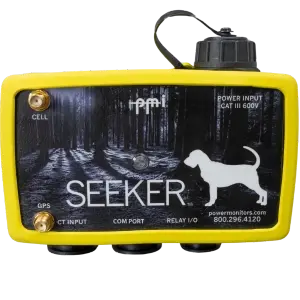
Seeker
Compact, weather-proof recorder with wireless comms and optional GPS, ideal for investigative work and smart-grid monitoring.
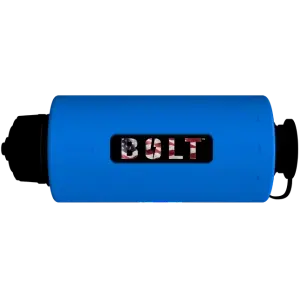
Bolt
Meter-base recorder that pinpoints PQ root causes and verifies compliance, even in tight enclosures.
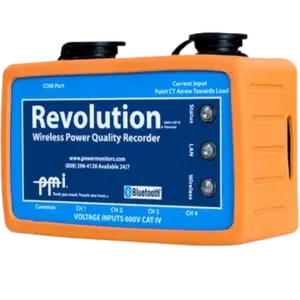
Revolution
Rugged, high-speed recorder with Bluetooth and cellular retrieval, capturing sub-cycle transients and high-order harmonics.

Merlin™
AI-powered analytics that automatically identifies, classifies and diagnoses disturbances across your PMI recorder fleet.
Introducing Merlin™ — AI-Powered Power Quality Analytics
Merlin™ changes how utilities analyze power quality data. Our AI engine automatically identifies, classifies and diagnoses disturbances captured by Bolt, Seeker and Revolution recorders. That means far less time spent manually reviewing events.
From voltage sags and harmonic distortion to DER-related events and load transients, Merlin™ surfaces the root cause faster. Your team can focus on fixing problems, not sifting through data.
Spec Comparison
Compare PMI Power Quality Recorders — Full Spec Table
The right power quality recorder depends on where you’ll deploy it, what disturbances you’re targeting, and how you want to retrieve data. Use the table below to match the instrument to your application.
| Feature | Bolt | Seeker | Revolution |
|---|---|---|---|
| Use Case | Troubleshooting PQ complaints in tight spaces — meter bases, cap-bank enclosures | Field investigations, feeder SCADA & DER control with built-in relays | High-speed substation or service-entrance transient capture to 1 MHz |
| Size | 4.79″ × 1.78″ | 5.06″ × 3.00″ × 1.81″ | 5.06″ × 3.35″ × 1.84″ |
| Channels | 3 Voltage / 3 Current | 4 Voltage / 4 Current | 4 Voltage / 4 Current |
| Sampling Rate | 256 samples/cycle | 4,166 samples/cycle | 16,666 samples/cycle |
| USB | ✓ | ✓ | ✓ |
| WiFi | ✓ | ✓ | ✓ |
| LTE | ✓ | ✓ | ✓ |
| PMI View | ✓ | ✓ | ✓ |
| Cloud Software | PQ Canvass | PQ Canvass | PQ Canvass — limited |
| Battery | 3 V | ✗ | 3 V |
| Ride-thru Power | Supercap | Supercap | Battery |
| Data Storage | 128 MB onboard + unlimited cloud | 144 MB onboard + unlimited cloud | 16 MB standard; options 128 MB, 512 MB, 1 GB |
| IEEE Flicker | ✓ | ✓ | ✓ |
| Harmonics | to the 51st | to the 51st | to the 51st |
| Waveform Capture — Sags/Swells | ✓ | ✓ | ✓ |
| Waveform Capture — Osc. Transients | ✓ | ✓ | ✓ |
| CBEMA/ITIC Recording | ✓ | ✓ | ✓ |
| Relay Control | ✓ | ✓ | ✗ |
| GPS Sync | ✗ | ✓ | ✗ |
| Pole Mount | ✗ | ✓ | ✗ |
| Meter Socket Adapter | ✗ | ✗ | ✗ |
| Buy Now | Buy Bolt | Buy Seeker | Buy Revolution |
Not sure which fits your application? Contact a PMI specialist for personalized guidance.
Applications
Power Quality Monitoring Applications
PMI power quality recorders are deployed across every segment of the utility industry. Here’s how our instruments deliver measurable value to engineering, operations and compliance teams.
DER Interconnection & IEEE 1547 Compliance
As rooftop solar, battery storage and community solar grow, utilities must verify each one meets IEEE 1547 interconnection requirements. PMI recorders capture voltage, frequency, harmonic distortion and anti-islanding behavior — both during commissioning and ongoing operation. That gives you solid data for regulatory filings and interconnection agreements.
Electric Vehicle Charging Impact Studies
Fast-charging stations can draw hundreds of kilowatts in seconds. That creates voltage sags, harmonic currents and flicker that affect neighboring customers. Deploy a Seeker or Revolution recorder at the service entrance or upstream transformer, and planners can quantify EV charging impact, size infrastructure upgrades, and answer complaints with measured evidence.
Substation & Feeder Monitoring
Substation engineers use the Revolution recorder to capture sub-cycle transients, high-order harmonics and fault signatures that drive protective relay performance. Long-term feeder deployments reveal seasonal load patterns, harmonic buildup from non-linear loads, and early signs of equipment wear. Pair it with Merlin™ for automated event classification across your fleet.
Customer Complaint Investigation
When a commercial or industrial customer reports nuisance tripping, flickering lights or equipment damage, crews deploy the Seeker to capture a complete power quality profile at the point of use. Every sag, swell, transient and harmonic event gets logged. That lets engineers pinpoint whether the disturbance started on the utility side or inside the customer’s facility. Merlin™ speeds up root-cause diagnosis by classifying events automatically.
Industrial & Commercial Power Quality Audits
Large industrial customers and campus operators rely on PMI recorders to audit electrical systems, verify utility service quality, and document harmonic contribution under IEEE 519 guidelines. The Bolt and Revolution are commonly deployed at service entrances, main switchgear and critical loads to build a complete facility-wide picture.
FAQ
Power Quality Monitoring: Frequently Asked Questions
Quick answers to the questions utility engineers, planners and compliance teams ask most often.
What is power quality monitoring?
Power quality monitoring is the ongoing measurement of electrical parameters like voltage, current, harmonics, sags, swells, flicker and transients. The goal is a stable, reliable power supply. Utilities rely on power quality analyzers and recorders to catch disturbances before they damage equipment or disrupt service.
What causes poor power quality on the grid?
Poor power quality has several common causes: aging infrastructure, non-linear loads from sensitive electronics, distributed energy resources like rooftop solar and battery storage, electric vehicle charging, lightning strikes, switching operations, and faults on the distribution system. Each one can introduce voltage sags, harmonics, flicker or transients into the grid.
What is IEEE 1547 and why does it matter for utilities?
IEEE 1547 is the standard for interconnecting distributed energy resources with electric power systems. It defines voltage, frequency, power quality and anti-islanding requirements that DERs must meet. Utilities use power quality recorders like the PMI Bolt and Revolution to verify IEEE 1547 compliance, both during interconnection testing and ongoing operation.
How do electric vehicles and DERs affect power quality?
Electric vehicles and distributed energy resources create bidirectional power flows. Their inverters inject harmonics, and they can cause voltage fluctuations during fast charging or intermittent generation. Monitoring these impacts requires high-resolution recorders that capture sub-cycle events — the kind lower-resolution meters miss.
What is the difference between a power quality analyzer and a recorder?
A power quality analyzer is typically a handheld instrument for short-term troubleshooting. A power quality recorder is built for long-term deployment — continuously logging voltage, current and disturbance data over days, weeks or months for trend analysis and compliance reporting. The PMI Seeker bridges both roles.
What is Merlin™ and how does it help with power quality analysis?
Merlin™ is PMI’s AI-powered power quality analytics platform. It automatically identifies, classifies and diagnoses disturbances captured by Bolt, Seeker and Revolution recorders. That cuts the time engineers spend manually reviewing events and helps surface root causes faster. Merlin™ works across your entire fleet, learning from every event you capture.
How many samples per cycle are needed for accurate power quality monitoring?
It depends on what you need to capture. Standard disturbance monitoring works fine at 256 samples per cycle (Bolt). High-resolution transient analysis benefits from more: 4,166 samples/cycle on Seeker, or 16,666 samples/cycle on Revolution. Higher sampling rates catch faster transients and higher-order harmonics that lower-resolution meters miss.
Resources & Training
Power Quality White Paper Library
Dive into 425+ technical white papers covering voltage sag analysis, harmonic resonance, DER interconnection testing and IEEE compliance. A trusted reference for utility engineers, consultants and academic researchers.
Free Power Quality Resources & Training
Access on-demand webinars, live classes and step-by-step support articles taught by PMI power quality experts.
Explore the Grid: OpenGridWorks Map
See where the grid actually lives. OpenGridWorks is a free interactive map of the world’s power infrastructure — plants, transmission lines, substations and data centers — built from open data sources like OpenStreetMap, EIA and Global Energy Monitor. A handy way to see how PMI’s monitoring points fit into the bigger picture.