• Skip to primary navigation
  • Skip to main content

PMI

  • Home
  • Products
  • Library
    • Videos
      • All
      • Bolt Quality Tests
      • Promotional Videos
      • Support Videos
      • Power Quality Decoded
    • White Papers
      • All
      • Artificial Intelligence
      • Case Studies
      • Communications
        • All Communications
        • Cellular Communications
        • General Communications
      • Distributed Generation
      • IEEE Standards
      • Power Quality
        • All Power Quality
        • Analyzing Waveforms
        • Flicker
        • PQ Data Analysis
        • PQ Theory
      • Products
        • All Products
        • Boomerang
        • Boomerang SCADA
        • Box Recorder
        • Canvass
        • Eagle
        • Flex CT
        • Guardian
        • Merlin™
        • Meter Sockets
        • PQ Canvass
        • ProVision
        • Revolution
        • TLAR
        • Using PMI Recorders
      • Voltage
        • All Voltage
        • CVR
        • Voltage Sag
        • Voltage Unbalance
      • Harmonics
  • Training
    • All
    • PDH Eligible Classes
    • On-Site Training
    • Live Webinars
  • Support
  • Our Company
    • About
    • Contact
    • Join Our Team!
    • Receive our Newsletter
    • PQ Resources
    • Power Quality Solutions
  • Account
  • Cart - 0 items
ProVision logo treatment
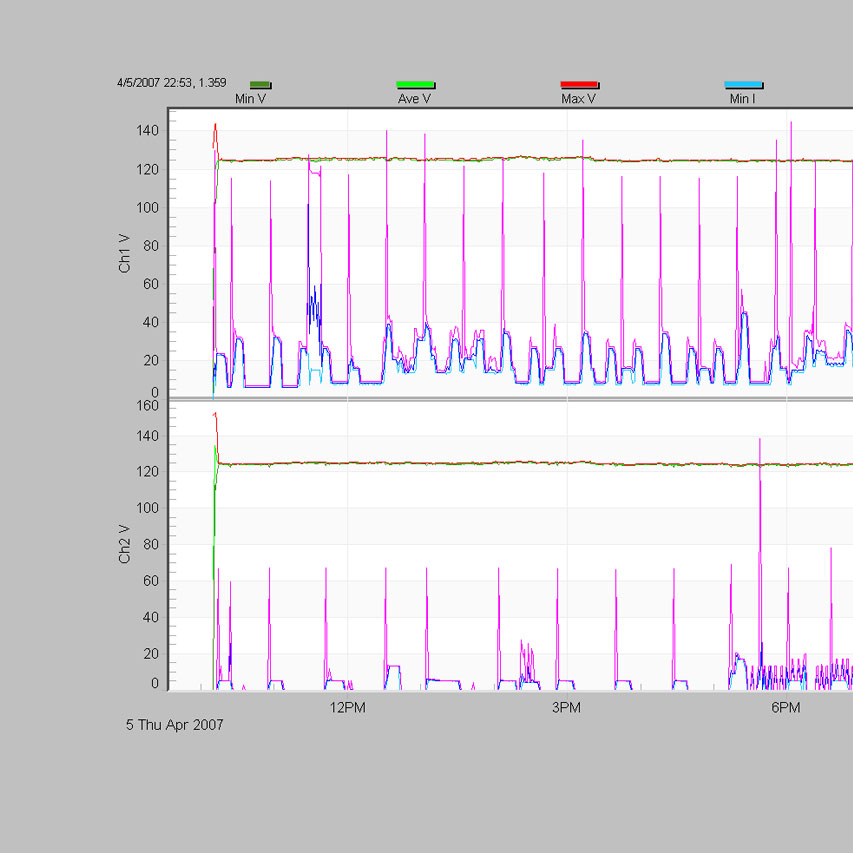
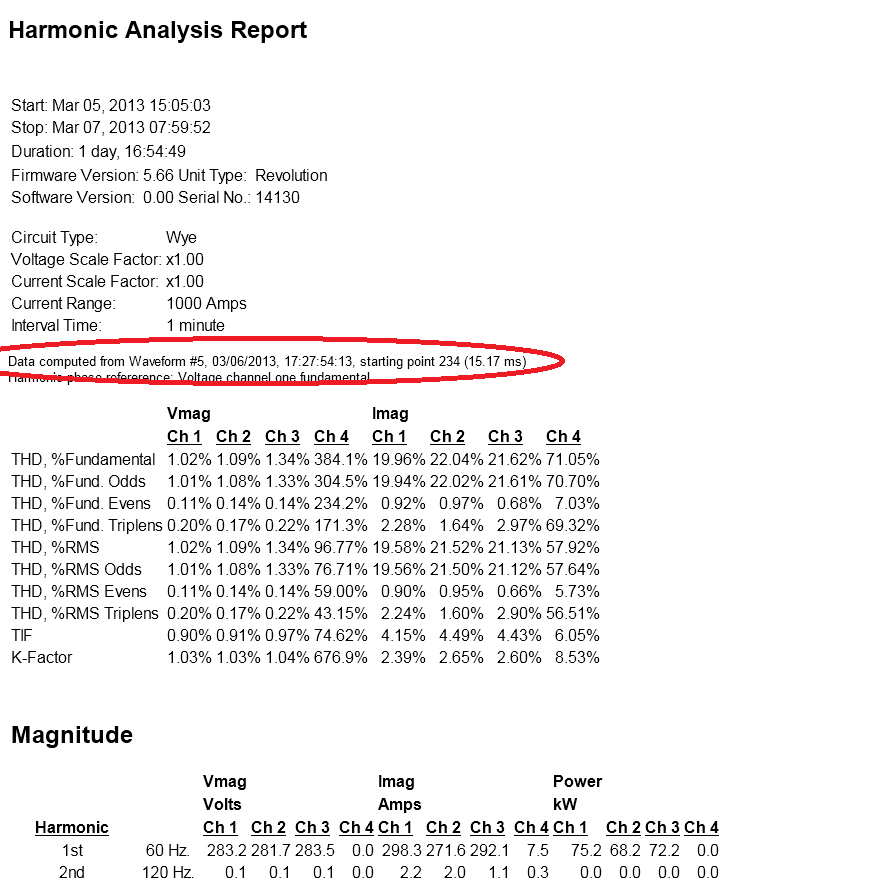
provisionfig6provisionhr_fig2

ProVision PC Software

$0.00

Need more flexibility?

ProVision® is PMI’s popular power quality analysis software for PCs. ProVision’s wireless communication features make it possible to remotely initialize, schedule, download, and manage multiple PQ analyzers from within a single GUI. For compatible devices like the Revolution, ProVision now features a number of important improvements including support for instant text and e-mail alerts, CBEMA/ITIC measurements, network time sync, and interharmonics. All recorder settings are viewable and configurable in real-time on your laptop or desktop PC. Once data is downloaded to your computer, ProVision gives you unprecedented control over the way it’s viewed, managed and reported. Create, print, and export custom reports or utilize included reports. ProVision’s graphical user interface (GUI) is designed so it’s not only easier to use, but also more flexible in the way it manages and reports power quality data.

To learn more about ProVision watch the online training webinar on the PMI YouTube channel.

Download (Login Required)

Have a PQ Question? Ask Merlin™ — Free

Send it to askmerlin@powermonitors.com or text (540) 383-3144

  • White papers

White papers

  • Why You Should Transition ProVision to PQCanvass
  • Interharmonic Analysis with Python
  • Automatic IEEE 519 Report Generation
  • Impact Loading
  • ProVision Recording Templates
  • Introduction to Solid State Power Transformers
  • ProVision Customization
  • New Graph Templates for Interharmonics
  • Using 3D Graphs in ProVision
  • Analyzing Voltage Sags with Event Change
  • New Graph Templates for Distributed Generation
  • Measuring Power
  • TDD and IEEE 519:2014
  • Using Cycle Stripcharts
  • Viewing PQCanvass Boomerang Data in ProVision
  • Getting Started with Stripchart Analysis in ProVision
  • Using the Properties Panel to Enhance Graphs and Annotations
  • Transferring ProVision Recordings to PQCanvass
  • Measuring and Analyzing Voltage Regulation
  • Analyzing Voltage Sags with ProVision
  • Power Flow: Consumption vs. Generation
  • Net Metering in ProVision
  • Oscillatory Transient Ring Frequency
  • Interharmonics in ProVision
  • Top Ten Field Tips for PMI Recorders and ProVision
  • Waveform Capture with Transient Capture Overlays
  • Spot Sags, Loose Neutrals, THD, and More with Custom Graphs
  • Data Collection During Quick Fluctuations in Line Voltage
  • Software to Diagnose Power Quality Issues
  • Understanding Harmonic Power
  • Getting Started with Harmonics
  • Merging Recordings in ProVision
  • Quickly Creating PQ Reports
  • Views in ProVision
  • Migrating ProVision to a New Computer
  • Easy to Use Harmonic Graphs in ProVision
  • Installing Firmware for ProVision
  • Exporting Harmonics with the ProVision Bulk Export Tool
  • In Place Updating with ProVision
  • Batch Converting XSF Data Files
  • Downloading ProVision Software and Updates
  • Scope and Meter Displays in ProVision Mobile
  • Downloading a Recording with ProVision Mobile
  • Communicating with the Field PC and ProVision Mobile
  • PMI Data File Formats
  • Custom Initialization Templates for Application Recorder Setup
  • Creating Custom Shortcuts in ProVision
  • Automating ProVision Installation and Uninstallation
  • Automated Operations with the Scheduler Service
  • Exporting Data from ProVision

Related products

  • Orange - PMI PQCanvass Logo

    PQ Canvass Access

    view more
  • PMIView for iOS Thumbnail

    PMI View

    view more
  • PMI View Windows

    PMI View Windows

    view more

Have a PQ question? Ask Merlin™ — free. Send it to askmerlin@powermonitors.com or text (540) 383-3144.

Power Monitors, Inc. — Tools you Need. People you Trust.

Power Monitors, Inc. is an industry-leading product design and manufacturing firm based in Mt. Crawford, Virginia. PMI® strives to solve power quality problems by listening to our customers and working with them to design and manufacture products. Total customer satisfaction is the primary goal of all PMI® staff.

24/7 Tech Support 800.296.4120

Resources

  • White Papers
  • Videos
  • Training
  • Live Webinars
  • PQ Resources
  • Support

Company

  • About Us
  • Contact
  • Careers
  • Newsletter
  • Product Registration
  • Terms & Conditions
800 N Main St, Mt Crawford, VA 22841 | Toll Free 800.296.4120 | Fax 540.432.9430
© 2026 Power Monitors, Inc.