
Select ‘recent downloads’ or another watcher name, then right-click the mouse and select ‘Open in Explorer’. In the window that opens, right-click and delete the target data file.
FAQs
Select the data file, right-click the mouse and select copy, then select the destination watcher folder, right-click the mouse and select paste. This creates a second copy of the data file.
Select the data file and left-click the mouse to drag the file from one watcher to another.
To open a ProVision data file, double click on the file name in the recent downloads folder or another watcher folder. The header report will be displayed. Alternatively, place a check in the box to the left of the data file name, and then select any report or graph under the menu toolbar tabs.
A watcher folder gives the user the ability to store and open ProVision data files in locations other than the default C: drive location. Commonly, watcher folders are configured to access network drives, making it easier to share data files with other users. When downloading a data file from a PMI recorder, the user can select a watcher folder as the stored location, or can store the data file to the default recent downloads location and move or copy the data file to the watcher folder at a later time.
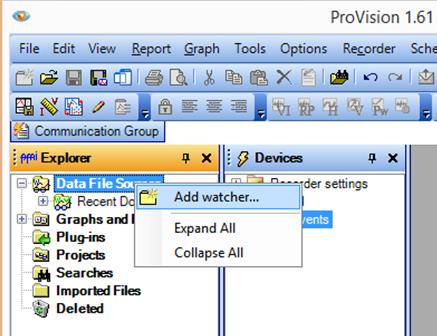
Right-click on ‘Data File Sources’ to add a new watcher folder
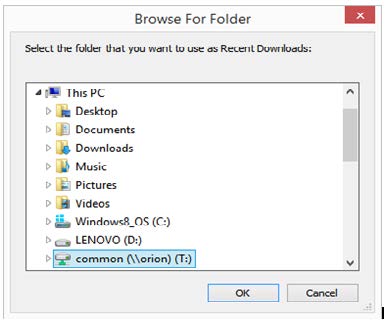
Select Add watcher then select the location of the new watcher folder
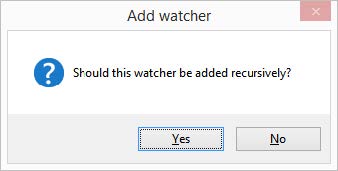
A watcher added recursively will display all subfolders in addition to the data files
In the explorer tree of Provision, right click on ‘Recent Downloads’ select ‘Open in Explorer’. A window with all your data files will open. You can copy and paste from here to your email. If the file is larger than 10 Mb, you can right click on the file name and select ‘Send To’ then ‘Compressed (zipped) folder’. This creates a <filename>.zip folder.
Click the Options menu, and select Preferences. NOTE: Unfamiliarity with these choices when changing settings may have undesirable results.
- Select file by checking box left of the file name under PMI Explorer Window
- Click Report or Graph menu and select desired report or graph or double-click on the file name to open the header report
- To create a custom graph or report, use the custom graph wizard
- (Click Tools menu and select Custom Graph Wizard)
Click on the recorder menu and select download recording. Name the recording when finished and initialize.
New Provision versions check for firmware updated.
To manually download firmware go to: https://www.powermonitors.com/downloads and click the software tab.
• Click options menu and select show advanced operations
• Click recorder menu and select upload firmware
Make sure recorder is in ready mode, click on recorder menu and choose from waveform graph or meter display submenus.
Click Recorder menu and select Date and Time. To synchronize recorder time with PC time, check box for Use PC Time and click OK.