
Abstract
PMI Revolution recorders can record waveform captures and, with the transient capture option, high-speed microsecond-level transient captures. Transient captures have a much higher sampling rate than waveform captures but have a shorter recording duration. Transient and waveform captures are both triggered by changes in voltage, and both record a time series of raw data samples.
A new ProVision graphing feature allows the waveform and the transient captures to be shown on the same graph. This feature was added in ProVision 1.70 build 6484 and Revolution firmware build 5.82. Overlaying high speed transient captures onto lower-speed, but longer duration standard waveform graphs allows for a more detailed analysis of complex events.
Transient Captures
Transient capture is triggered by exceeding the configured peak voltage threshold on any voltage channel. If the instantaneous voltage (e.g. one or more 1-microsecond samples) exceeds the threshold, a transient capture is triggered. With a 1 MHz sampling rate, 1000 samples is a 1 millisecond time period. If the voltage falls below the negative of the threshold, a transient is also triggered. When a transient is triggered, a 1000 sample transient waveform is captured for all voltage and current channels. This is long enough to capture most high-speed impulse transients; but if the event still exceeds a threshold after 1 millisecond, another transient capture will trigger immediately.
Although most power quality events are easily measured with the sampling characteristics used by the Waveform Capture, a small, but important set are not. Transients caused by high-speed events such as lightning strikes, arcing from switches (e.g. cap bank or tap changer operations), or excitation of local high-frequency resonances can occur in just hundreds or even tens of microseconds. The peak value of such transients can exceed thousands of volts, even if just for a few microseconds.
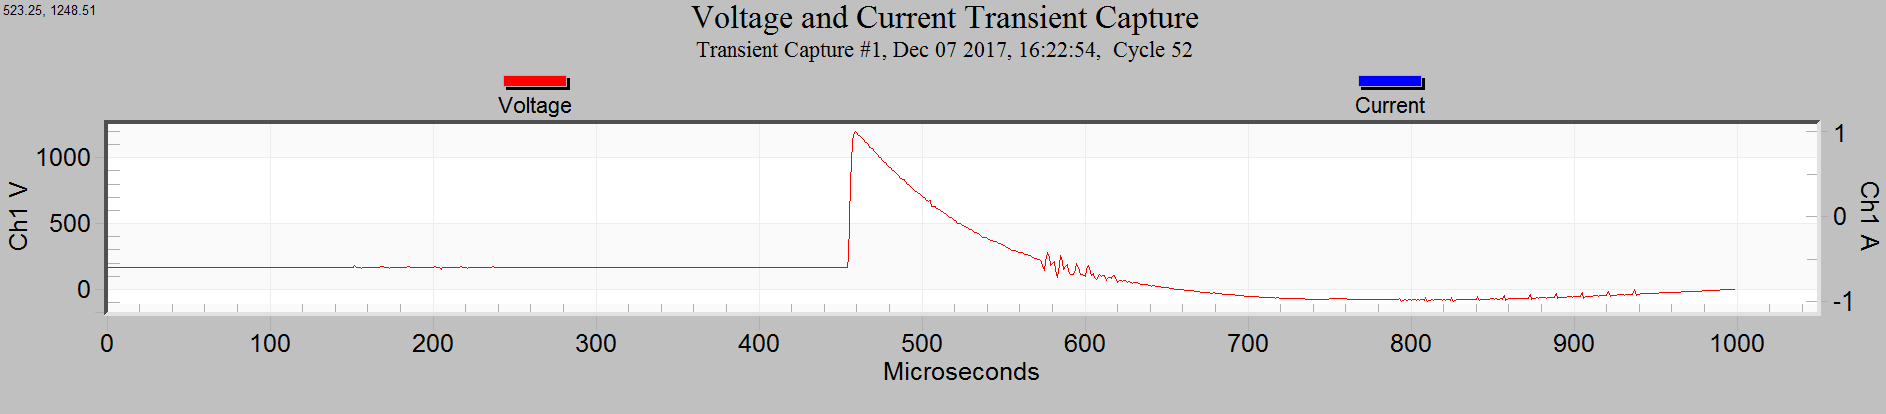
Figure 1 shows a ProVision voltage and current transient capture graph. Transient Capture parameters can be setup in the Transients tab of the Recorder Settings page. See the whitepaper “Transient Capture with the Vision and Revolution” for more information about configuring Revolutions for Transient Capture.
Waveform Captures
Waveform captures are triggered by exceeding the configured threshold triggers. For each trigger, there’s a parameter measured every 60Hz cycle. Each cycle the value is compared to the previous cycle’s value: the difference exceeds the threshold, the trigger is fired.
Waveform captures are recorded by default at 256 samples per cycle. The Revolution 1MHz sampling rate used for transients is then downsampled to for the 256 samples per cycle data used by the Waveform Captures, RMS and power calculations, etc. The waveform capture sampling is roughly 65 times slower than the transient capture recording. The slower capturing rate allows waveforms captures to store data for a much longer time period than the transient capture. The waveform capture shows several cycles per capture. The number of cycles show in the waveform capture is configurable using the ProVision Settings Wizard.
Figure 2 shows a voltage and current waveform capture graph.
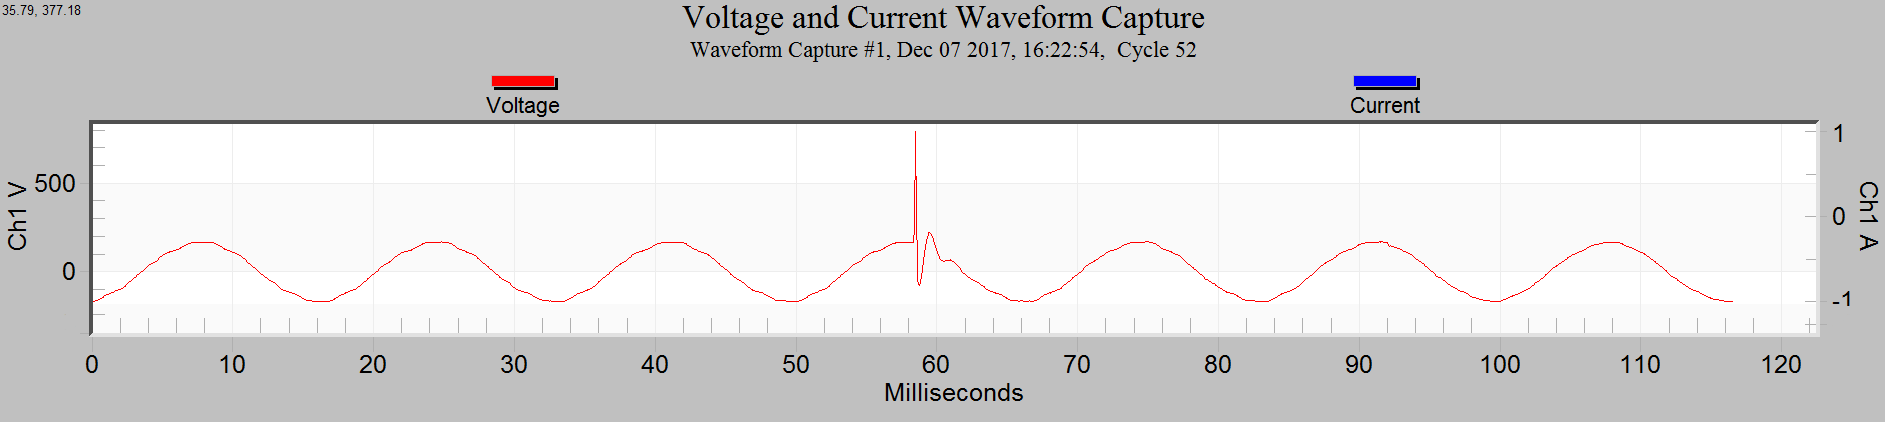
Revolutions can be configured to “cross trigger” a waveform capture when a transient capture is recorded. This is an important configuration option to use when desiring to show both the transient and the waveform captures on the same graph. See the whitepaper “Transient Capture vs. Waveform Capture” for more information about configuring Transient and Waveform captures and detailed descriptions for what they provide.
Showing Transients in Waveform Capture
ProVision waveform capture graphs can now show the waveform graph overlaid with the transient traces. These overlapping views are show from the waveform capture graph.
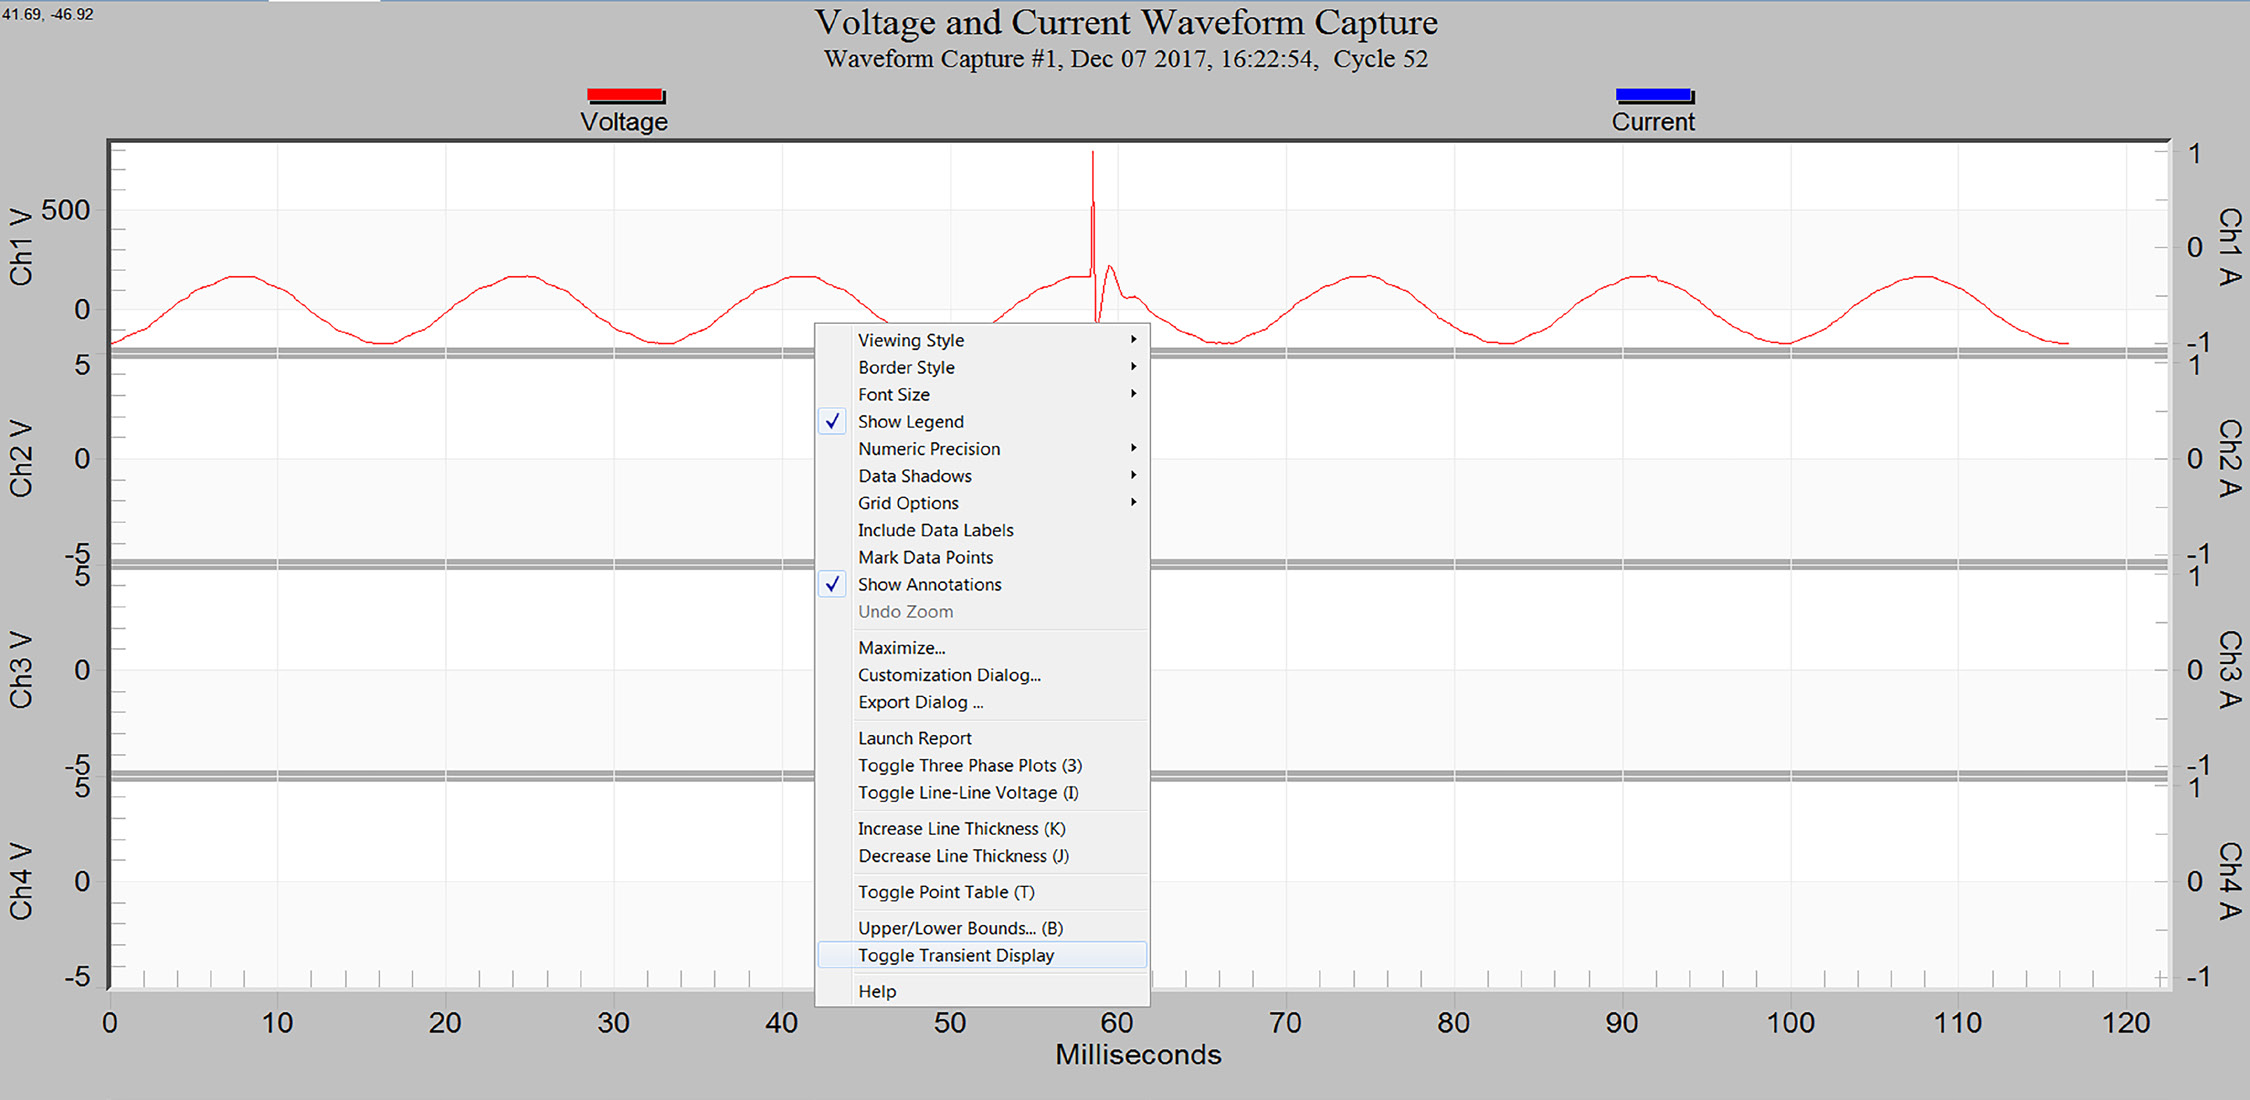
To show transient traces in the waveform capture graph right click the mouse and choose “Toggle Transient Display” from the displayed menu (See Figure 3). When “Toggle Transient Display” is selected the transient capture voltage traces will be added to the waveform capture graph. Figure 4 shows the transient capture traces added to the waveform capture graph. If no transient captures are available for the timespan covered by the waveform graph then no changes are shown. The toggle stays selected when the page down/page up key are pressed to “page” through the waveforms showing any overlapping transients during the timespan of the waveform capture.
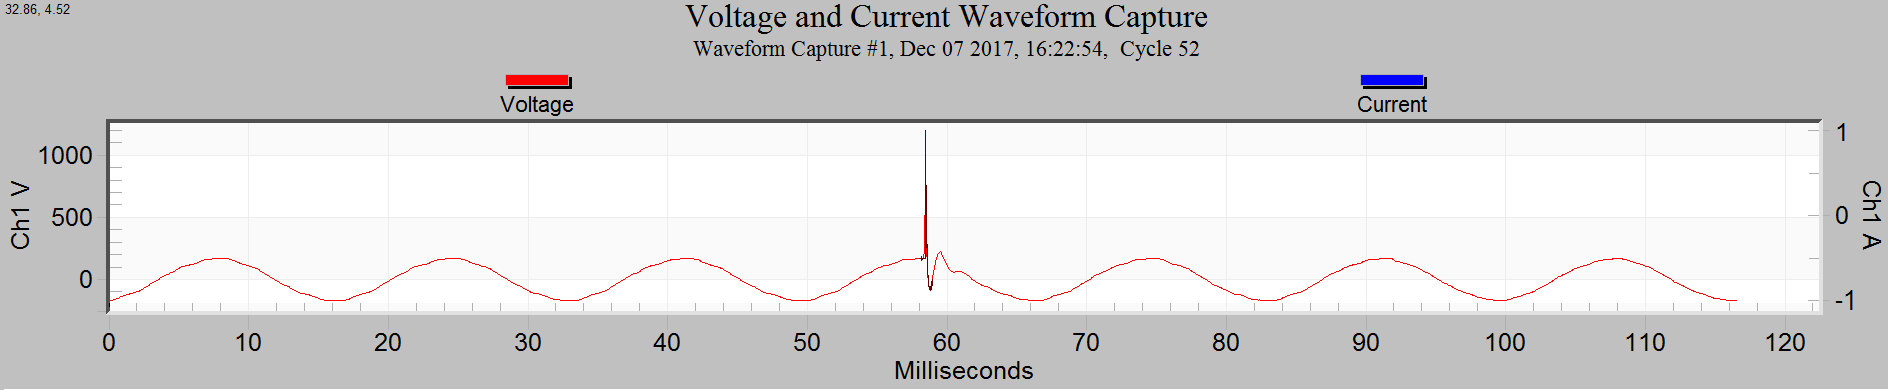
The transient trace is of a short duration that it contained in a few waveform capture points. Figure 5 shows this same graph “zoomed” to show more detail. Figure 6 shows the graph with “Mark Data Points” options is selected. Mark Data Points option is available in the same menu as Toggle Transient Display (see Figure 3). This shows that the transient capture has much more detail, many more points per time period. The transient capture has a thousand points of detail in the space of about sixteen and a half waveform points.
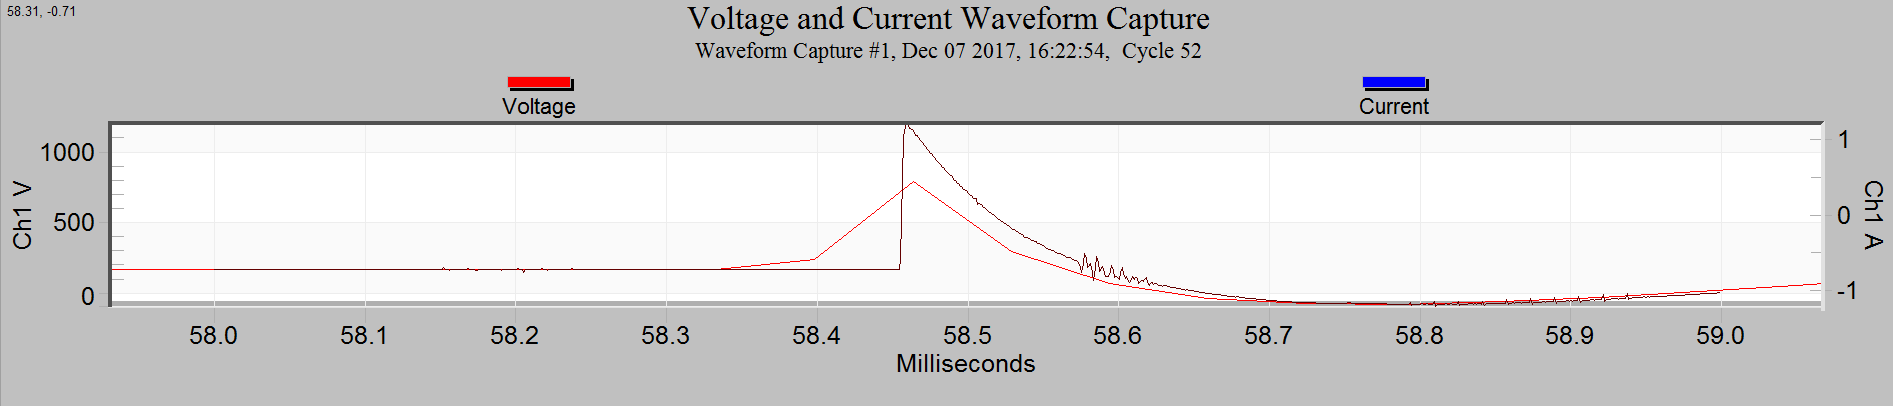
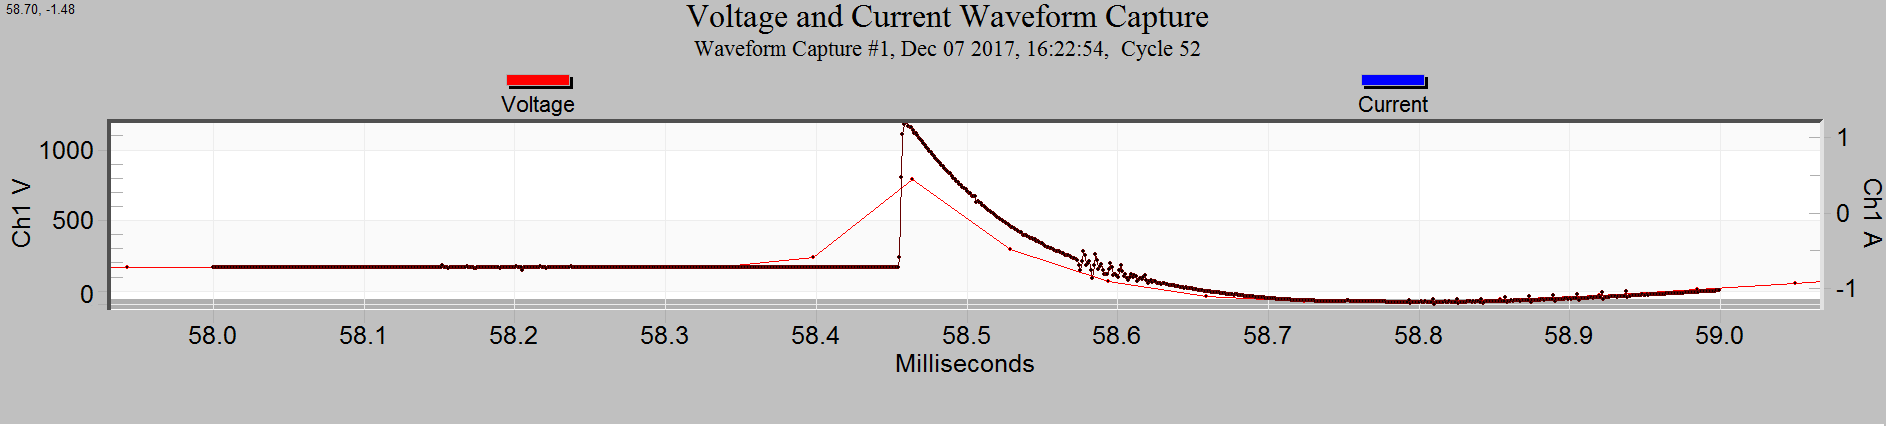
The ability to show both the transient and waveform captures on the same graph allows greater analysis of high speed events. The transient capture allows detailed analysis helping to determine the cause of the transient and the waveform capture can show the data leading up to and following the transient.
The Revolution firmware version 5.82 added support for aligning the transient and waveform captures. ProVision attempts to align the transient and waveform captures from recordings with older firmware. This alignment attempt may not be as accurate with recordings made with older firmware compared to recordings using the newer firmware that added transient alignment support.
Conclusion
High speed impulsive transients are an important power quality event to capture and measure accurately. The Revolution’s 1 MHz sampling and ± 5 kV input range for transients provides the recording ability to catch these events. The latest ProVision and Revolution updates enable mixed transient and standard waveform graphs, enabling direct comparison of peak voltage and longer-term event trending at one time.