Canvass Web Software
The Canvass system includes a database in the PMI data center, and web-based data analysis software. All Boomerang data is available any time, all from a web browser.
To get started, load http://canvass.powermonitors.com/util/register.jsp in a browser. You will be prompted to either register or log in.
Boomerang
The Boomerang is a single-phase voltage monitor with an integrated cell phone modem. Available in a Form 2S meter socket adapter, standalone box configuration, or 120V plug-in, the Boomerang works with CANVASS web-based data analysis software to provide a complete voltage picture.
The Boomerang collects RMS voltage data on a one second basis. Every 30 minutes, most recent 1800 one-second RMS values are sent to the PMI data center, for storage in the Canvass database. With this system, all data collection is performed continuously by the Canvass database – no data is stored in the Boomerang, and no recording download operation is required by the user. The data is always available via Canvass, automatically. As soon as the Boomerang is installed, it links with Canvass – no user setup is required at all. The latest realtime readings are always available via the Canvass interface.
After logging in, a map of Boomerangs will be displayed. Active Boomerangs are displayed in blue, inactive ones in grey. A Boomerang in an alert condition (due to voltage threshold exceedance) are shown in orange. Click on a Boomerang to display its status window.
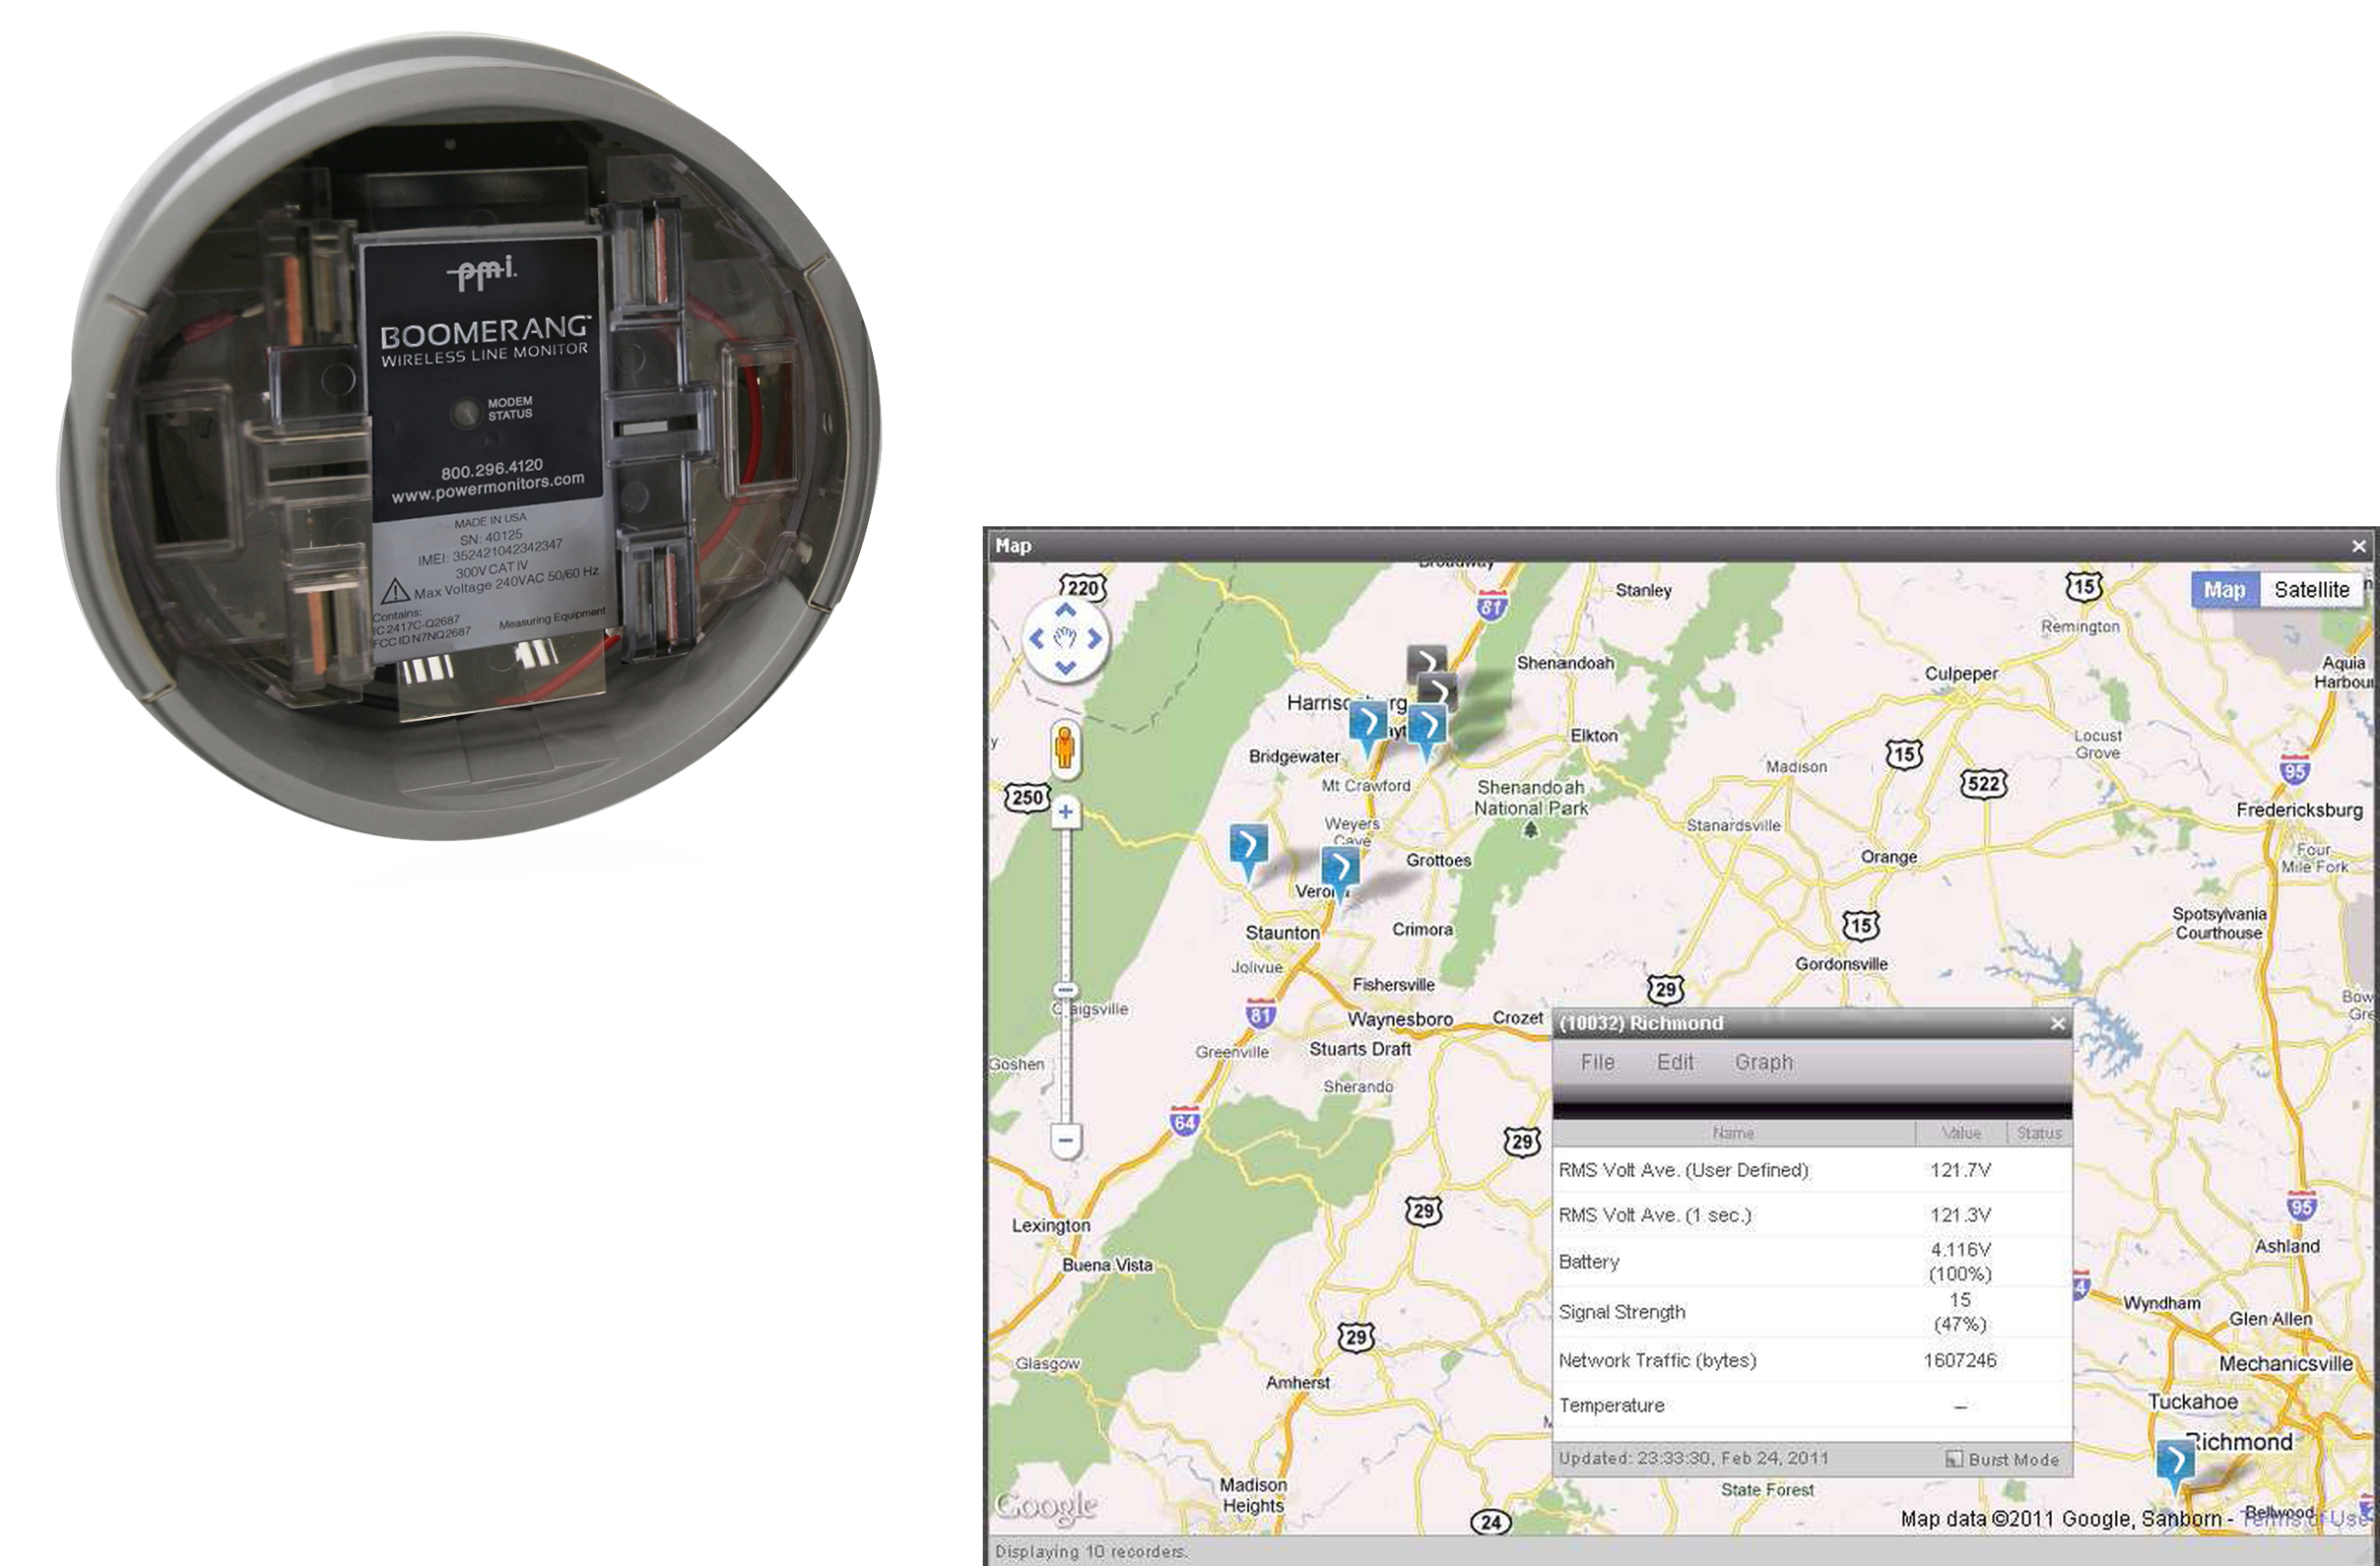
The Boomerang status window shows the latest real-time readings. Two RMS types are shown: the one-second RMS value, and a user-defined average voltage (e.g. a 5 minute average voltage). In addition, status information such as internal battery voltage, modem signal strength, and total cell network traffic are displayed.
The menus in the status window are used for graphing and device setup.
Specifications
| Measured Quantities | 1 second RMS voltage, frequency |
|---|---|
| Input Range | 80–300V RMS |
| Accuracy | 0.50% |
| Resolution | 0.1V |
| Temperature Range | -22°F to 130°F |
Completely Programmable
The Boomerang can also be programmed to send e-mail or SMS text message alerts, based on programmable voltage thresholds, or power outages. These alerts are also stored in the Canvass database, for analysis later.
In addition to the Canvass data link, the Boomerang also includes a DNP3 TCP link. This can be set up to work with a SCADA system. The full-featured DNP3 interface includes analog points for RMS voltage, frequency, and modem signal strength, and fully configurable event thresholds for voltage triggers. Events can be polled, or reported via unsolicited report by exception.
Graph Options
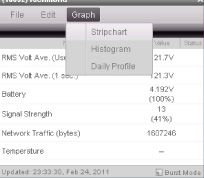
Under Graph, there are three graph types displayed: Stripchart, Histogram, and Daily Profile.
These graphs are all generated from the data in the Canvass database, using the one-second RMS voltage information.
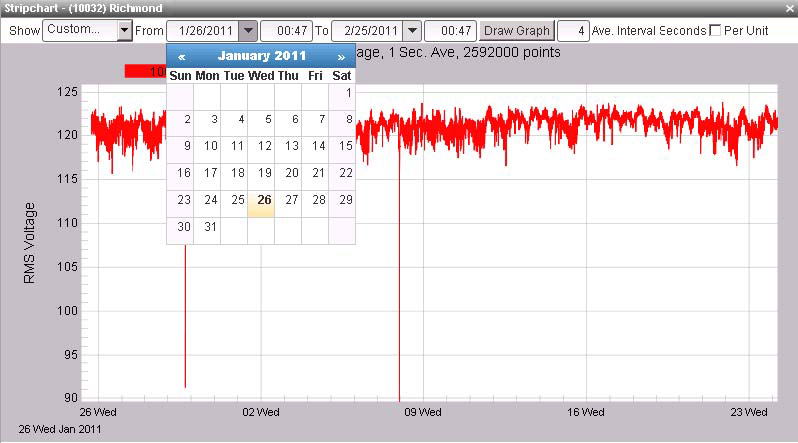
Choosing “Stripchart” will generate a new window, as shown in Figure 3. The default stripchart graphs the last four hours of data, using 1 second RMS values.
Stripchart
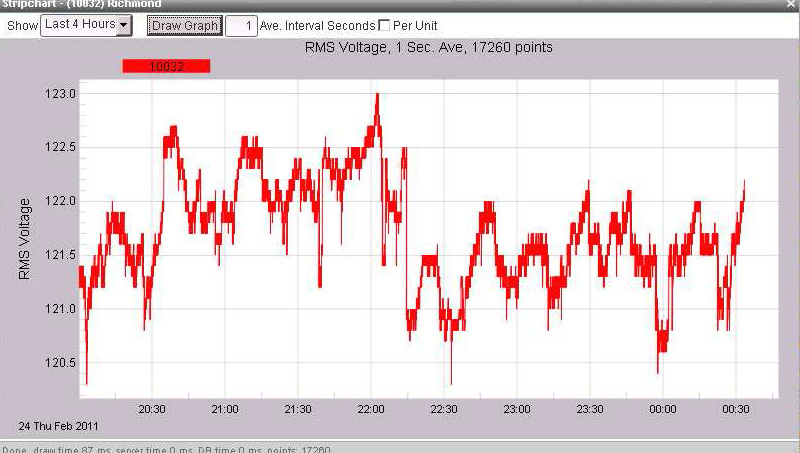
The stripchart start and stop times can be changed to several built-in values (e.g. the last week, last month, etc.) or adjusted to any custom date range. The graph can include all data ever recorded by the Boomerang – there’s no limit to the size of the graph, and since Boomerang is continuously sending data to the database, there are no gaps in the data, or start or stop time in a recording. All the graph types also feature an adjustable averaging interval. By default, the graphs use the raw one second RMS voltage values. This interval is adjustable for each graph. For example, a 5 minute interval may be used, to smooth out sags, if long-term average voltage is desired. Just enter the averaging interval in the input field at the top of the graph, and click “Draw Graph” to redraw the plot.
Full Zoom Control
Full zoom controls are also available. Just click in the graph, hold down the left mouse button, and draw a zoom window on the graph (just like ProVision and Winscan). The graph will zoom to the desired extent. Some of the hotkeys utilized in ProVision also work with Canvass:
- U – Undo a zoom level.
- Z – Undo all zoom.
And here is a new one:
- O – Double the current time span.
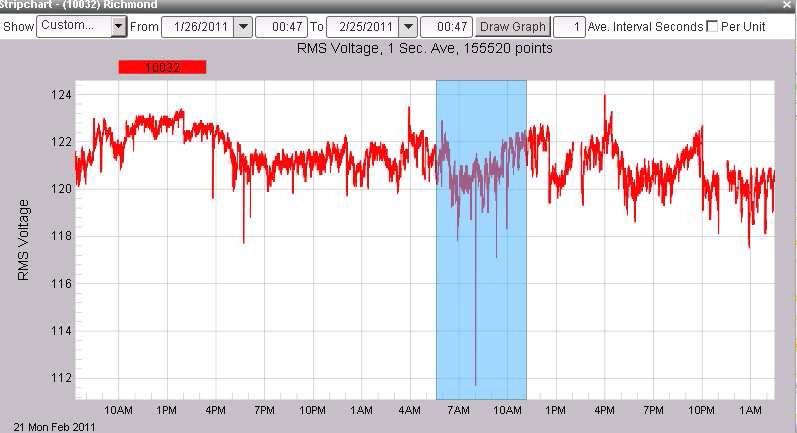
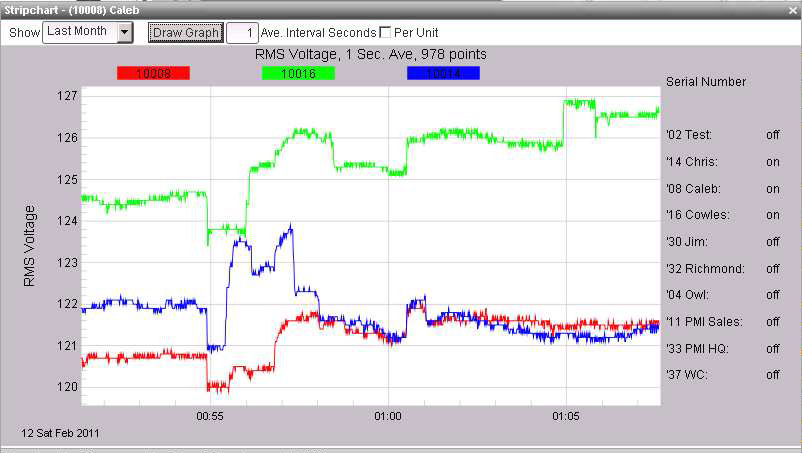
The “T” hotkey toggles the Boomerang list on the right side. This pulls up a list of all Boomerangs in the group. Click Off or On displays or hides other Boomerang traces on the graph. This makes it very easy to compare voltages at different locations, and find correlations across a distribution system.
Histogram
The Histogram graph displays the number of seconds the voltage was at each voltage level (shown in Figure 7).
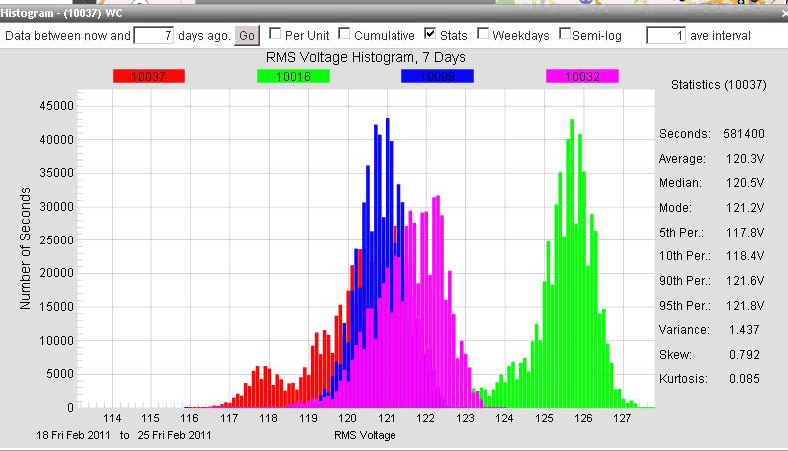
Adjustable parameters include a log plot, interval average size, and how many days to include in the histogram. As with the stripchart, the T hotkey toggles the Boomerang list, allowing the selection of multiple Boomerangs, but it also can display statistics from the histogram. The “Stats” checkbox determines whether the Boomerang list or stats list is displayed. The “Weekdays” checkbox enables just weekdays only (no weekends), or all days of the week.
Daily Profile Graph
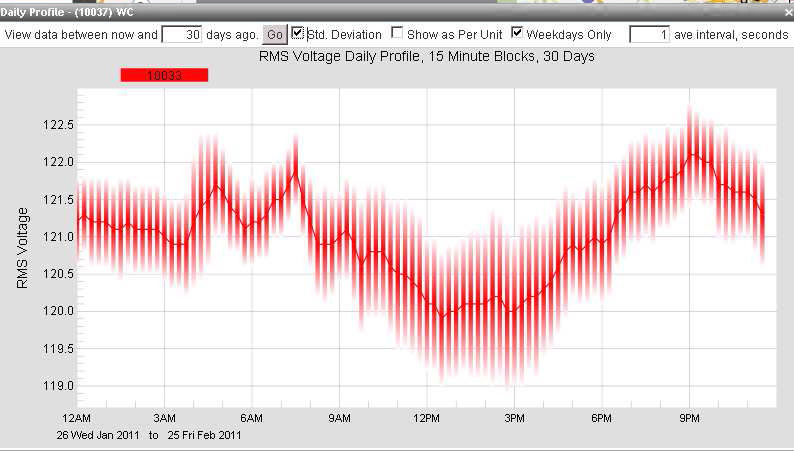
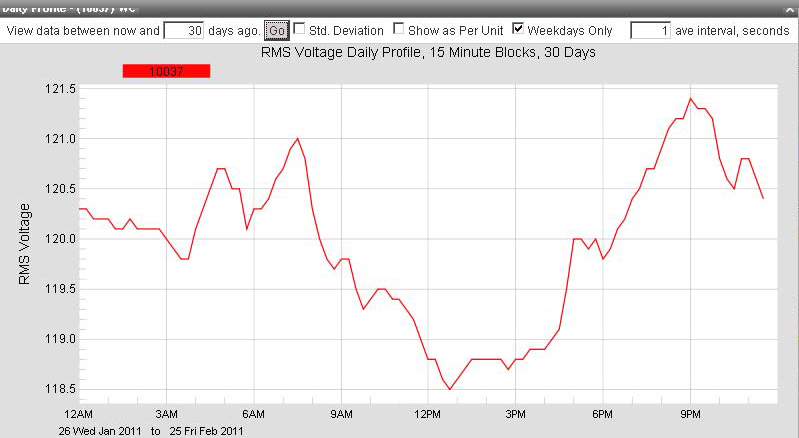
The Daily Profile graph shows the “average” 24 hour period, for the selected timestamp. Below, a 30 day profile is shown. Each 15 minute block in the 24 hour period is averaged across all days, and these 15 minute blocks are graphed, to show the typical daily trend. As with the Histogram graph, the timestamp, averaging interval, and weekdays-only parameters are adjustable.
Standard Deviation
The “Std. Deviation” checkbox enables the graphical display of the standard deviation for each 15 minute block. This is shown as shaded bars, and indicates how much the voltage varied within that block. In the graph on the right, the voltage varied the most between 9am and 5pm, which is also the period with the lowest average voltage.