
Abstract
The ProVision Publication Wizard is a quick way to create finished documents from individual graphs and reports. Use the wizard to create publication templates for different PQ applications, and then use them on data files as needed for fast, rich report creation. The template may include any ProVision graph or report, including stripcharts, histograms, Event Capture, etc. This paper describes the ProVision Publisher and details its usage.
Creating a Publication Template with the ProVision Publisher Wizard
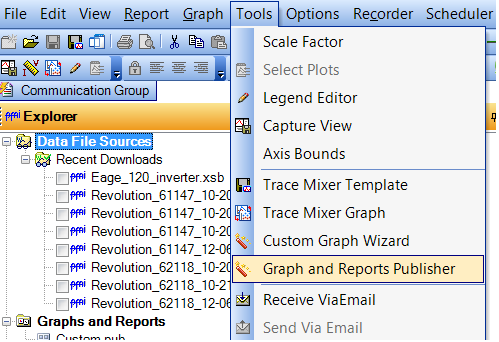
The ProVision Publisher Wizard is launched from the tools menu in ProVision (See Figure 1). The first Publisher Wizard page is used to select which reports and/or graphs are placed in the publication template (See Figure 2). Available items are in the left pane and selected items are in the right pane.
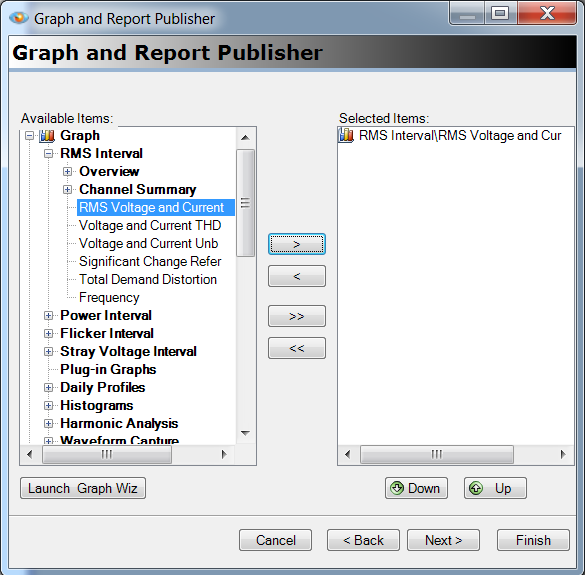
Any graph or report can be selected for the publication including custom graphs and reports. If an additional custom graph is desired, the Launch Graph Wiz button is used to launch the custom graph wizard to create custom graphs. These custom graphs then can be included in the publication template. See the PMI white papers “Creating Custom Graphs for Harmonic Analysis” and “Spot Sags, Loose Neutrals, THD, and More with Custom Graphs” for more information about creating custom graphs.
Reports and graphs are executed in the order found in the Selected Items pane. Report and graph execution order can be changed with the up and down arrow buttons. When report and graph selection is completed, the Next button can be used to go to the next Publisher Wizard page.
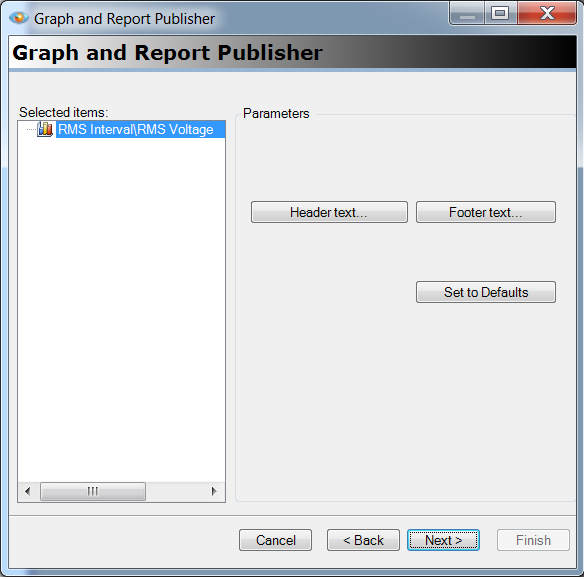
The next Publisher Wizard page is used to format how the reports and graphs are presented in the publication (See Figure 3). The header text and/or the footer text can be changed by using the appropriate buttons. The header and footer text is placed on the top and bottom of each publication page.
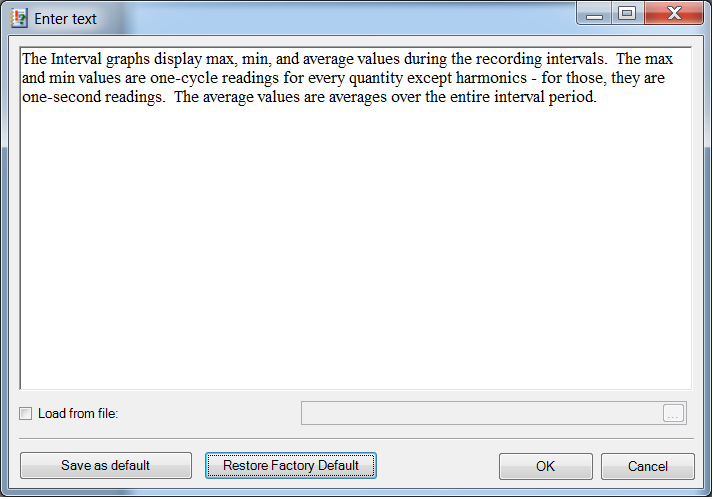
The header and footer text editing dialog is shown in Figure 4. By using this dialog, the header and footer text can be changed. Optionally, the header and the footer can be retrieved from a file. Any RTF file can be selected. Microsoft Word can save files with an RTF extension. This allows graphics and logos to be added to the publication. When the checkbox “Load from file” is selected, the header text field is removed and the file selection is enabled. Choosing the file option can be used to enhance the publication with company specific graphics and text.
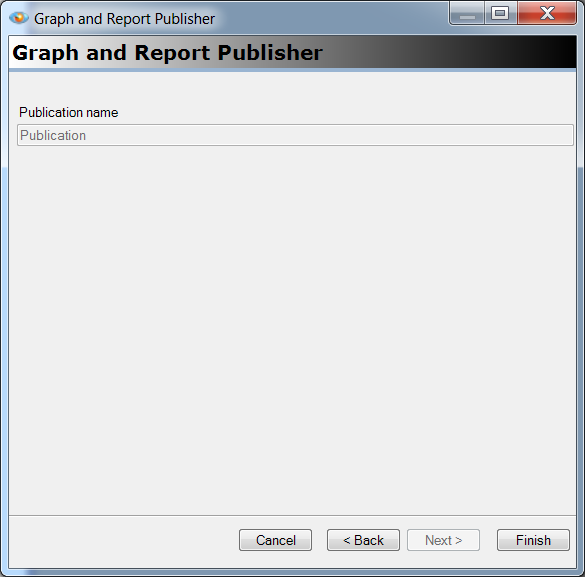
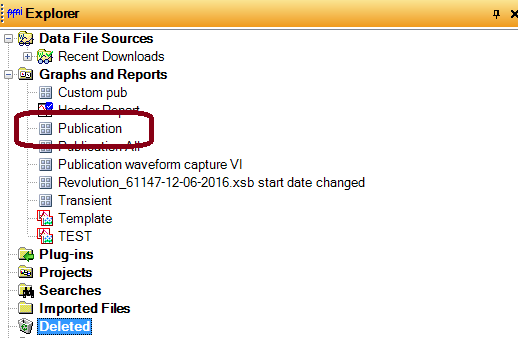
The next Publisher Wizard page is used to name the publication template (See Figure 5). An informative name can be helpful in distinguishing publications. Enter the name for the publication template and press the Finish button. When the finish button is pressed, the publication template is created and placed in the explorer tree (See Figure 6).
Creating a Publication Using a Publication Template
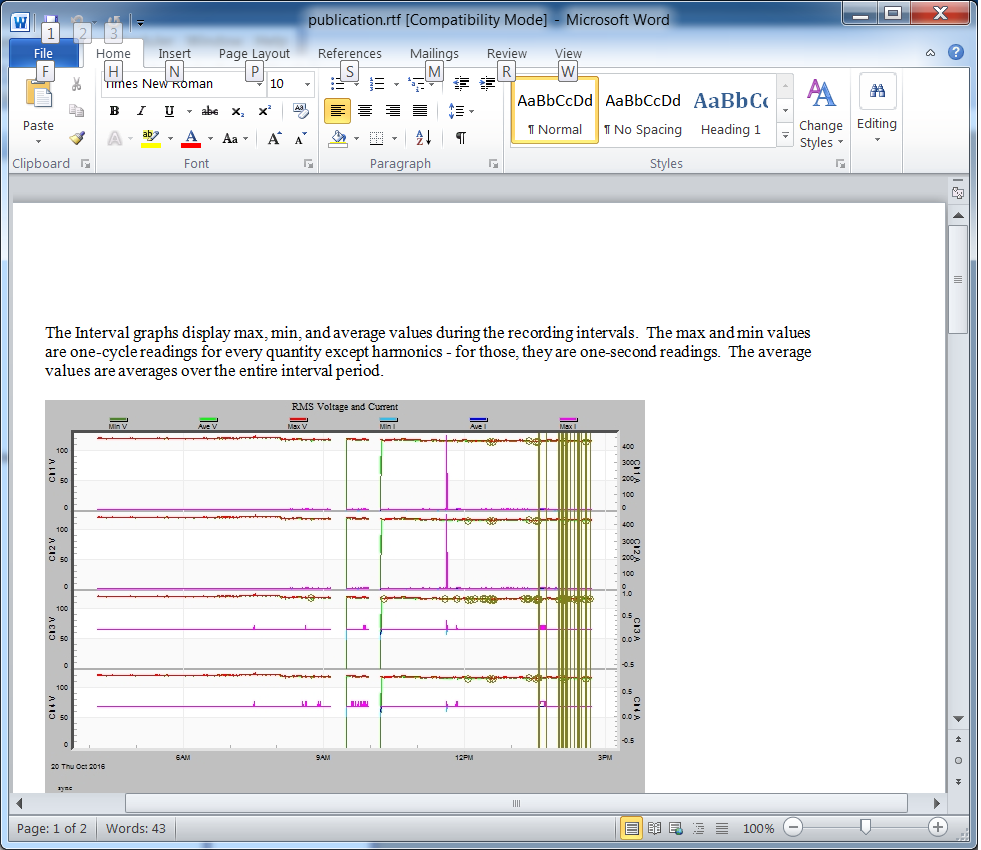
Creating a publication is as simple as checking one or more recordings in the explorer tree and then double-clicking the publication template. A publication can also be launched by right-clicking the publication and choosing “Publish”. When ProVision completes the publication, the user will be prompted for a filename to save the file. After the file is saved, Microsoft Word will be launched to allow the user to view the publication (See Figure 7).
ProVision does not impose a limit on the number of graphs, reports, and recordings that can be selected for a publication. The only limit is the amount of data that can be handled by Microsoft Word. This limit can be exceeded with large selections of reports and graphs when using large or many recordings.
The created file can be edited using Microsoft Word at any time to produce documents that can be used to detail events, or for producing documents in a standard form. Publication templates can be edited, renamed or deleted at any time.
Suggestions
Separate templates may be created for different PQ investigation types. Here are some suggestions for common applications:
- Light Flicker: RMS voltage and current stripchart, IFL and Pst stripchart, GE flicker report
- Voltage sags/dropouts: RMS voltage and current stripchart, Waveform Capture list, CBEMA report, Event Capture, Significant Change Report
- DER/DG/net metering: Total Power stripchart, Power Consumption Report, Energy Usage Report, Voltage THD stripchart, Frequency stripchart
- Harmonics: Voltage, current THD stripcharts, specific harmonic stripcharts
- Load profiling: Total power stripchart, total power daily profiles, Power Consumption Report, RMS voltage and current stripchart, power factor stripchart
Publication templates provide consistent reporting across a PQ group, and over time. Any additional information needed in a specific report output, for example, annotated graphs, may be exported separately and pasted into the Word document output.
Conclusion
The ProVision Publisher allows for custom publications to be produced from ProVision recordings. These publications can contain many reports and graphs, including custom graphs. This can be used for standard reporting and for sharing recorded data to those not running ProVision or that do not have access to the reports.