
Abstract
This white paper describes how to use the custom graph wizard in ProVision to create custom Harmonic Analysis templates. Most PMI recorders offer the ability to record high frequency content up to the 52nd order Harmonic. In order to graph Harmonic Magnitudes and Phase individually or in combination the custom Graph feature in ProVision must be used.
Custom Graphs Wizard
The Custom Graph Wizard is available in all versions of ProVision (V1.32 and V1.51). This tool can be used to create customized graphs specific to the power quality analysis requirements of the end user. The wizard is dependent on the capabilities of the recorder being used and the stripcharts that are enabled during its initialization. This paper will focus on utilizing harmonic stripchart data when using the Custom Graph Wizard. To start the custom Graph wizard Click Tools > Custom Graph Wizard as shown in Figure 1.
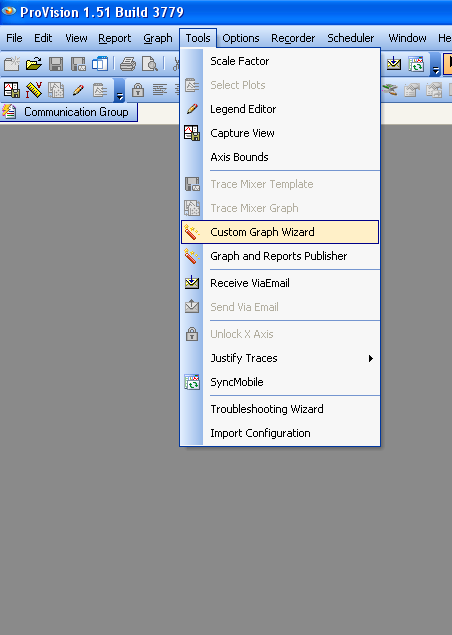
Creating a Custom Harmonic Graph
Add or Remove Plots
The select plot window of the Wizard is the basis for custom analysis. Select the number of data plots to be presented on the final graph in this window, as shown in Figure 2, below. This function is dependant on the capabilities of the recorder and the initialization parameters.
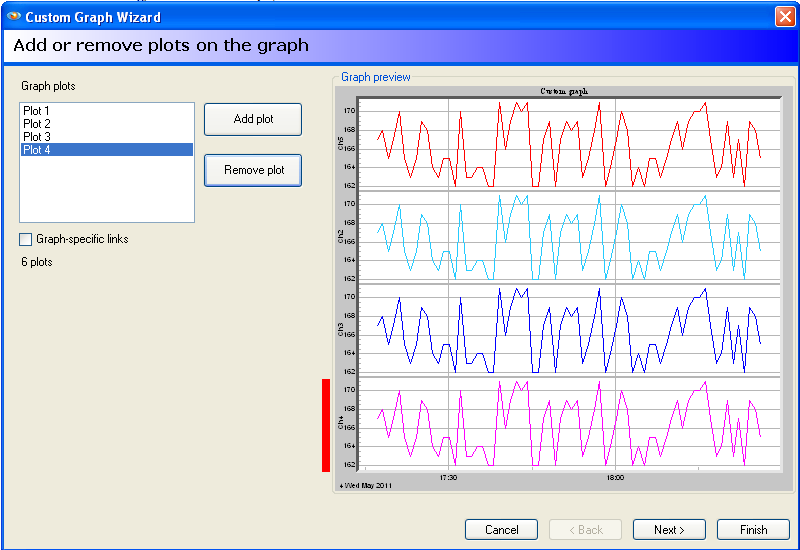
To select/remove multiple data plots click the add/remove plot buttons as shown. The example provided in this paper uses 4 plots total. When Finished Click Next.
Add Axis
The Add Axis window is the most critical step in creating a custom graph. This window is used to select the data presented on each plot of the graph. The example provided in this paper utilize the Harmonic Interval data. The Add Axis window is a multistep process:
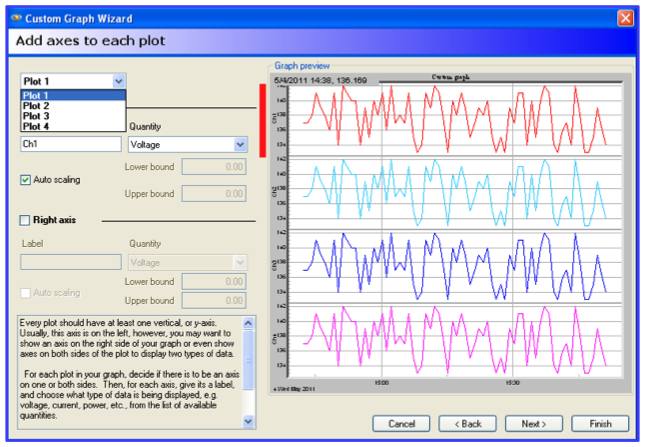
- Select the plot to be modified as shown in Figure 3.
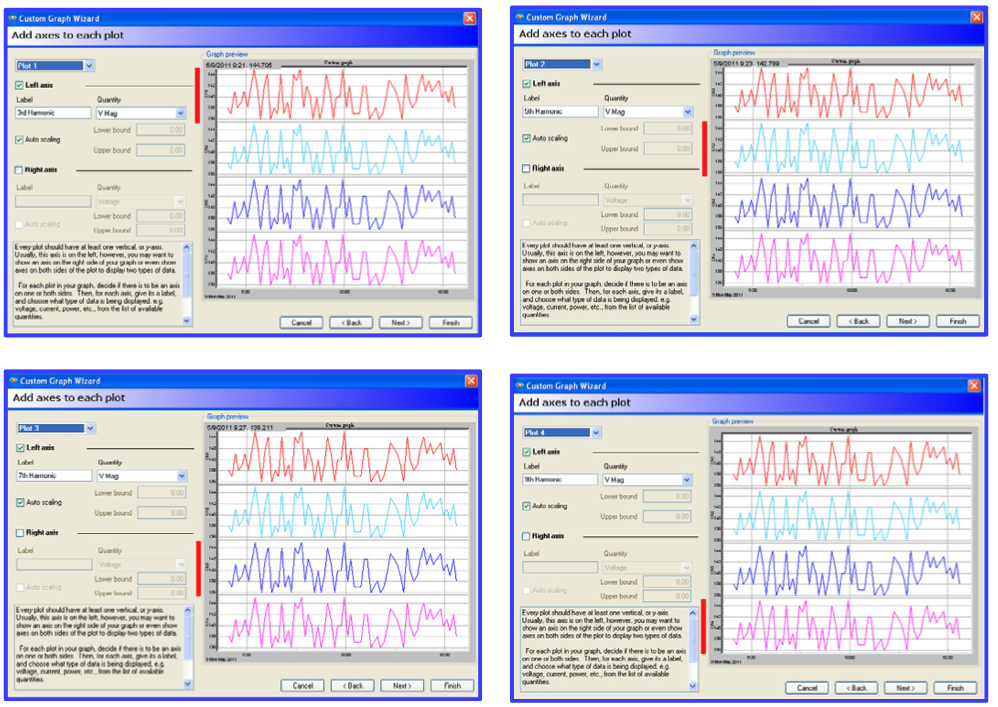
- Select the Left Axis Label and Quantity of Harmonic Data (V/I & Phase/Magnitude) to be plotted as shown in Figure 4, below. This field can be changed to indicate which Harmonic is being graphed (This is not limited and can be changed to any value required). In this example, the ODD Harmonic Voltage Magnitudes 3,5,7,9 have been plotted.
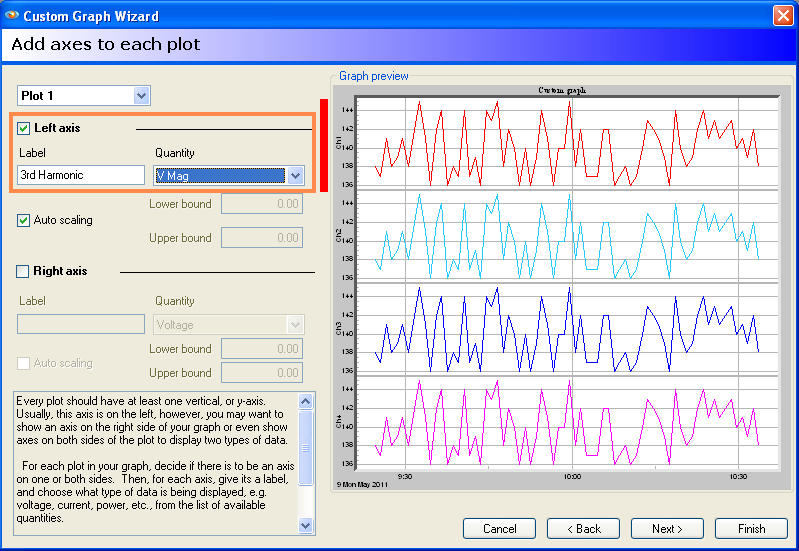
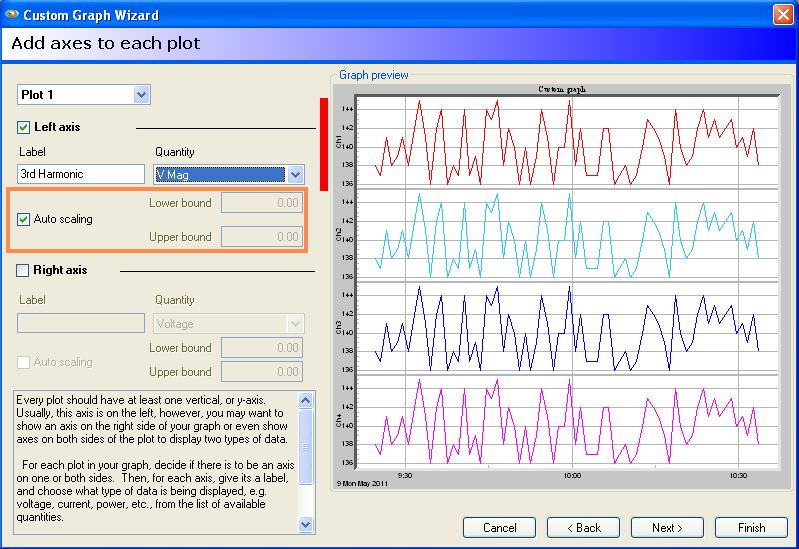
- Scaling is used to limit the data range in the X Direction for the Upper and Lower Bounds. The default is Auto Scaling and is recommended for most applications as shown in Figure 5, below.
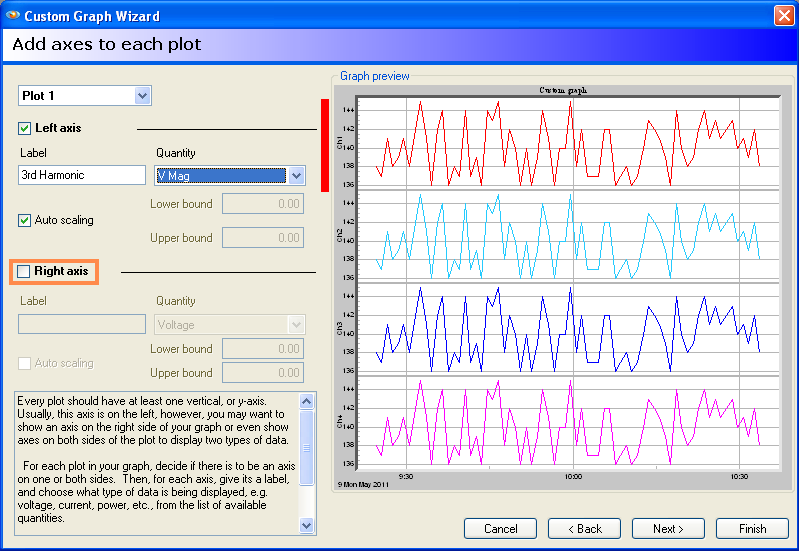
- Right Axis label and Quantity are used to overlay another data range on top of the same plot. This is a neat feature when multiple data are required on the same plot. In this example, only the left axis fields are used. NOTE: The Right Axis is not selected for this graph, as shown in Figure 6, below.
- Repeat Steps 1-4 until all Plot fields have been populated as shown in Figure 7, below.
Select Traces for Each Plot
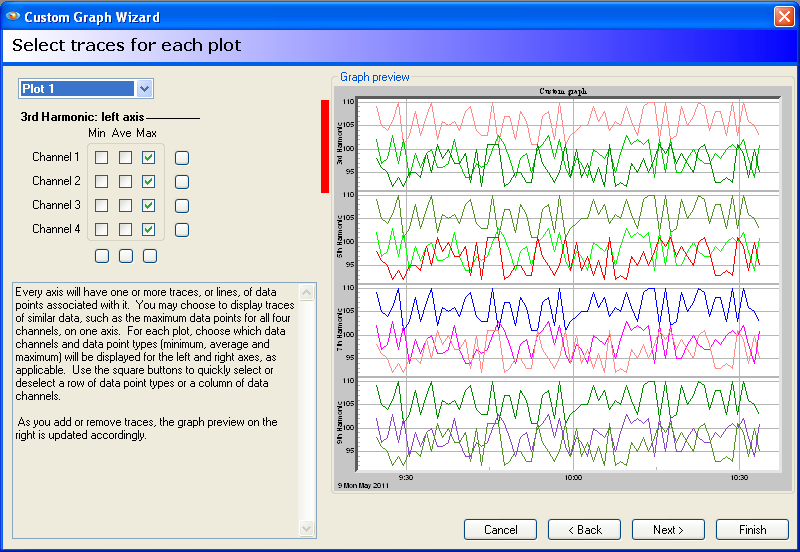
The select traces window is used to select the Interval data points (Max, Min, Ave) and Channels (Dependant on Recorder type) to be graphed for each plot. It is possible to select all Interval data/Channels or individual Interval data/Channel for each plot. In this example, MAX Interval Harmonic data on ALL 4 Channels have been plotted as shown in Figure 8, below.
Adjust Trace Properties
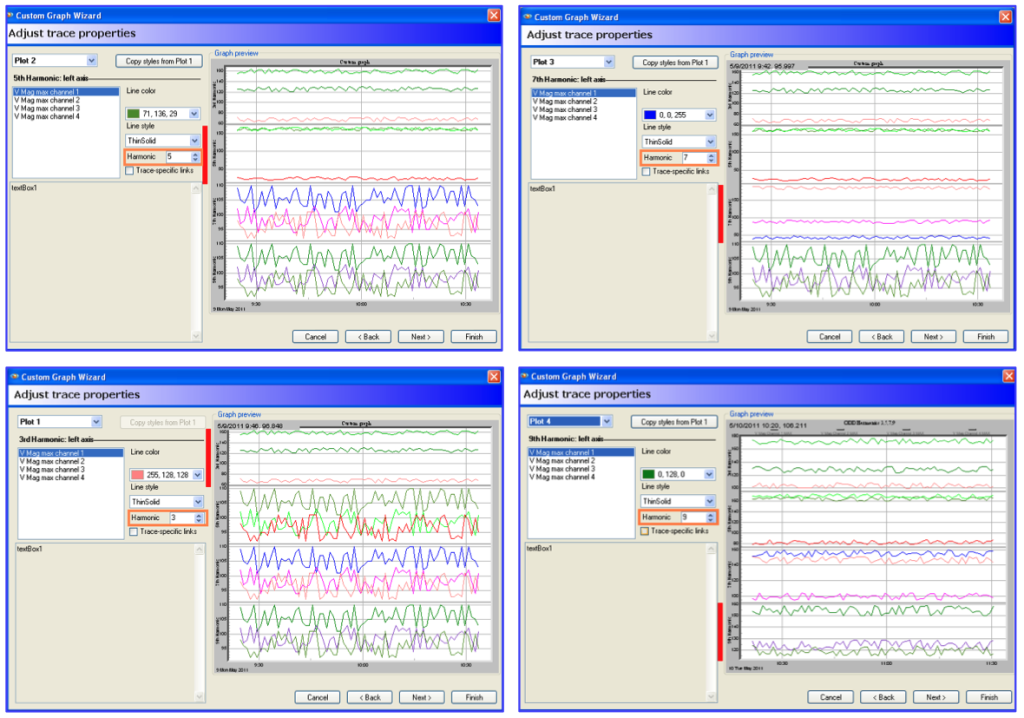
The adjust trace properties window is used to select the color and thickness of each Channel trace. This window is also used to select the Interval Harmonic number for each plot. As mentioned previously ODD Harmonics 3,5,7,9 have been plotted for the examples in this paper as shown in Figure 9.
Add or Remove Legends
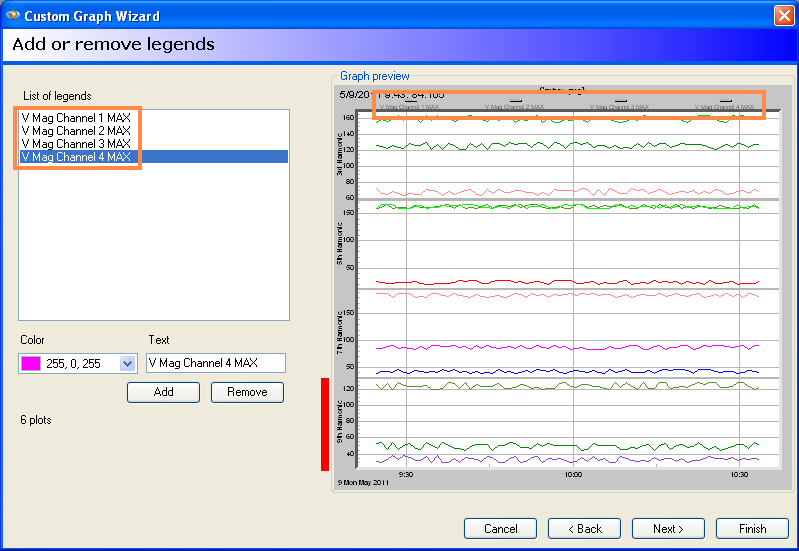
The Add/Remove legends window is used to create colored legends for the custom graph. This feature is used to create a nice professional representation of the data as shown in Figure 10.
Edit Graph and Template Name
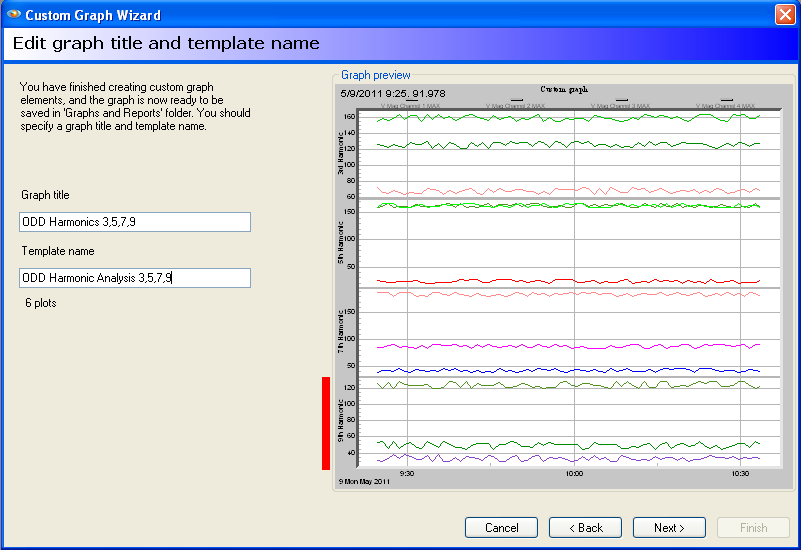
The edit graph and template name is used to label the graph header and Save the custom graph as a template name for later use. In this example, the template will be saved as ODD Harmonic Analysis 3,5,7,9 as shown in Figure 11, below.
NOTE: The template will be saved and can be used when you have a recording with the proper setting enabled during initialization.
Custom Graph Created Successfully
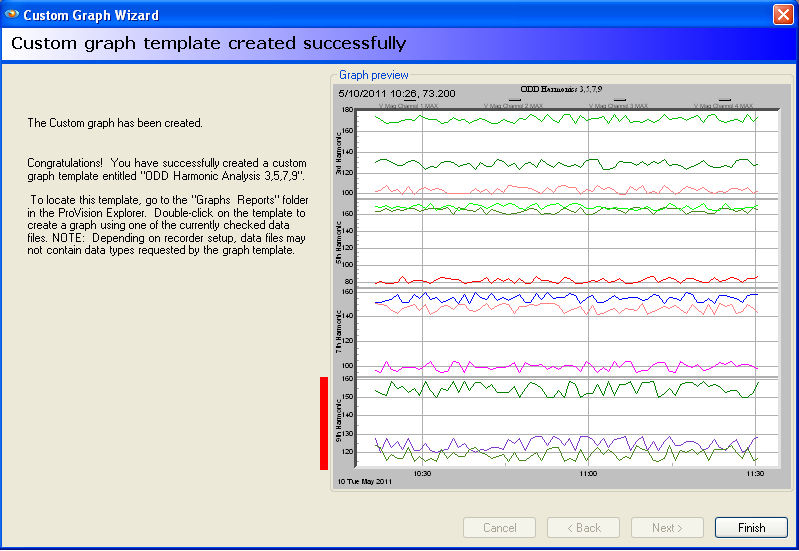
This window provides notification that the custom graph will be created and the template name that it will be saved with (Figure 12). Click Finish to Exit the wizard.
Using the Custom Graph
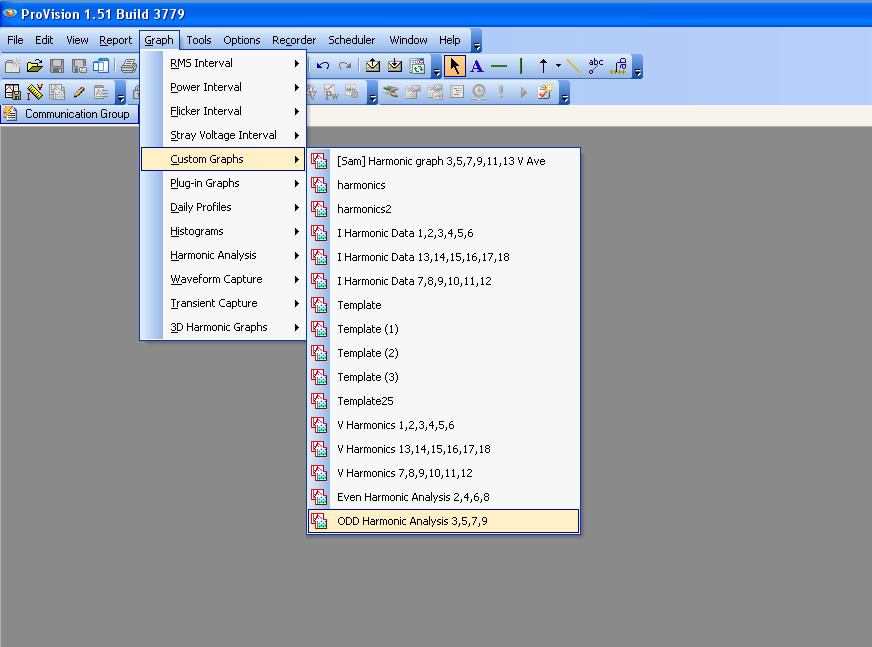
The custom graph will be saved in the Explorer Tree under the Graphs and Reports file. It is also possible to access the custom graph under Graph > Custom Graphs as shown in Figure 13. In order to use the custom graph for a recorded data file, the initialization has to be set to record the Harmonic Magnitudes used in the custom graph (In this case, V Harmonic Magnitude 3,5,7,9). To use the custom graph simply open the data file of choice and then choose the custom graph as described above.
Conclusion
The custom graph wizard is a very powerful tool and is an excellent feature of ProVision. Taking the time to create a custom graph for Harmonic analysis is very beneficial and will save you time and effort in the future. With a little knowledge and understanding in using the custom graph wizard, you will be able to better understand your Harmonic data.