• Skip to primary navigation
  • Skip to main content

PMI

  • Home
  • Products
  • Library
    • Videos
      • All
      • Bolt Quality Tests
      • Promotional Videos
      • Support Videos
      • Power Quality Decoded
    • White Papers
      • All
      • Artificial Intelligence
      • Case Studies
      • Communications
        • All Communications
        • Cellular Communications
        • General Communications
      • Distributed Generation
      • IEEE Standards
      • Power Quality
        • All Power Quality
        • Analyzing Waveforms
        • Flicker
        • PQ Data Analysis
        • PQ Theory
      • Products
        • All Products
        • Boomerang
        • Boomerang SCADA
        • Box Recorder
        • Canvass
        • Eagle
        • Flex CT
        • Guardian
        • Merlin™
        • Meter Sockets
        • PQ Canvass
        • ProVision
        • Revolution
        • TLAR
        • Using PMI Recorders
      • Voltage
        • All Voltage
        • CVR
        • Voltage Sag
        • Voltage Unbalance
      • Harmonics
  • Training
    • All
    • PDH Eligible Classes
    • On-Site Training
    • Live Webinars
  • Support
  • Our Company
    • About
    • Contact
    • Join Our Team!
    • Receive our Newsletter
    • PQ Resources
    • Power Quality Solutions
  • Account
  • Cart - 0 items

ProVision Shortcuts

By The Engineers · January 1, 2011

← Back to White Papers

Many of you have been using our ProVision® software for a while now and may have found a few of the shortcuts in the software. Below you will find a complete list of shortcuts for ProVision®. I hope that you find this useful and that it makes your job easier.

General Shortcuts for Almost Any Kind of Graph

  • Page Up: Adjust Interval Size (Changes interval to a larger interval)*
  • Page Down: Adjust Interval Size (back to a lower interval)*

*Higher or lower interval must be divisible by the original interval when adjusting the interval size, interval is converted to seconds (i.e. 2 minute interval = 120 seconds)

  • Q Brings up the same menu as right-clicking
  • E Export dialog (Used to copy graphs or save them as images)
  • P Print graph
  • S Toggle between color and Black and white
  • D Export text dialog
  • K Increase line thickness
  • J Decrease line thickness
  • X Export dialog (Shortcut key is identical to ‘E’)
  • B Set the upper and lower bounds
  • M Maximize graph
  • T Toggle the Point Table ON or OFF; with the Point Table ON you can:
    • ← OR → advances the ‘Point’ to the previous or next interval. Page Up OR Page Down keys advance 20 intervals at a time backward or forward

Zooming

Use the mouse to zoom in on any graph by left clicking and holding, then dragging over the graph in either direction to make a window. Once you release the left button the graph will zoom into the window you made. With a Zoom window ON, in a graph, you can:

  • ← OR → Moves the zoomed window Left or Right, through the interval data.
  • U Undo one zoom level
  • Z Undo all zoom levels

Control Shortcuts

There are also Ctrl shortcuts, most of which are Windows standards:

  • Ctrl+O: Open file
  • Ctrl+Z: Undo
  • Ctrl+X: Cut
  • Ctrl+Y: Redo
  • Ctrl+S: Save file
  • F1: Help
  • Ctrl+V: Paste
  • Ctrl+Shift+U: Full screen
  • Ctrl+P: Print
  • Ctrl+Shift+F: Find in files
  • Ctrl+C: Copy
  • Ctrl+Shift+B: Display or hide the shortcut bar

Shortcuts for the Waveform Capture Only

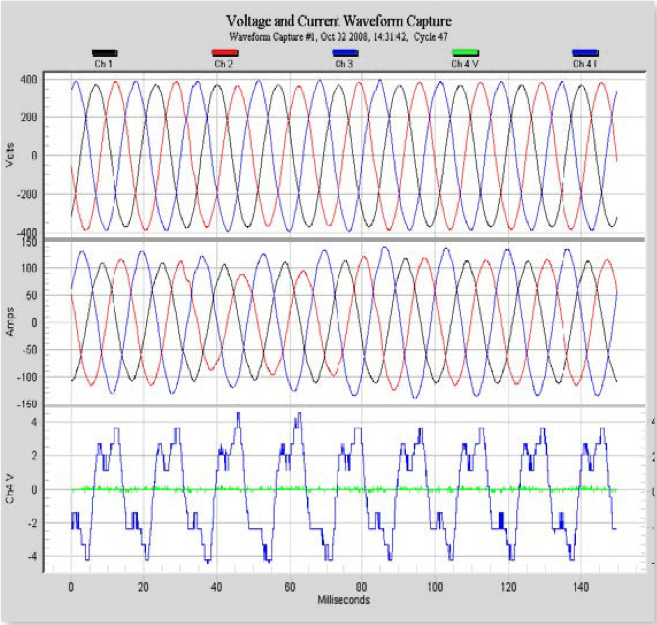
  • 3 Toggle between 3-phase and individual phase views
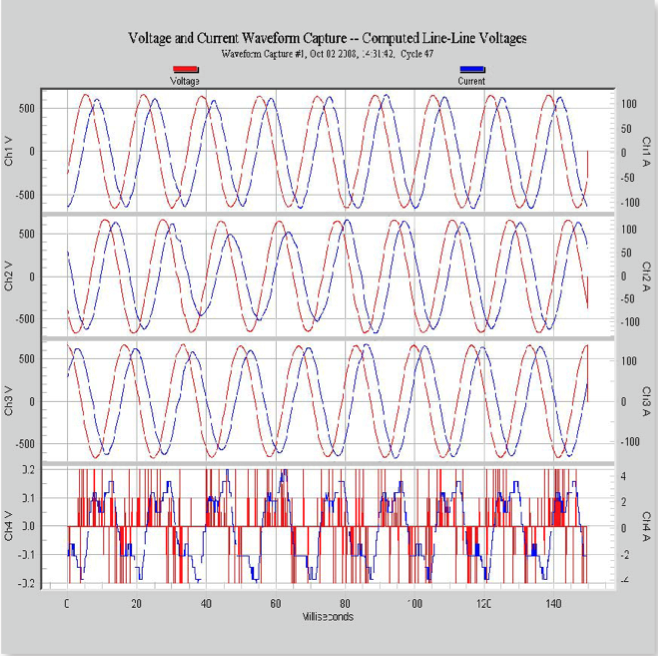
  • I Toggle between Line-to-neutral voltages and Line-to-line voltages (Only if recorded as a WYE)
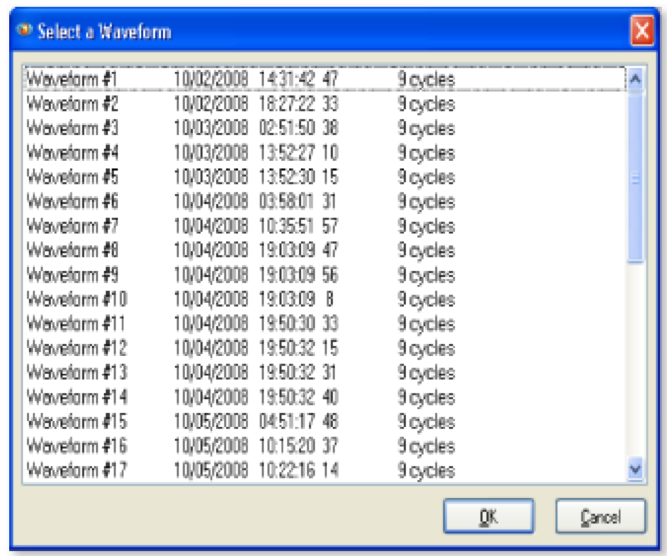
  • L Select a different waveform
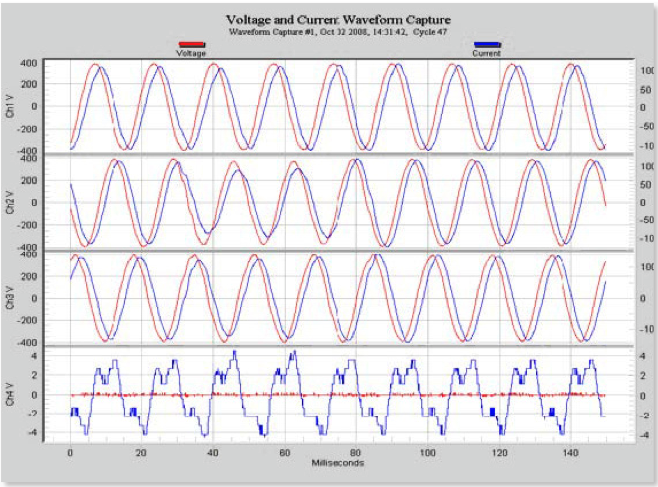
Example 1: Standard picture of a Waveform Capture.
Example 1A: Using the 3 to toggle between 3-phase and individual phase views.
Example 1B: Using the L to select a different waveform.
Example 1C: Using the L to select a different waveform.
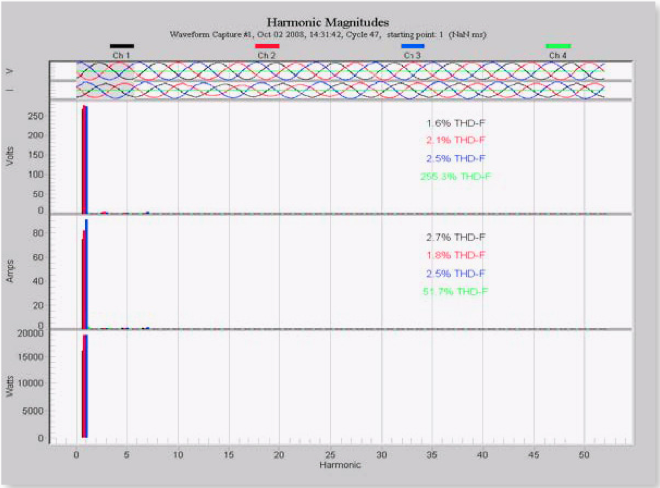
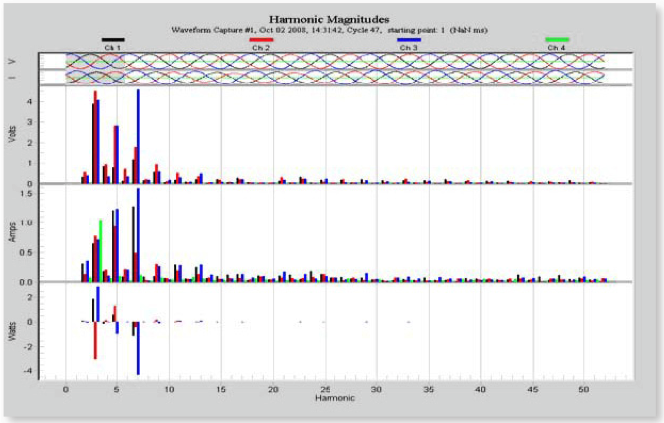
Example 2: Before you toggle fundamental magnitude off.
Example 2A: After you toggle fundamental magnitude off.

Shortcuts for the Interval Graph Only

  • 1 Toggle 1V marker for stray voltage graphs
  • 5 Toggle 0.5V marker for stray voltage graphs
  • >, < Increase or decrease right-axis scale, used to shrink or enlarge current traces on Voltage and Current RMS Interval graph
  • R Launch interval report for selected zoom area (ProVision 1.51 only)

Shortcuts for the Harmonic Magnitudes Graph Only

  • F Toggle fundamental magnitude on and off

Have a PQ question? Ask Merlin™ — free.

Send it to askmerlin@powermonitors.com or text (540) 383-3144.

Want the PDF version of this white paper?

Have a PQ question? Ask Merlin™ — free. Send it to askmerlin@powermonitors.com or text (540) 383-3144.

Power Monitors, Inc. — Tools you Need. People you Trust.

Power Monitors, Inc. is an industry-leading product design and manufacturing firm based in Mt. Crawford, Virginia. PMI® strives to solve power quality problems by listening to our customers and working with them to design and manufacture products. Total customer satisfaction is the primary goal of all PMI® staff.

24/7 Tech Support 800.296.4120

Resources

  • White Papers
  • Videos
  • Training
  • Live Webinars
  • PQ Resources
  • Support

Company

  • About Us
  • Contact
  • Careers
  • Newsletter
  • Product Registration
  • Terms & Conditions
800 N Main St, Mt Crawford, VA 22841 | Toll Free 800.296.4120 | Fax 540.432.9430
© 2026 Power Monitors, Inc.