Abstract
Voltage sags are short-duration power quality nuisances that can wreak havoc on sensitive electrical equipment. Identifying and classifying sags (as well as identifying their sources) can be a tedious and perhaps daunting task for a Power Quality Engineer. This white paper provides an overview of voltage sags, their definition according to the IEEE 1668 standard and some methods for capturing and measuring voltage sags with power quality
recorders.
The IEEE 1668 standard
The IEEE provides a fairly light-weight standard that draws heavily from existing standards bodies (such as ANSI, EPRI, IEC and even from within the IEEE itself). The 1668 standard provides a more detailed overview than can be found in this white paper and it is recommended that the reader obtain a copy and review it as a supplement to the material found in this document.
IEEE 1668 starts with an in-depth overview of sags, their causes, the history of the issues involved in quantifying and qualifying their measurements, in addition to other beneficial “primer” information on sags. As of the publication of this paper, the most recent version of the specification is the 2017 version (IEEE 1668-2017) and can be obtained directly from the IEEE website
What Are Sags?
Voltage sags are defined as a brief (less than one minute) reduction in supplied voltage wherein the RMS voltage falls to <= 90% of the system’s steady state RMS voltage. This can perhaps be better described with a few figures.
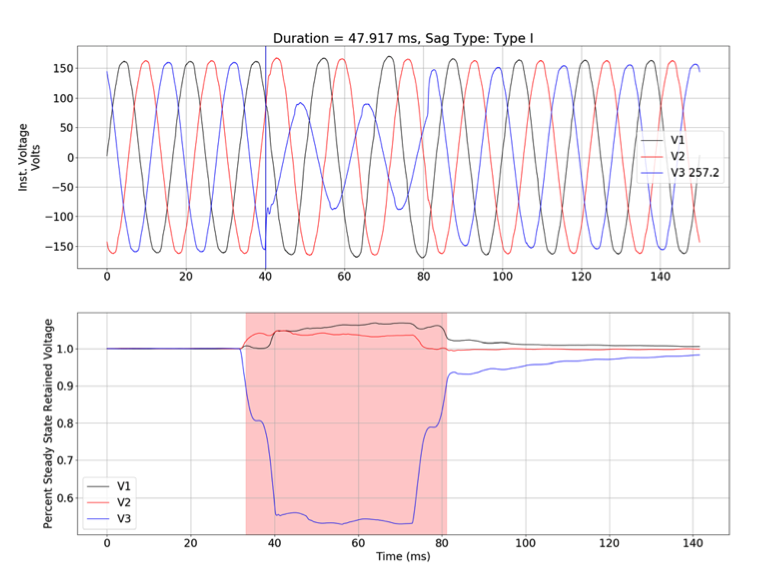
There’s a lot happening in Figure 1, so let’s break this down element-by-element. The title of the graph provides some information about the sag: the duration in milliseconds (ms) and the sag type. (See below in “Sag Classifications” for more information on sag types and how they’re classified.) The top plot in the graph in Figure 1 shows the instantaneous three-phase voltage as recorded by a PMI PQ recorder. The vertical blue bar at about 40ms into the capture shows the point of inception of the voltage sag (more on that later) and the legend on the right provides the exact angle of exception for the sag on phase 3 (257.2 degrees).
The second trace also is showing a lot of useful information. The y-axis is the percent of retained steady state voltage (expressed from 0.00-1.00). The pink shaded region shows the trace during which the sag is occurring — beginning where retained voltage is <= 90.0% and ending when retained voltage is > 90.0%. The percentages are expressed as percents of the steady state RMS voltage and are computed from instantaneous values in the first trace.
At first glance a few things are obvious: looking at the instantaneous voltages can be a fair indicator of voltage sags, but the RMS trace is clearly far more obvious. All of PMI’s power quality analysis software (PQ Canvass and ProVision) allow users to view waveform captures in both instantaneous and RMS modes.
Sag Classifications
Voltage sags are classified into three straight-forward types: Type I, Type II and Type III. A type I sag is a sag in which the voltage is reduced on only one of all phases. Type II sags are sags in which two phases see a reduction in RMS voltage matching the definition above and, as expected, a type III sag occurs when a sag occurs on three phases of a polyphase system.
Additionally, as mentioned previously, the other qualifying criteria of voltage sags are that the percent of retained RMS voltage must be <= 90% of steady state voltage and the duration should be less than 1 second.
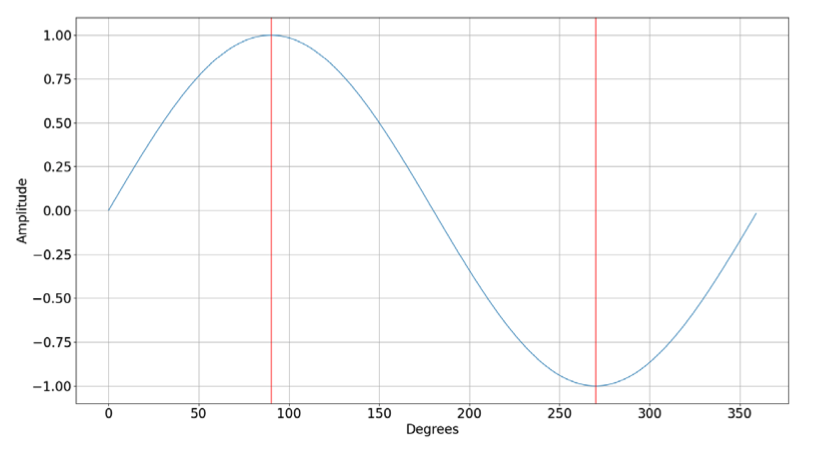
An additional important metric when analyzing voltage sags is the angle of inception. This is the point on the waveform where the sag begins. Figure 2 shows a sine wave with unity amplitude. The x-axis is degrees, running from 0 to 360. The two vertical red bars are at the 90 and 270 degree marks, respectively. These are the peaks of the waveform and were a sag to occur at either of these points it would have the greatest affect on the RMS voltage for that waveform.
Who Suffers Most From Voltage Sag?
Industrial customers are disproportionately affected by voltage sags. This is largely due to the fact that sags can cause equipment malfunctions (including severe damage), leading to prolonged down time. Often times, the duration of these down times can span several shifts to even several days, resulting in significant financial loss for the customer.
Identifying precursors to sags (events that would be sags, but that don’t necessarily meet the full definition according to the IEEE specification, such as a reduction in voltage wherein the retained steady state is still > 90%) can be an effective way to mitigate this downtime. If the source can be detected before the sags become deep enough to be classified as such, equipment failure and malfunction are far less likely to occur.
Configuring a Recorder to Capture Voltage Sags
The Seeker, Tensor, Guardian and Revolution PQ recorders all can be easily configured to capture voltage sags. If using PQ Canvass, a settings template specifically designed to facilitate the capture and analysis of Voltage Sags is provided. Simply select the “Voltage Sag” Preset Recording Template when initializing a new recording (as shown in Figure 3).
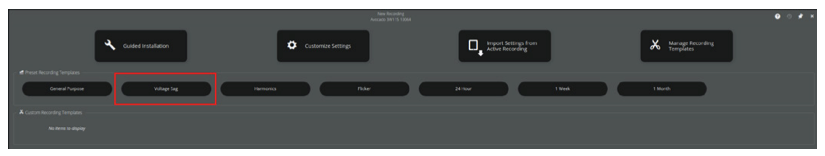
Figure 4 shows the parameter quick editor, which allows the user to adjust some of the most commonly adjusted recording parameters. Again, these have already been fine tuned to the most efficient parameters for capturing voltage sag events.
It is worth noting a couple of the parameters from the preset template. First is the recording interval set to one cycle. As defined above, voltage sags have a duration of less than 1 second, so to provide a more accurate means of measuring the duration of a sag, the single cycle interval was selected. The single cycle interval provides the RMS voltage and current for each phase that is configured for the duration of the recording.
The second item to note is the Waveform Capture voltage threshold. The Voltage Sag Preset Template defaults to three percent. This three percent threshold is not an absolute amount computed from a reference value, such as a detected nominal voltage or current. Instead, this three percent value means that the recorder will trigger a waveform capture when the RMS voltage fluctuates by three percent RMS cycle to cycle.
While the IEEE 1668 standard defines the beginning of a sag as occurring when the percent of retained steady state voltage is 90% or lower, the Voltage Sag Preset uses a three percent cycle-to-cycle threshold in order to ensure that the onset of the sag is captured.
Analyzing a Wavform Capture in PQ Canvass
The Tensor, Seeker and Guardian recorders integrate directly with PMI’s flagship web-based power quality analysis software PQ Canvass. After initializing a new recording with the Voltage Sag Preset Template, the recorder will begin collecting and periodically uploading power quality recording data to PQ Canvass. As this data is streamed, it is immediately available for analysis by an end user.
If a user would like to be alerted by email or text message when a waveform capture is triggered, see our white paper PQ Canvass – Getting Started. If email alerts are enabled, the user is sent an email with the details of the waveform capture in addition to an embedded graph with the instantaneous and RMS values directly in the message itself.
To do any further analysis than just a cursory glance at the email, the user will have to log into PQ Canvass and select the triggered waveform from the recording.
Once selected, the default instantaneous view is displayed. This shows each phase of voltage vs. current, one per plot. That is, the first plot will show Phase A or Channel 1 voltage on the left y-axis and Phase A or Channel 1 current on the right y-axis. The second plot will be Phase B/Channel 2, etc. See Figure 5 for an example.
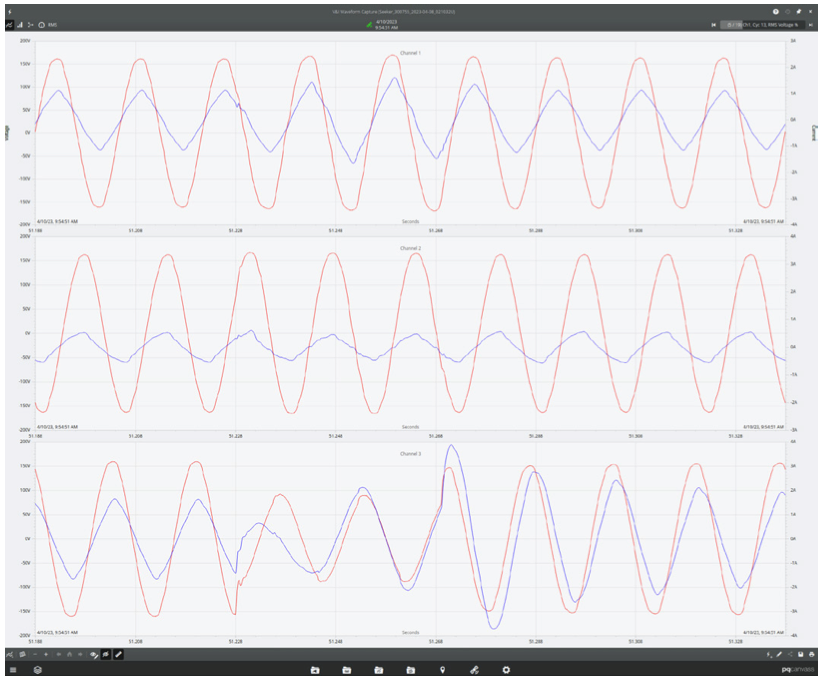
PQ Canvass also provides additional built-in waveform capture analysis tools, such as harmonic components, vector diagrams, meter view (which provides the RMS, crest factor, TIF, THD and some other cycle-by-cycle measurements) and a rolling RMS trace view (highlighted in Figure 6)
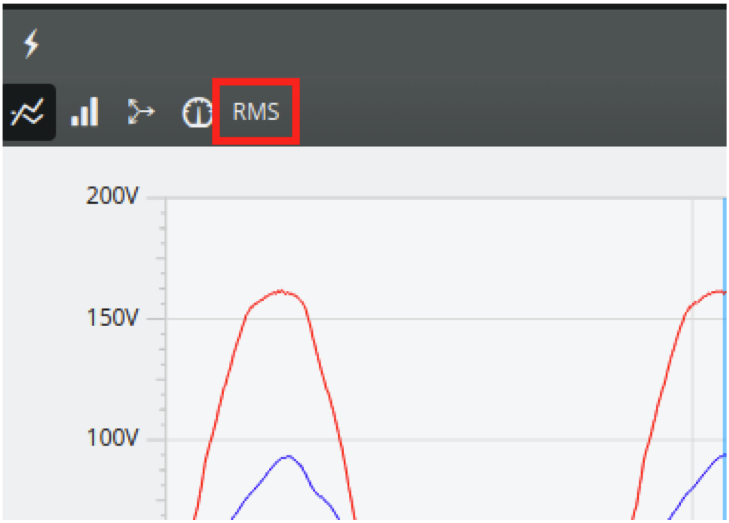
The RMS trace view for a waveform capture now more clearly shows the obvious voltage sag on Channel 3 that, even though visible in instantaneous capture mode, was far more difficult visually quantify.
CONCLUSION
Voltage sags have a history of being highly disruptive, especially to industrial customers. This white paper has provided an overview of what these sags look like and how to record them. Coupled with this knowledge, a copy of the IEEE 1668 standard, a PMI recorder capable of capturing triggered waveforms and PMI’s industry leading PQ Canvass power quality analysis software, the reader is fully equipped to tackle and resolve voltage sags head on.
