
Abstract
Power Monitors has released a new cloud-based software product for power quality analysis, called PQ Canvass. PQ Canvass incorporates the features and convenience of our previous online software, Canvass, many of the power quality analysis and reporting tools of our desktop software, ProVision, and new features to support the newly released Guardian socket recorder.
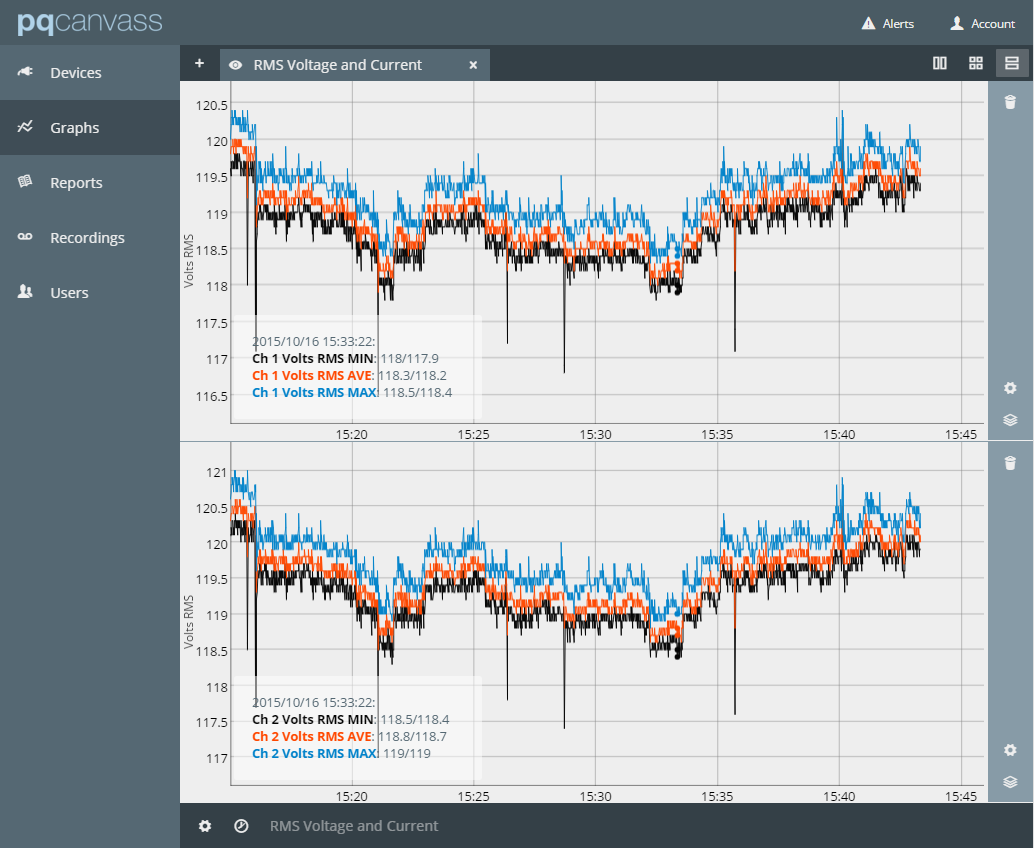
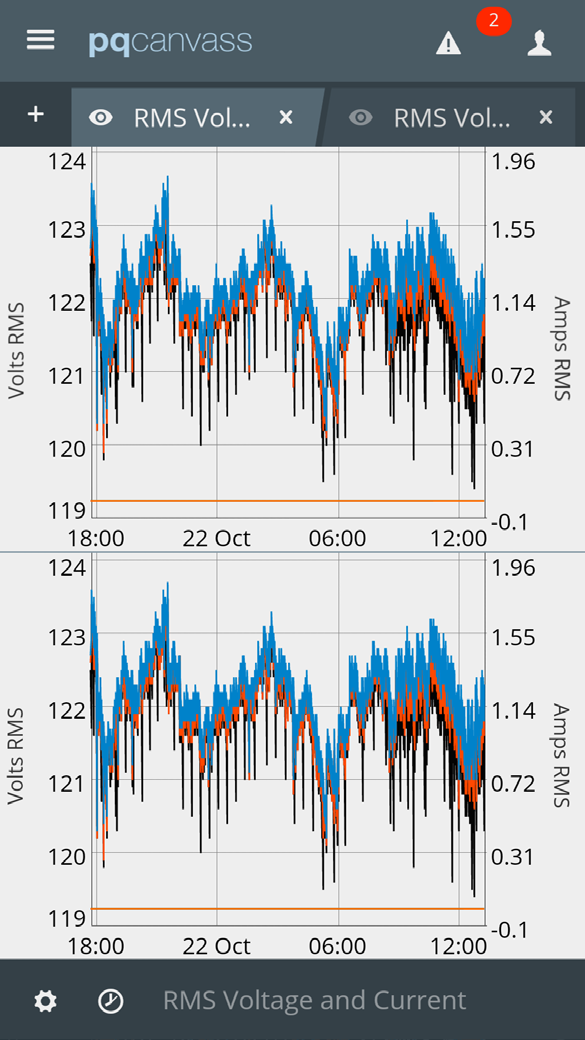
PQ Canvass, unlike Canvass, has been designed from the ground up to support a wide array of devices and screen sizes. This allows you to manage your devices, browse recordings, and even view live waveforms easily, whether at your computer at the office, with your smart phone or tablet (as shown in Figures 1 & 2). PQ Canvass is a cloud-based application that runs completely in a standard web browser – no extra software is required.
Recorders, such as the new Guardian, that support PQ Canvass stream recorded data as it’s gathered during the recording session – no need to wait until the “end” of the recording session and download the entire recorder memory. Simply log into PQ Canvass and view all data gathered up to the present time. Live waveforms and meter displays are also available for real-time information from any PQ Canvass device. SMS and email alerts are also available for immediate notification on PQ events.
Signing In
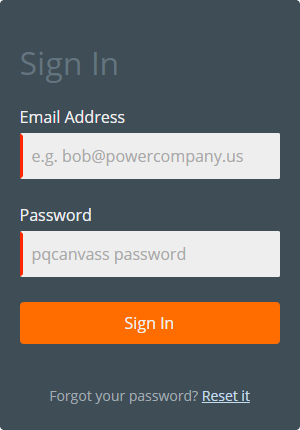
Once a Guardian socket recorder has been purchased, you will be sent a temporary password for PQ Canvass. You’ll then go to pqcanvass.powermonitors.com where you’ll be presented with the sign-in form (Figure 3). Enter your email address and your temporary password. If successful, you will then be taken to the Devices view. If you have just signed in with a temporary password, you’ll need to change your password for security reasons. See the section “Changing Your Password” at the end of this paper.
Main Menu
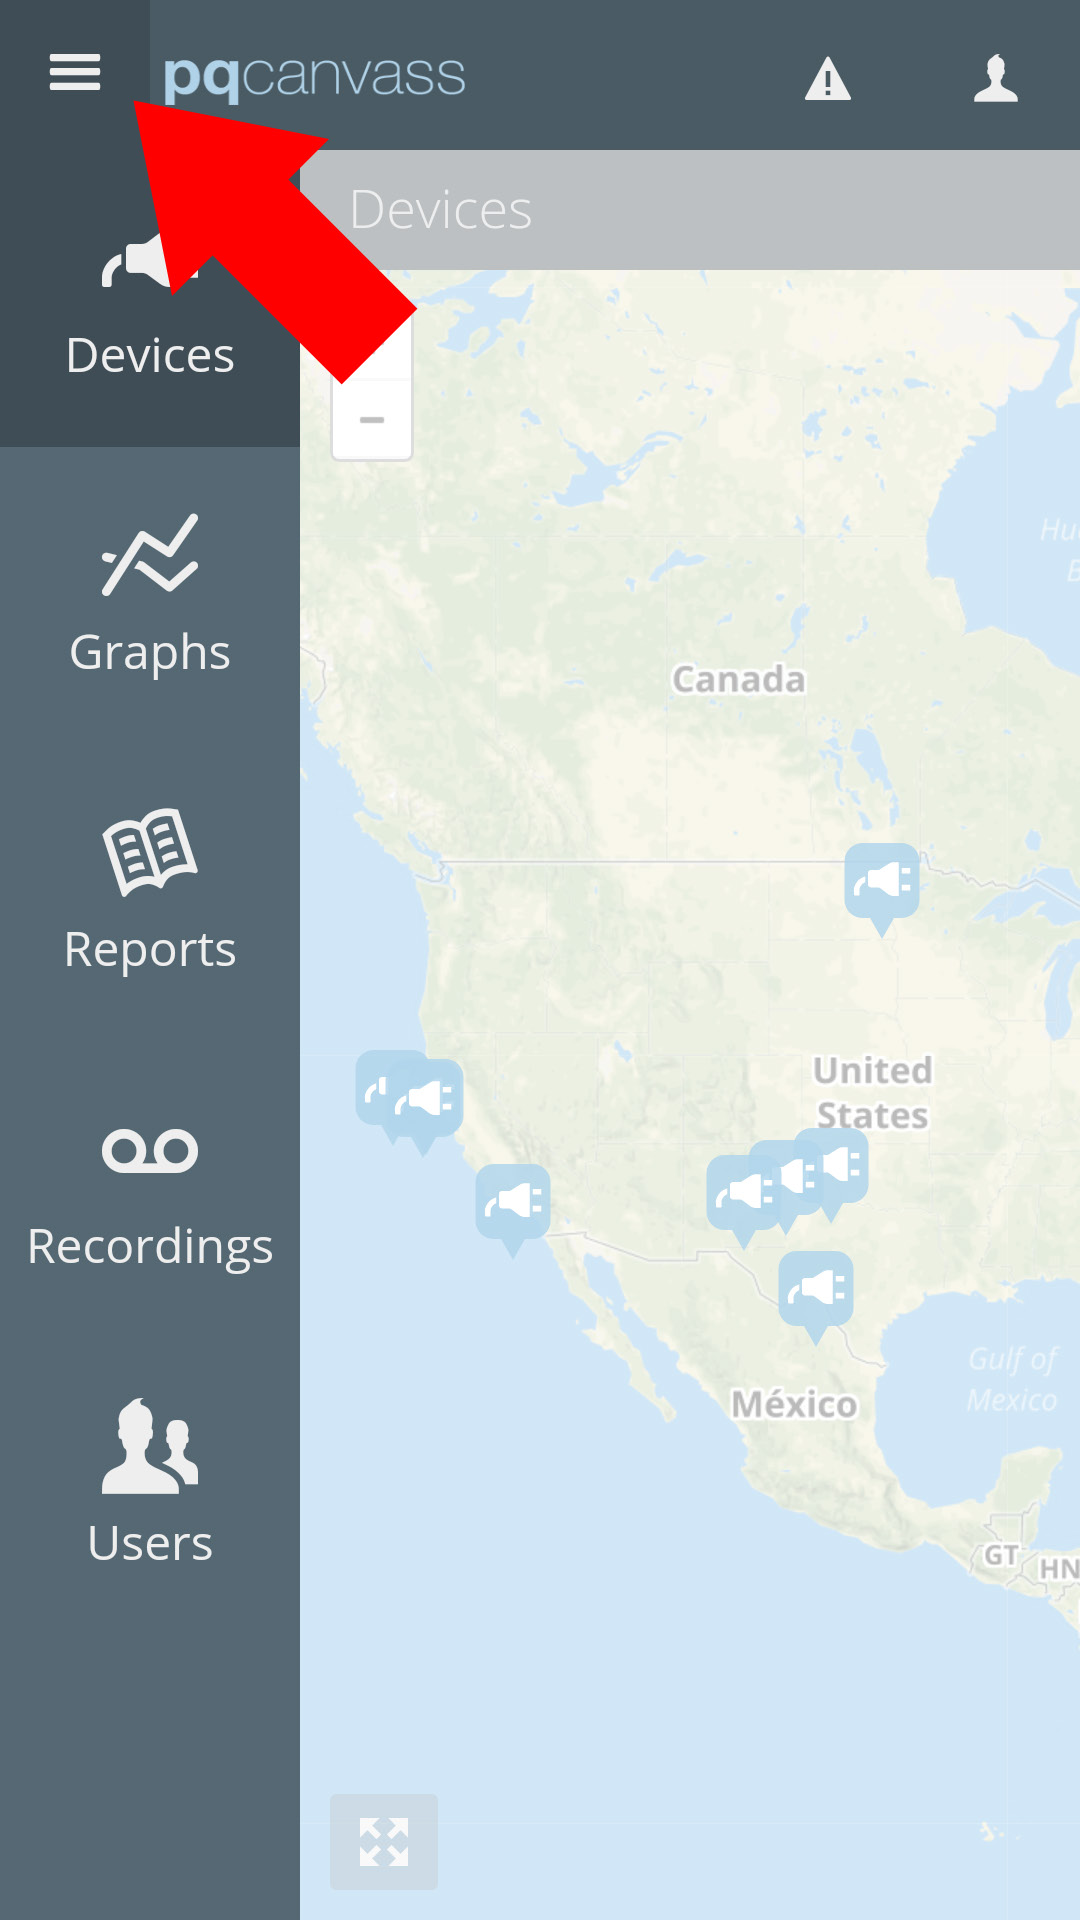
The main menu of PQ Canvass is located along the left edge of the screen. On devices with smaller screens, such as your smart phone, the menu will be hidden from view, but may be toggled on and off using the “hamburger” menu at the top-left of the screen, to the left of the PQ Canvass logo (as shown in Figure 4).
Devices
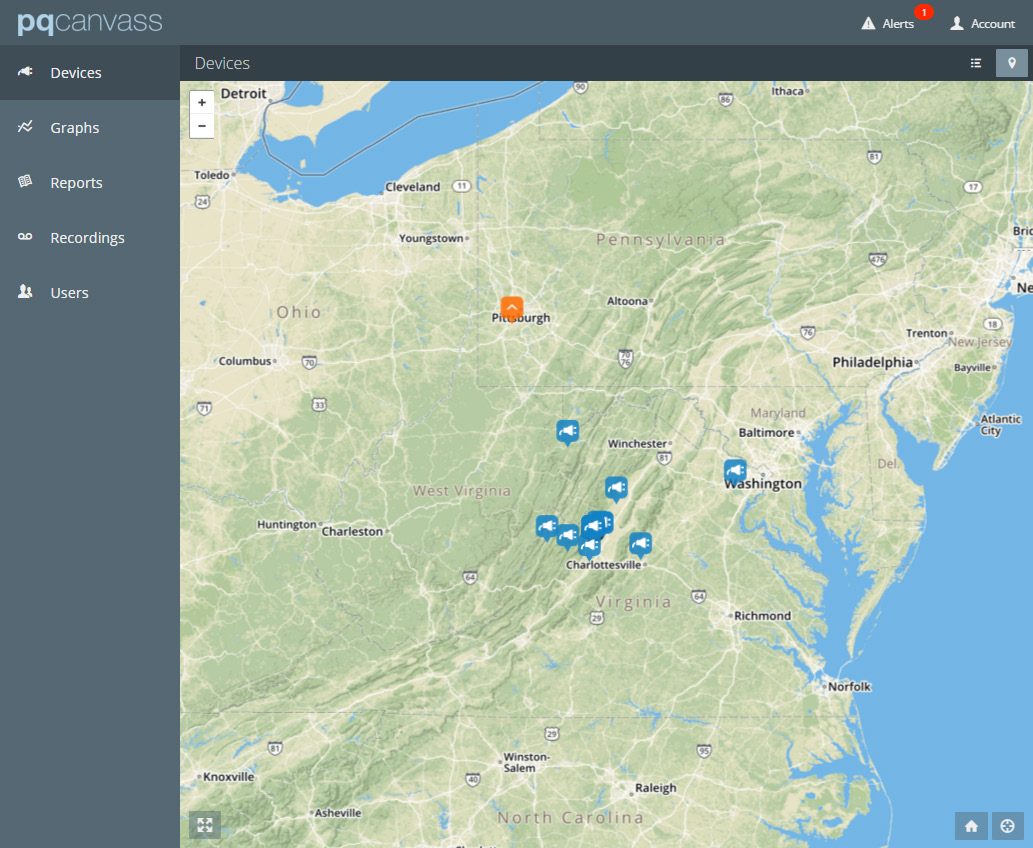
The Devices view may be accessed by tapping “Devices” in the main menu. On devices with larger screens, you will see both a list and a map view of all of your devices, as shown in Figure 5. Smaller screens will display only the map view, but can be switched to the list view using the view controls at the top-right. Larger screens will allow you to view the list view, map view, or both at once. When first signing into PQ Canvass, the map will automatically zoom in or out so as to show all of your devices on the map. Newly added devices will appear on the map at the address provided at the time of purchase, or at the address on file for your company.
Graphs
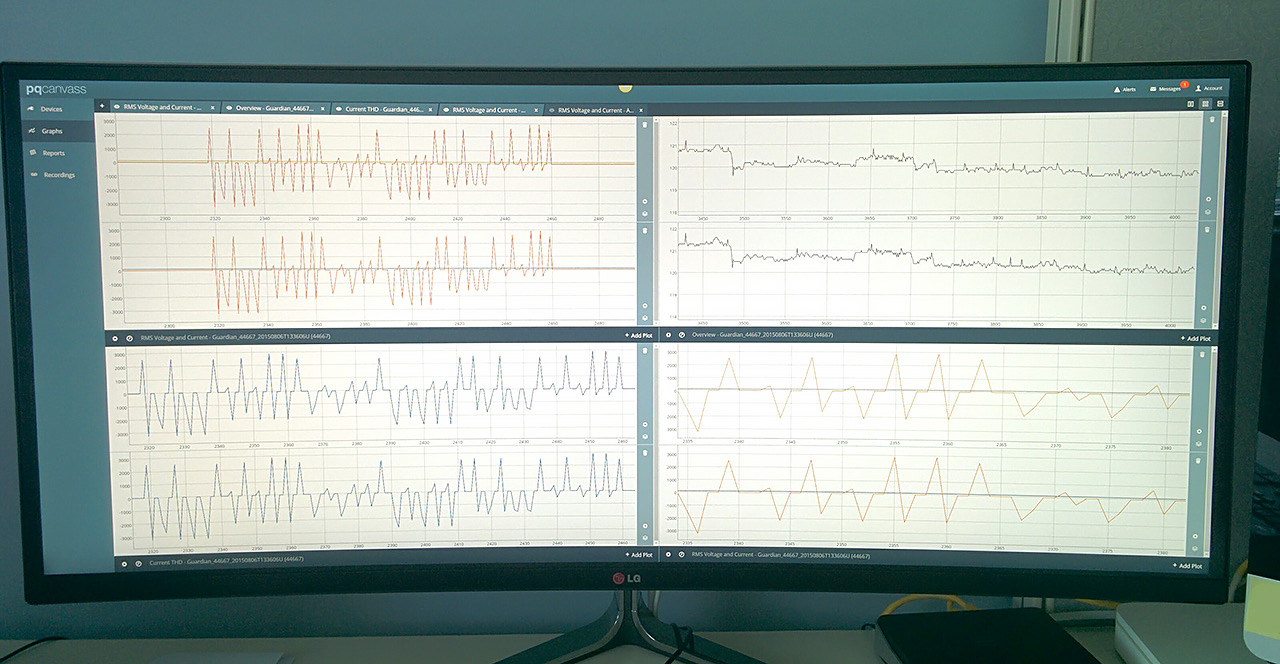
The Graphs view may be accessed by tapping “Graphs” in the main menu. This view allows you to graph live or recorded data, and display up to four separate graphs side-by-side for comparison*. To create a graph, you’ll click the plus (+) button at the top-left of the view, and select your graph source, a recording, or a device. Tapping one of these will present you with a list of recordings or devices, respectively. Selecting a recording or device will present you with a categorized list of graph types. Select a graph type to create a graph. Your new graph will be presented in the graph view with one or more plots, and an associated “tab” at the top of the view. You can have many graphs open at once (Figure 6), but can only view a limited number at once. Tapping a graph’s tab anywhere but the close (X) button will toggle the associated graph’s visibility. This allows you to control which of your open graphs appear on the screen. You can change how multiple visible graphs are displayed using the view controls at the top-right of the Graphs view.
*Note that screen size limits the number of graphs which may be displayed simultaneously, and that smart phones will likely only allow the viewing of one graph at a time.
Graphs – Graphing Live Data
In addition to graphing recorded data, you can view live data from the devices as waveform, harmonic, and vector graphs. To start a live graph, you would tap the plus (+) button at the top-left of the Graphs view, and select “Device.” In the “Select Device” window, select the PQ device from which you wish to receive live data. In the “Select Graph Type” window, select the “Live” category, then select one of the live graphing options. Streaming of data will begin immediately, and continue for one minute. At the end of the stream, you will have the option to replay the last stream, or continue streaming for another minute.
Reports
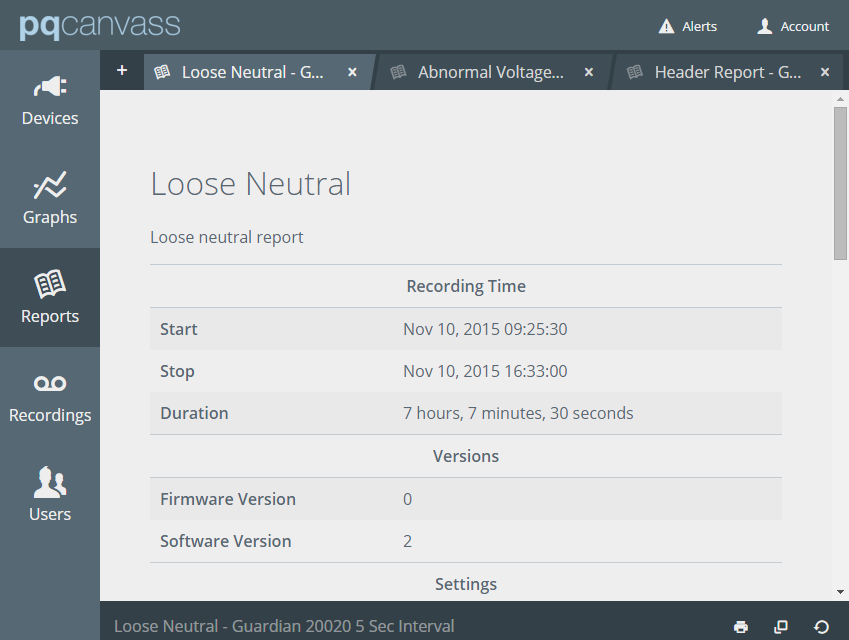
The Reports view may be accessed by tapping “Reports” in the main menu. This view allows you to create ProVision-like reports from uploaded and streamed recordings. Similar to creating a new graph in the Graphs view, to create a new report in the Reports view, click the plus (+) button at the top-left of the view, and select your report source. You will then be required to select your source type (Recording or Device), select the recording or device, and then select the type of report you wish to create. Another similarity between the Graphs and Reports view is the tabbed representation of reports across the top of the view. Unlike Graphs, however, only one report may be viewed at a time: Tapping anywhere on a report’s associated tab will make that report visible, hiding the other open reports, as shown in Figure 7.
Recordings
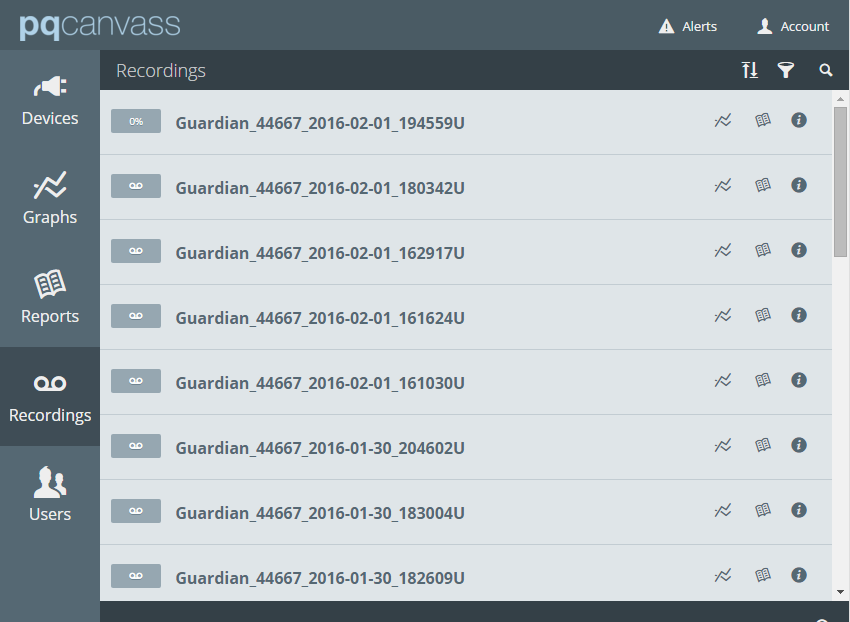
The Recordings view may be accessed by tapping “Recordings” in the main menu. This view allows you to view and manage a list of streamed (and soon, uploaded) power quality recordings for all the devices in your account (Figure 8). Recordings which are currently being streamed to our servers will be displayed with a progress bar, which will indicate how full the device’s internal memory is currently. 100% would indicate that memory is full, and the recording has wrapped around, overwriting older data. The recordings are automatically given a generic name containing the device platform, serial number, and timestamp. You can edit the recording’s name and description by clicking its info (i) button, and then clicking “Edit.”
Users
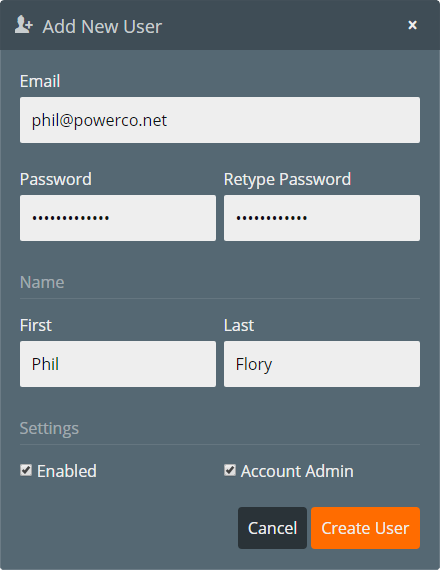
The Users view is an account admin only feature. If you are signed in with an admin user account, you can access the Users view by tapping “Users” in the main menu. If you are not an account admin, “Users” will not appear in the main menu. The Users view allows an admin to manage users within the account. From this view, an admin may add a user (Figure 9), edit a user’s details, change a user’s password, unlock a user’s account, and grant or revoke admin privileges to or from existing users.
Alerts Pane
The alerts pane is toggled by tapping “Alerts” at the top-right of the screen. This pane will display any alerts received while PQ Canvass is active. The number of received alerts, if any, will be indicated as a number with a red background next to the “Alerts” button. Alerts are triggered when a device in a notifications list to which you’ve been added enters an alert state. Alerts such as “Low Voltage” or “Low Low Voltage” or “Temp High” will appear in this pane, if triggered. In addition to this pane, alerts will be emailed to all users within the notifications list.
Account Menu
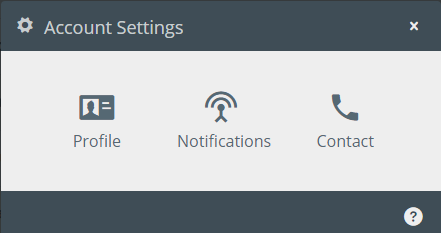
The account menu is toggled by tapping “Account” at the top-right of the screen. The three items presented are Settings, Full Screen, and Sign Out. “Settings” is where you can edit your user profile and user contact information, and, if an account admin, manage notifications lists (Figure 10). “Full Screen” is available on all but iOS devices, and allows you to expand PQ Canvass to fill the device’s entire screen. “Sign Out” ends your current PQ Canvass session.
Change Your Password
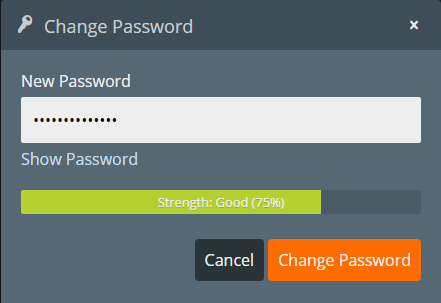
For security reasons, you will want to change your new account’s temporary password to one only you will know. To do this, open the Account menu, and select Profile. Next to “Password”, click the “Change” button. This will open the Change Password window, as shown in Figure 11. Type your new password in the field provided. The password strength indicator will show you how strong of a password you’ve chosen. Your password is obscured by default as you type it, but you can view what you’ve typed by tapping “Show Password”, and subsequently “Hide Password” to obscure it again. Once your password is to your liking, tap the “Change Password” button, and close the “User Profile” window.
Conclusion
PQ Canvass provides a cloud-based system for power quality data analysis, storage, and real-time display to recorders in the field. Browser and tablet friendly interfaces allow for graph and report generation, live readings, email and SMS alerts, and recorded data management. All collected data up to the present is immediately available in a web browser. This eliminates the need to wait for a recording session to finish, or go back in the field to see what’s been collected so far. The combination of always-connected recorders and PQ Canvass makes gathering and analyzing power quality data easier and faster.