
Harmonic Overview
Harmonic distortion has become an increasingly important subject for large power consumers. Non-linear loads continue to be adopted into customer systems, which often are the root cause of power quality issues and present many different types of symptoms. Large loads are now more commonly non-linear, with the prevalence of low-cost variable frequency drives and other switching power supplies.
Harmonics are the integer multiple of the fundamental frequency (shown in Equation 1 and demonstrated in Table 1). A distorted voltage or current waveform may be analyzed in many ways, but using harmonics brings several advantages.
Equation 1:

Table 1:
| Harmonic | Frequency |
|---|---|
| 1st | 60Hz |
| 2nd | 120Hz |
| 3rd | 180Hz |
| 4th | 240Hz |
| 5th | 300Hz |
| nth | n · 60Hz |
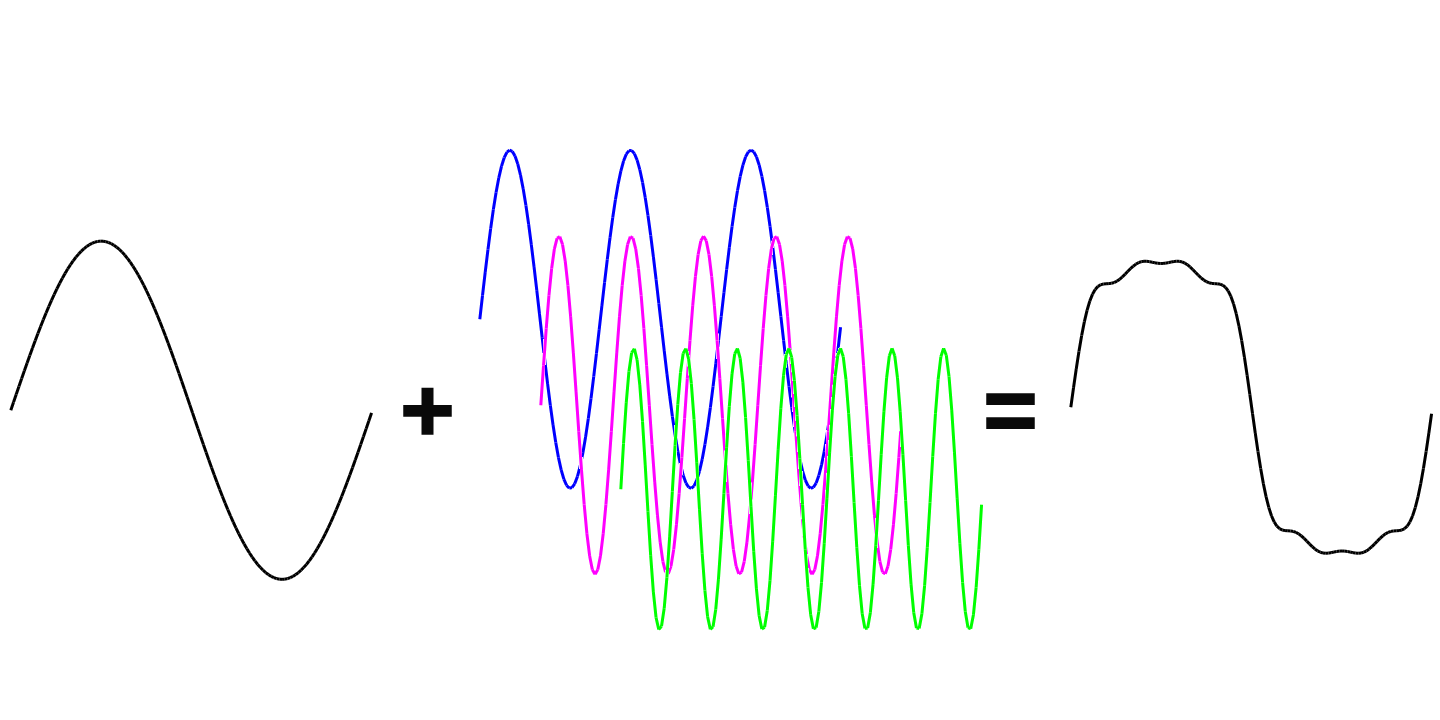
A continuous, periodic waveform can be fully described by the frequency and amplitude of the various sinusoidal signals superimposed on the fundamental frequency. That is, each harmonic is added to the base fundamental to make up the composition of the final waveform. A simple example shown in Figure 1 demonstrates the 3rd, 5th, and 7th harmonic waveforms with magnitudes of 20%, 10%, and 5% of the fundamental waveform respectively added together.
A harmonic which is not an integer multiple of the fundamental frequency is considered an interharmonic. The phenomena in which harmonics are below the fundamental frequency are considered sub-synchronous frequencies. A truly periodic waveform (with a 60 Hz period) will not have interharmonics, but differences in the waveform shape from cycle-to-cycle will result in interharmonics.
Distorted voltage usually arises from voltage drop through the system impedance caused by harmonic currents. If there are no non-linear (harmonic) loads, there usually is no voltage distortion. As a consequence, and for simplicity of this whitepaper, we will only focus on harmonic current.
Equation 2:
Total Demand Distortion (TDD) has a similar

equation to THD, except the RSS of system harmonics are compared to the maximum demand at full load. Equation 3 expresses this relationship.
Equation 3:

TDD is a significantly better metric for evaluating a system’s harmonic distortion. Harmonics rarely change proportionally to a decrease in load. Therefore under light loads, harmonics can appear much higher as a percentage than at higher loads. However, in terms of absolute amperes, they may have decreased or stayed the same. The TDD scaling gives a more representative measurement compared to the full load current, rather than a possibly small current that may have a high distortion but may be too low to be significant in an absolute sense.
Harmonic Analysis with ProVision
ProVision offers a distinct way to visualize harmonic data with a 3D harmonic overview. To generate a figure similar to Figure 2, select Graph from the main menu bar, navigate the drop-down menu to 3D Harmonic Graphs, select either Voltage or Current, and lastly specify which channel you wish to view. This view allows for a large set of data to be digested in a single view. For an in-depth explanation of 3D graphing features, see the whitepaper: Using 3D Graphs in Provision.
After overviewing the 3D plot of the recording, we can navigate the data with more precision. Figure 2 illustrated where the bulk of the distortion occurred. To look closer at this data set, we continue with ProVision’s RMS interval graphs (Graph->RMS Interval->Voltage and Current THD). In order to customize the graph to only include current, right-click the graph and select Customization Dialog. To view only specific sets of data, select the Subsets tab and select the series of interest (Figure 3 demonstrates min, max, and average of all 3 recorded channels).
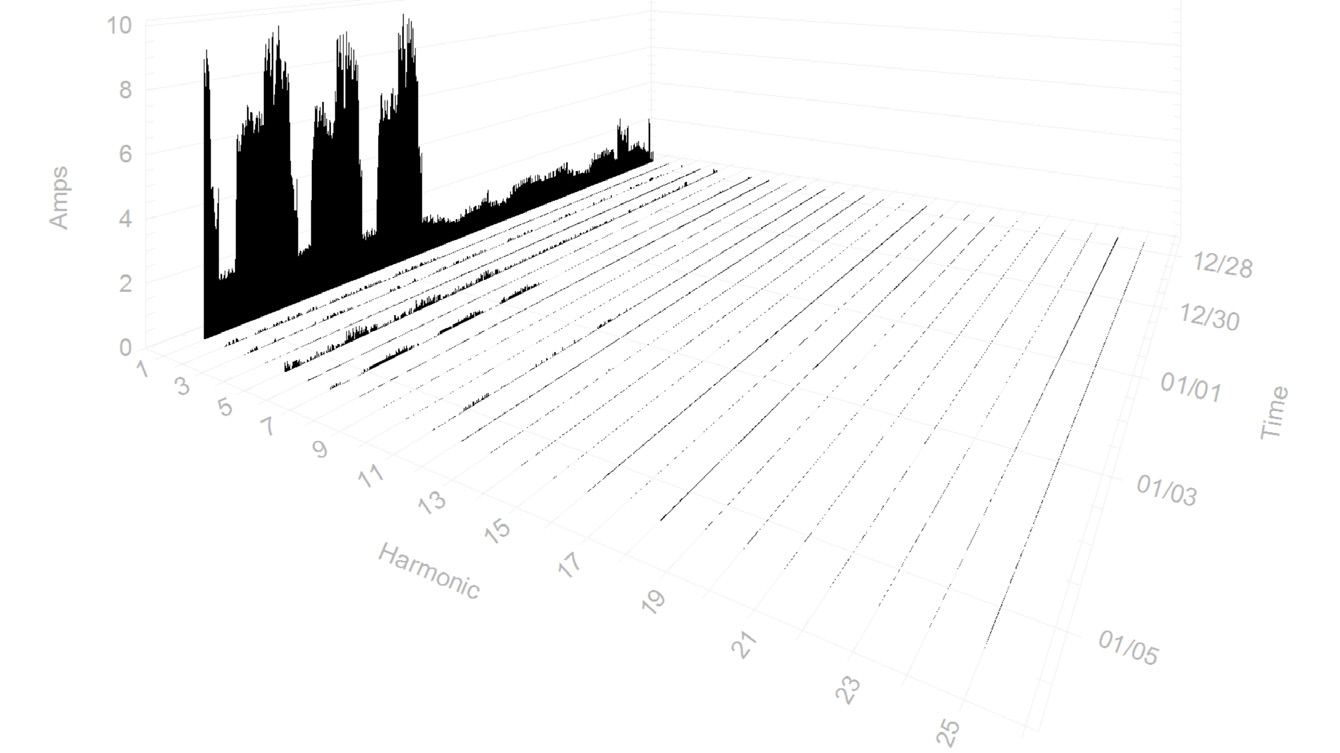
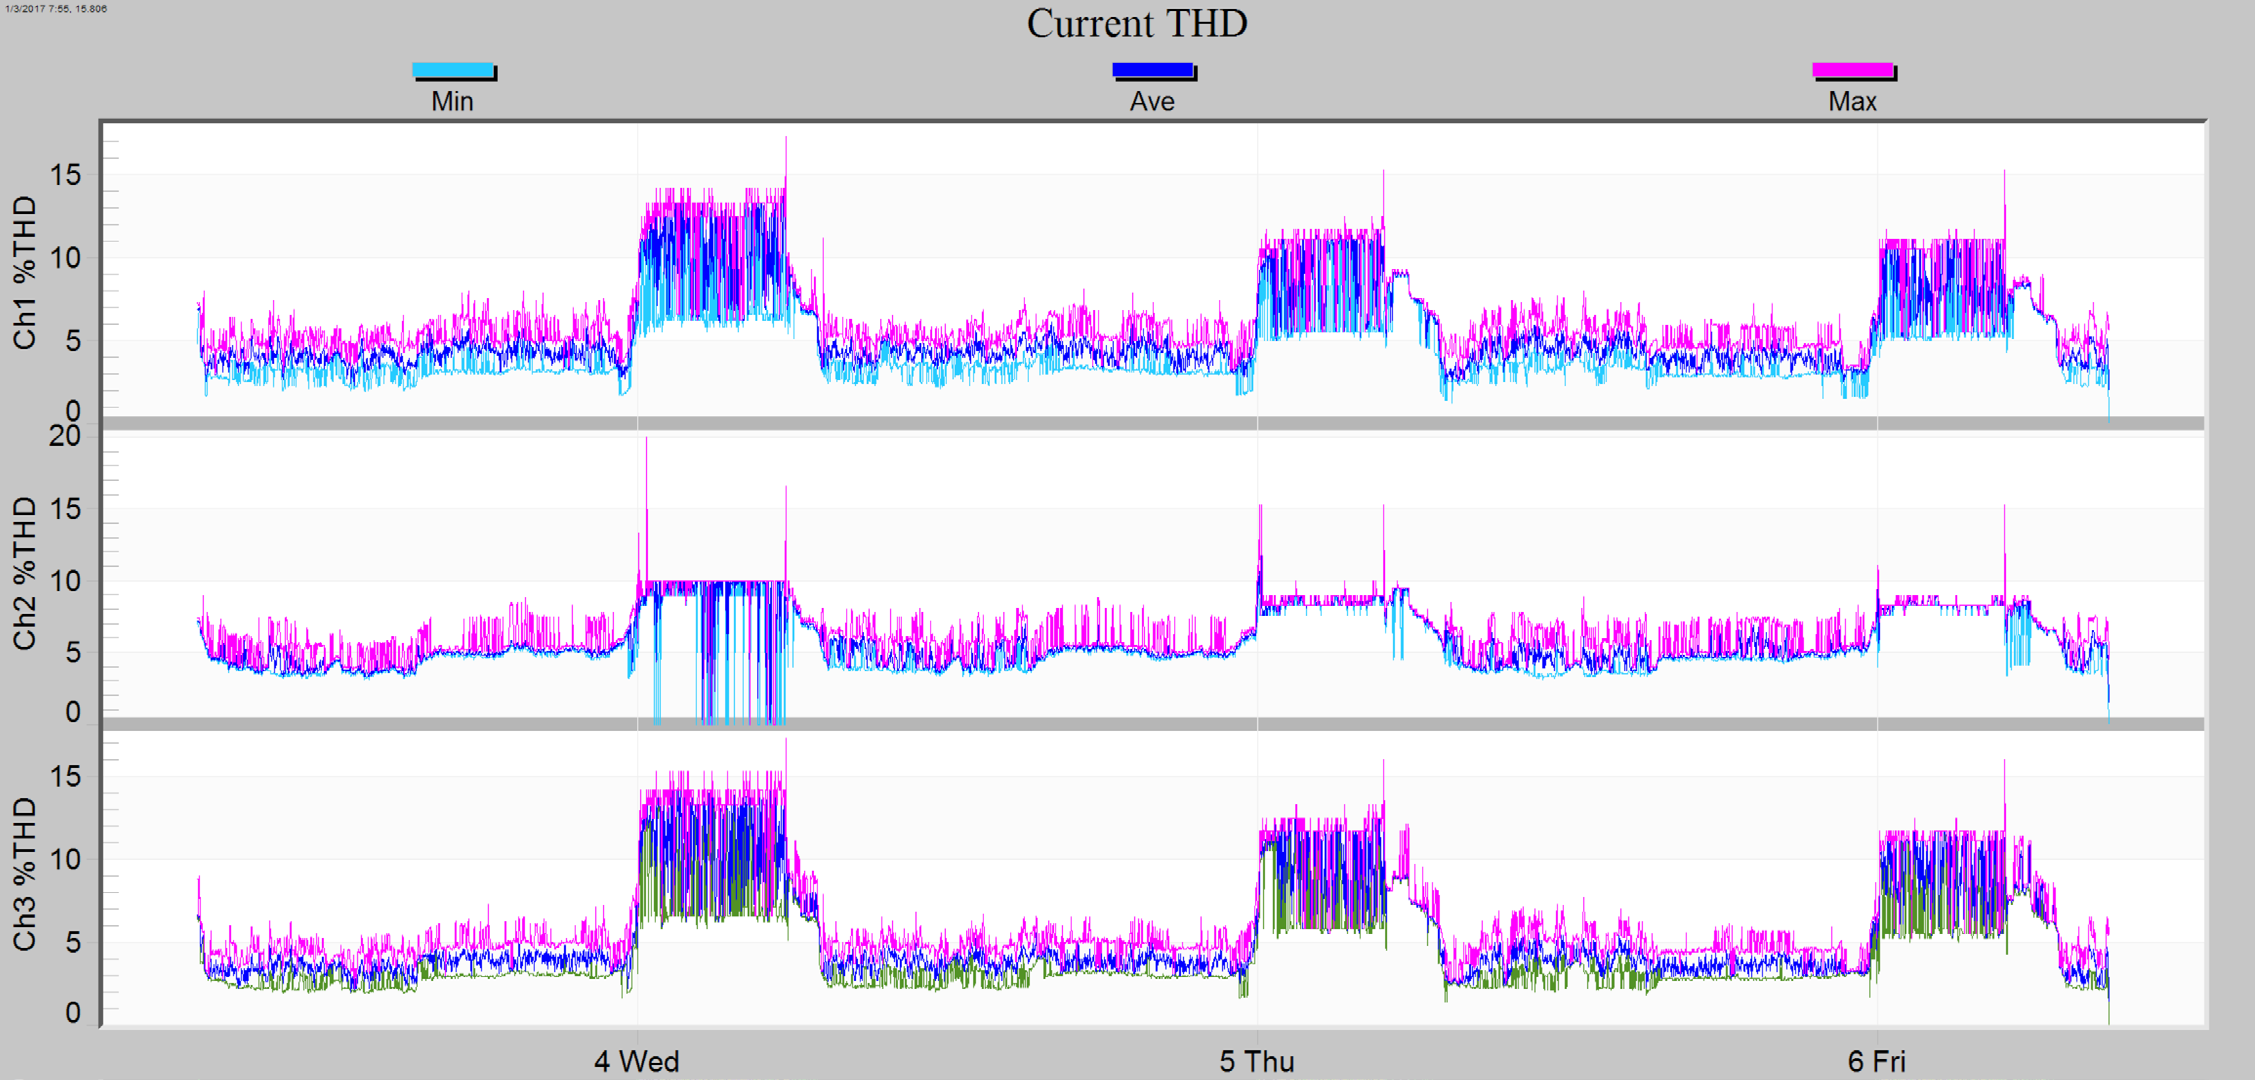
Figure 2 revealed the presence of the 5th and 7th harmonic. In order to investigate these further, it is often necessary to create a custom graph. The Custom Graph Wizard is an important tool for further analyzing harmonic data. Begin the custom graph by selecting Tools->Custom Graph Wizard within ProVision, as shown in Figure 4.
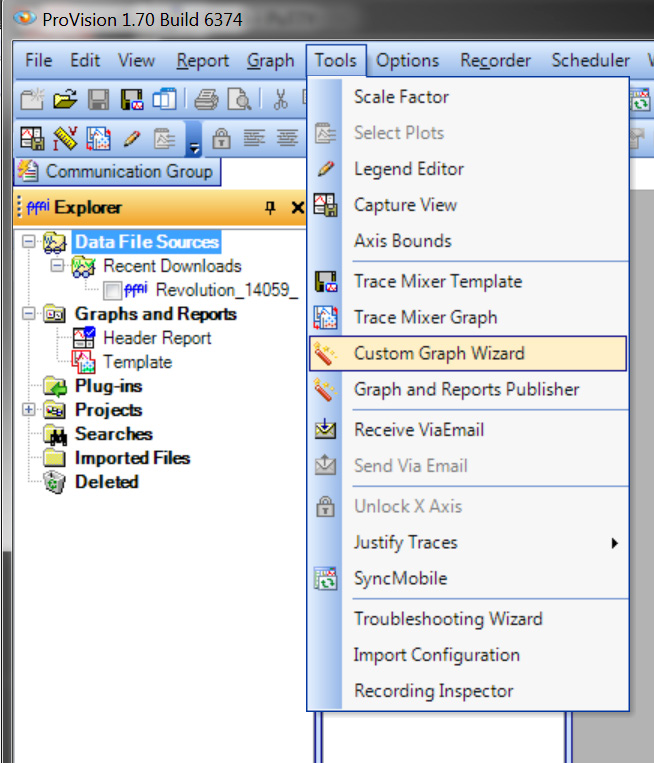
The whitepaper: Creating Custom Graphs for Harmonic Analysis offers insightful information on this topic. Take your time creating these templates, as they are often useful later when investigating future datasets. After creating a plot template, we can begin graphing the dataset of interest (Graph->Custom Graphs->*Name of Template*).
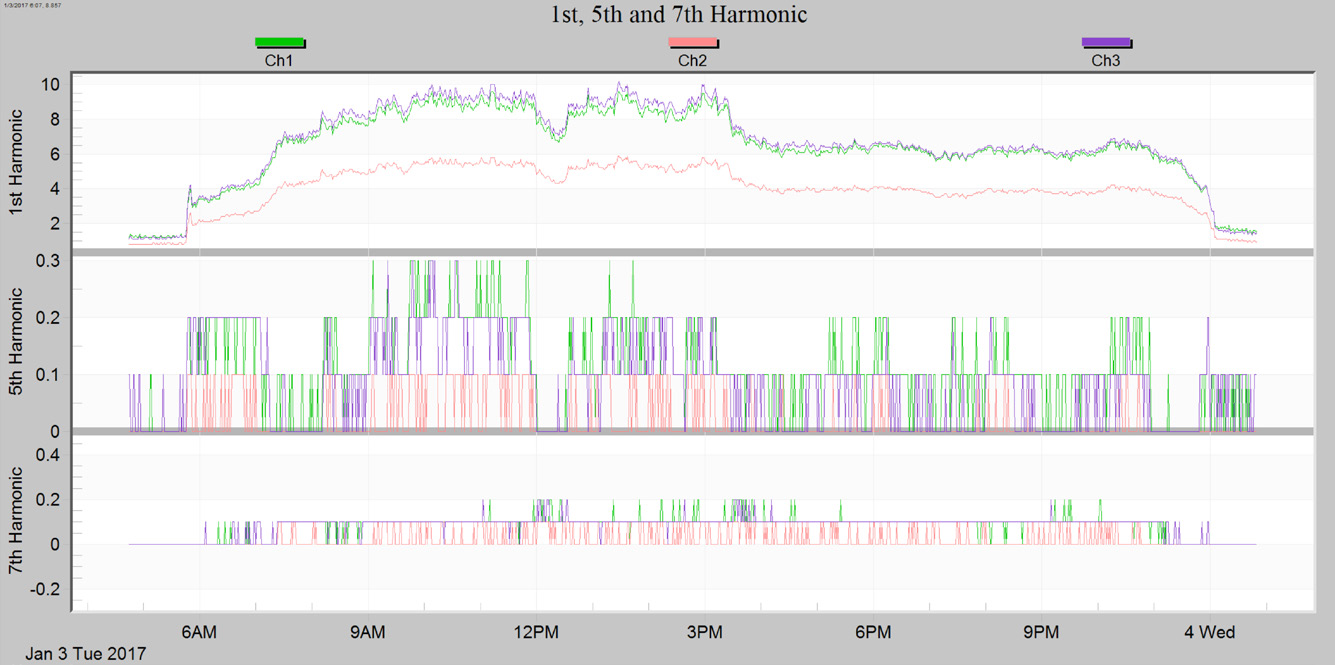
The 5th and 7th harmonics were selected because they showed the largest harmonic activity within 3D plot in Figure 2. Figure 5 reveals the current magnitude of each selected harmonic per channel. One distinct note is the existing imbalance on channel 2. The strip chart data is of a Wye-connected three phase motor.
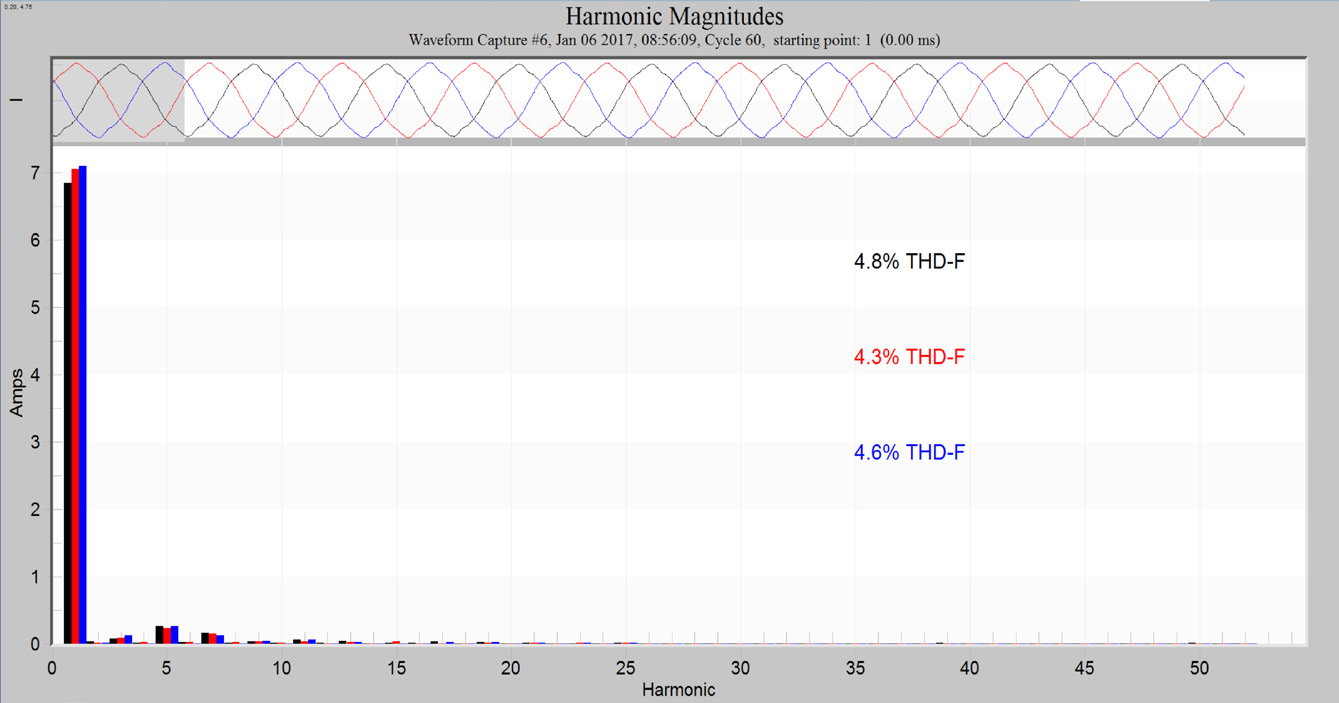
Harmonic bar chart analysis can be done with data recordings, which include waveform captures. This enables fine precision harmonic analysis at the moment of capture. Figure 6 offers an easy view of the harmonic magnitudes in comparison with each other. We see the 5th harmonic is the largest, followed by the 7th.
IEEE 519, Recommended Practices and Requirements for Harmonic Control in Electric Power Systems, offers an insightful recommendation for limited harmonics. This is extensively covered in the whitepaper: Using the Revolution for IEEE 519-2014 Harmonic Studies.
Conclusion
ProVision offers an excellent tool for analyzing and interpreting harmonic data. To get started with a harmonic analysis, use the 3D charts to narrow our focus where harmonic activity is most present. Once specific harmonics are identified, use the traditional 2D stripcharts with custom graphs to more closely analyze the harmonic trend data. Another powerful tool is the harmonic bar chart generated from waveform capture data. This provides information on all 51 harmonics without requiring pre-recorded stripcharts.