
Abstract
Sizing a backup power source is tedious. In an ideal world, every piece of equipment you need to protect would come with a spec sheet correctly detailing its power needs. In that ideal world you could simply sum the needs of the protected equipment and start shopping. However, we live in a world of incomplete information and often sizing a backup power source involves question marks and assumptions. PQ Canvass can help you answer those questions and eliminate the guesswork.
Backup Basics
The classic case for a backup power source is handling a complete loss of power. However, incoming power outside proper operating limits for equipment can also necessitate a backup power source. Over-voltage often leads to overheating and insulation breakdown, damaging and shortening the life of equipment. Under-voltage causes equipment to draw greater current to maintain power which also leads to overheating and equipment damage. Equipment may behave erratically when presented with either condition.
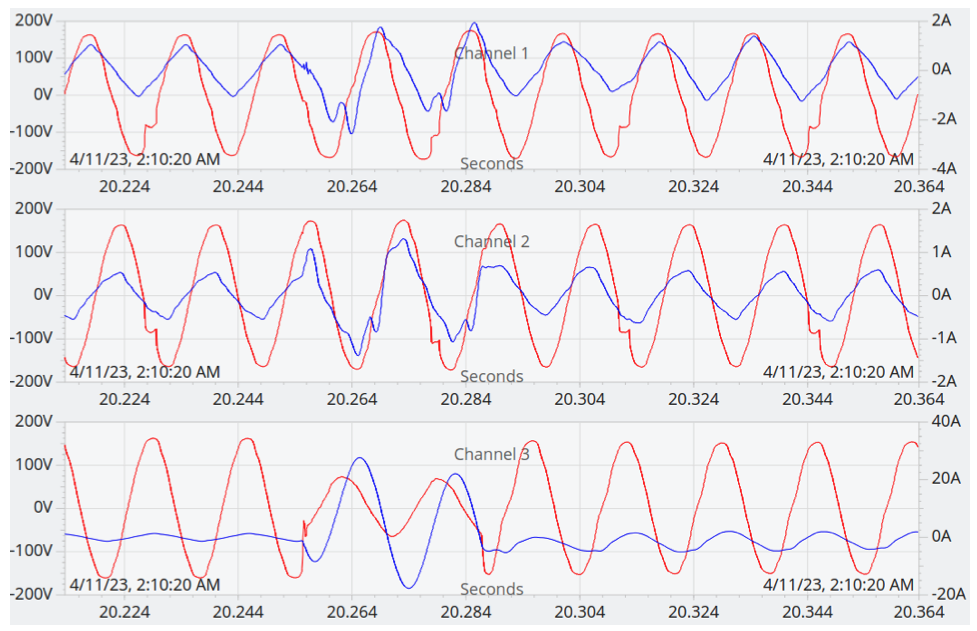
Voltage sag is a specific form of under-voltage which is short-lived and often caused by sudden changes in power demand or fault conditions. In this example, the voltage sag lasts only 2 cycles and may be imperceptible to the human eye, but can still cause issues for connected equipment. For this reason, a backup source which can trigger automatically is preferable to a manually activated backup source.
For further reading on voltage sags and power quality see PMI’s white paper Voltage Sags and Power Quality.
If all the information is readily available, sizing a backup power source is straightforward. Identify the equipment to be powered by the backup source, find the power draw for each, then sum those draws. However, this brings us to the first question: real power (W) or apparent power (VA)? Large industrial generators are typically listed by apparent power measured in volt-amps (VA) and the equipment they serve usually has all the relevant power information documented. On the other hand, medium and small sized generators are often listed by real power measured in Watts (W). Battery backup systems follow the same basic trend, though small battery systems are more likely to list ratings for VA than small generators.
Before even looking at the backup sources, you first have to look at the loads the backup system needs to support. Major commercial systems come with detailed power supply requirements, but many smaller devices may provide only the peak real power requirements (in Watts) or worse provide nothing. If you identify all the loads and each of them provides at least the real power requirements (in Watts), you can estimate the max apparent power (in volt-amps) using the following equation:

where W is the expected draw in Watts and PF is power factor.
Even this formula leaves a question of power factor. A power factor of 1.0 is perfect, but a value of 0.9 is generally agreed upon as the worst-best-case value and is a good jumping-off point for this equation.
Apparent power can also be computed by taking the product of voltage and current. Most power supplies for electronic devices will provide at a minimum the required input voltage range and the maximum current requirements. This would provide a maximum of apparent power, but may be less cost-effective than satisfying the true power needs.
Using PQ Canvass to Fill in the Blanks
PMI recorders can provide real measurements to eliminate the estimates. After installing the PQ monitor, log into the PQ Canvass web application and select the recently installed monitor. Obtaining real power consumption is simple.
- From the device menu, select “Graphs”
- From the Graphs menu, all three options are useful.
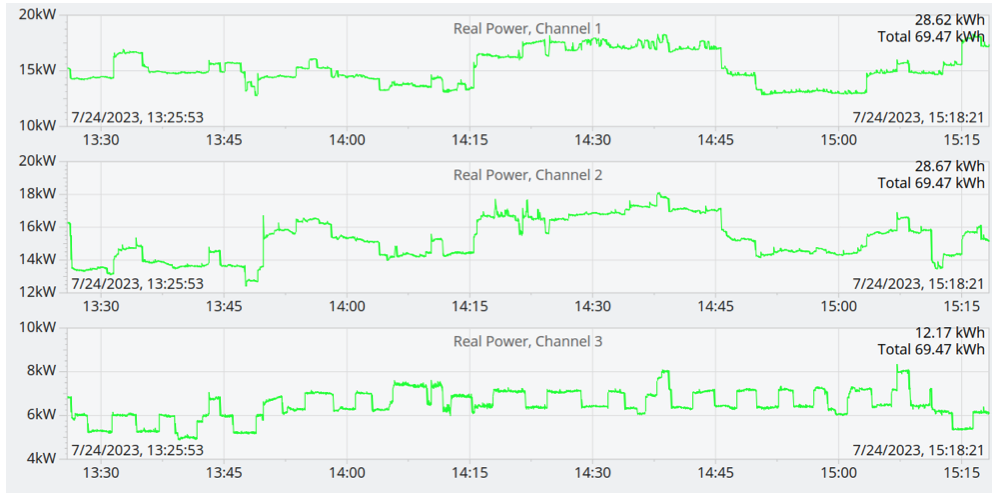
- Under “Interval“, you can view stripcharts for each channel of real power, including a total consumption measurement for the time shown.
- Under “Daily Profile” you can see how real power changes throughout the day to identify patterns.
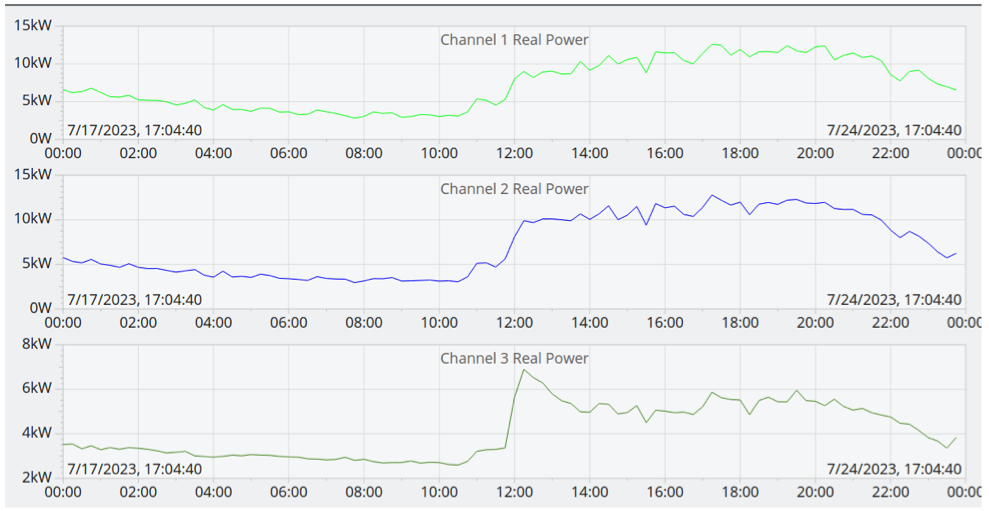
- Under “Histogram“, you can see a breakdown of how much is spent at each level of real power consumption.
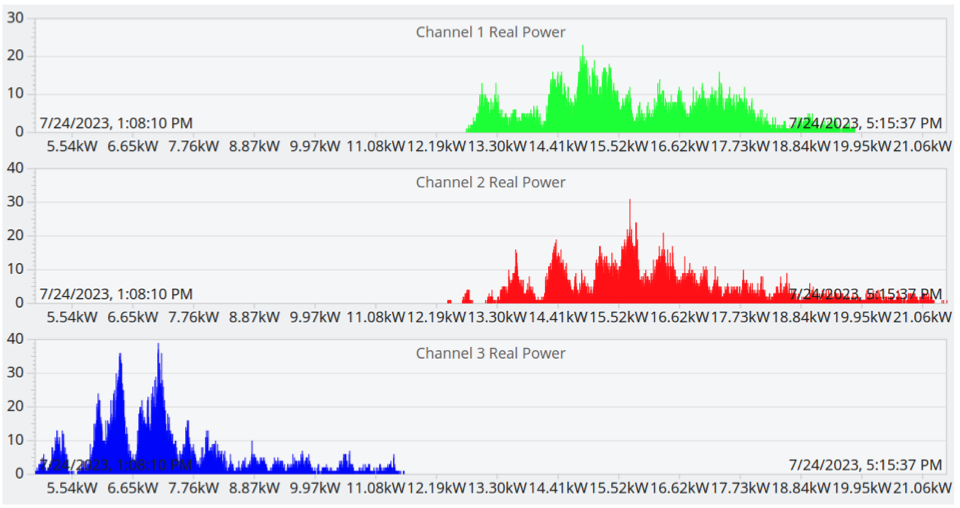
This real power information fills in the blank for power in Watts in the above equation.
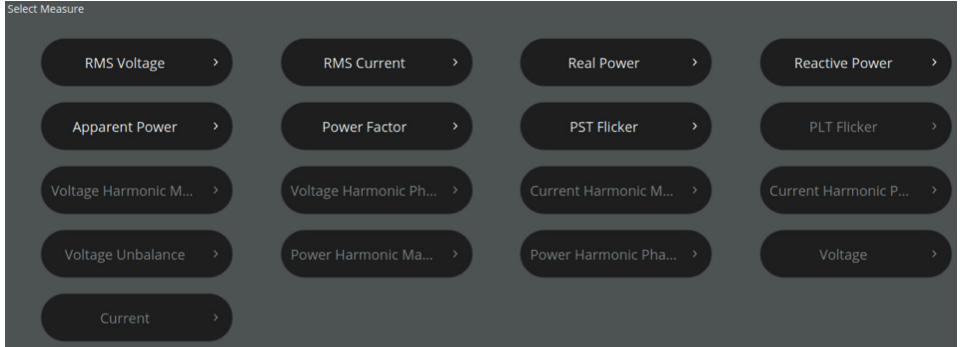
However, more measurements and analysis are available from a user-configured recording session. From a recording header report, apparent power in volt-amps and power factor are available as both stripcharts and daily profile graphs.
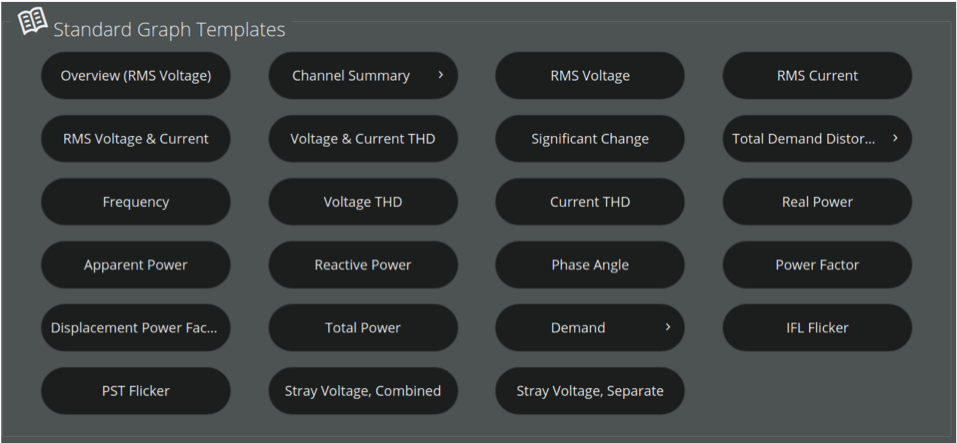
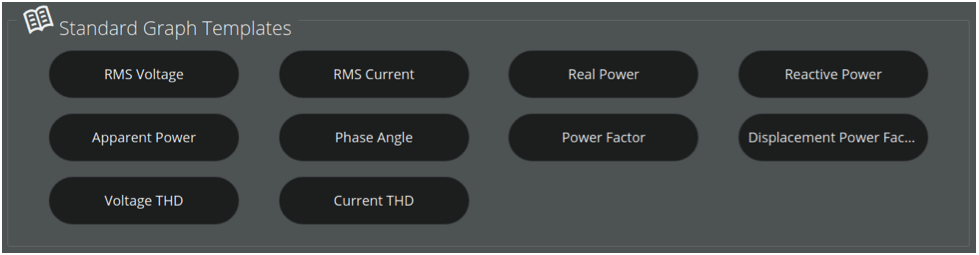
Apparent power is available in histogram format.

Recording stripcharts are available with min, max, and average traces for each measurement.
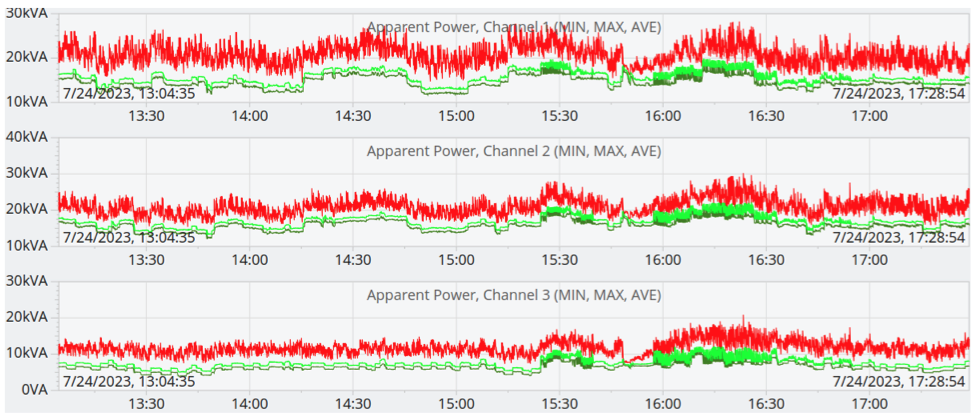
Looking at the maximum apparent power stripchart trace can be a quick and easy way of determining the maximum load in a system.
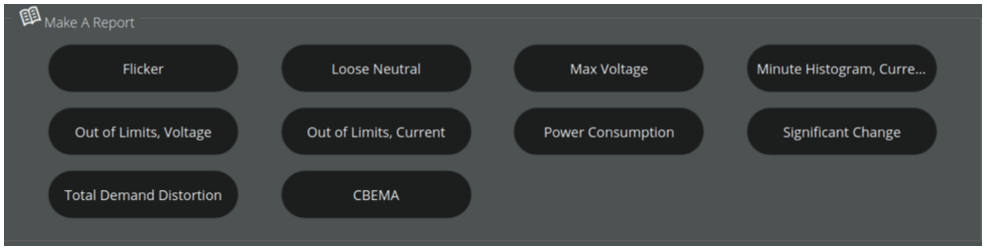
In addition to graphical depictions, recordings can also produce reports. Interval reports produce one row of data for each time period for easy export into CSV format.
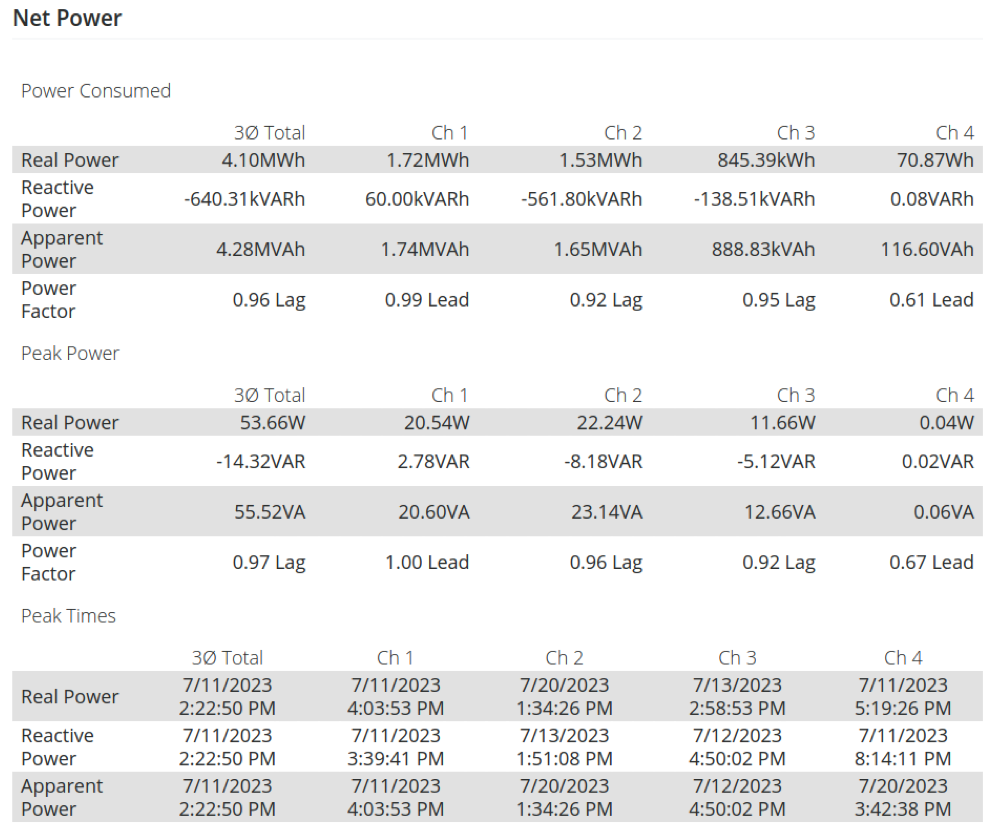
Recording reports create simple to understand outputs. For the purposes of sizing a backup, the Power Consumption report displays total and peak measures for real, apparent, and reactive power as well as power factor on all channels and the three phase total, if connected to a three phase system.
Further Considerations and Reading
Another consideration for backup power sources is inrush or starting current, which is the higher current briefly drawn by equipment at start versus the typically running load. Large commercial equipment will typically list the expected inrush current, but smaller devices may not. Measuring and analyzing inrush current is beyond the scope of this document, but is covered in Analyzing Motor Startups with Event Capture and Impact Loading. Be aware that inrush current contributes to voltage sag, covered in Voltage Sags and Power Quality.
Sensitive equipment may also require a low-THD power source, for which not all backup sources are created equal. For further reading on power quality of UPS battery systems, see Case Study of Portable Generator Power Quality.
Conclusion
When insufficient information is available from equipment vendors, a quick Power Quality session with a PMI PQ recorder and PQ Canvass can get you on your way to sizing a backup power source both quickly and with confidence.