
Abstract
Canvass now includes the ability to perform voltage unbalance studies using single-phase Boomerangs. Logical groupings of three Boomerangs may be created, and treated as a single 3-phase device. This virtual Boomerang is the source of 3-phase data, used to create voltage unbalance graphs. The use of single-phase devices allows flexibility in location selection not possible with an integrated 3-phase device.
Until now, all Canvass data analysis was geared towards single-phase graphs and reports, since the Boomerangs are single-phase devices. However, unbalance is an important steady-state RMS voltage parameter to measure and control. By grouping single-phase Boomerangs into logical 3-phase devices in Canvass, voltage unbalance can now be analyzed.
3-Phase Groups
Within Canvass, three Boomerangs may be grouped together in a “3-phase group.” The 3-phase groups act as an integrated 3-phase Boomerang-like device, and are treated as integrated devices in Canvass. The individual Boomerangs are also still available, and may be worked with individually as before, in addition to acting as part of a 3-phase group.
Although Canvass allows any three Boomerangs to form a group, to make meaningful voltage unbalance measurements, three Boomerangs must be selected with the following properties.
First, each should be on a separate phase of a single distribution circuit. Although it doesn’t matter which of the three Boomerangs are phase A, B, and C, they should all be different. If two Boomerangs are on the same phase, the voltage unbalance may not be correct – it will typically be lower than the true value (it cannot be higher). If all three Boomerangs are on the same phase, no unbalance information is present at all. Canvass (and the Boomerangs) have no way of checking the phasing, so it’s important to ensure that all three devices are on different phases during installation. Obviously all three Boomerangs should be on the same distribution circuit, since unbalance is typically caused by distribution loads. An exception may be in substations, monitoring metering PTs close to a substation transformer. In this case, the circuits may all be similar (or tied together), and using different circuits may be acceptable.
Second, the Boomerangs should be electrically “close” together, ideally at the same pole or transformer secondary. Voltage unbalance is typically due to distribution load current, and the more customer taps there are between Boomerangs, the more the distribution current will differ. In residential locations, distribution transformers may alternate among phases – electrically those transformers are close together, as long as no other loads are between them. A good location may be at a voltage regulator, or the last three phase taps at the end of a distribution line. A three-phase commercial secondary may also be a good monitoring point, especially if the load is relatively well balanced – that prevents the unbalance from being affected as much by the transformer impedance itself. For sensitive industrial loads, the best location is at the service entrance, on the transformer secondary, to accurately measure the unbalance for that customer, rather than characterizing the entire distribution circuit.
Third, the Boomerangs should all operate at the same nominal voltage (e.g. 120V, in the case of a monitoring PT or commercial 3-phase transformer secondary, or 240V in residential services). Mixing 240V and 120V nominal devices will give erroneous voltage unbalance readings.
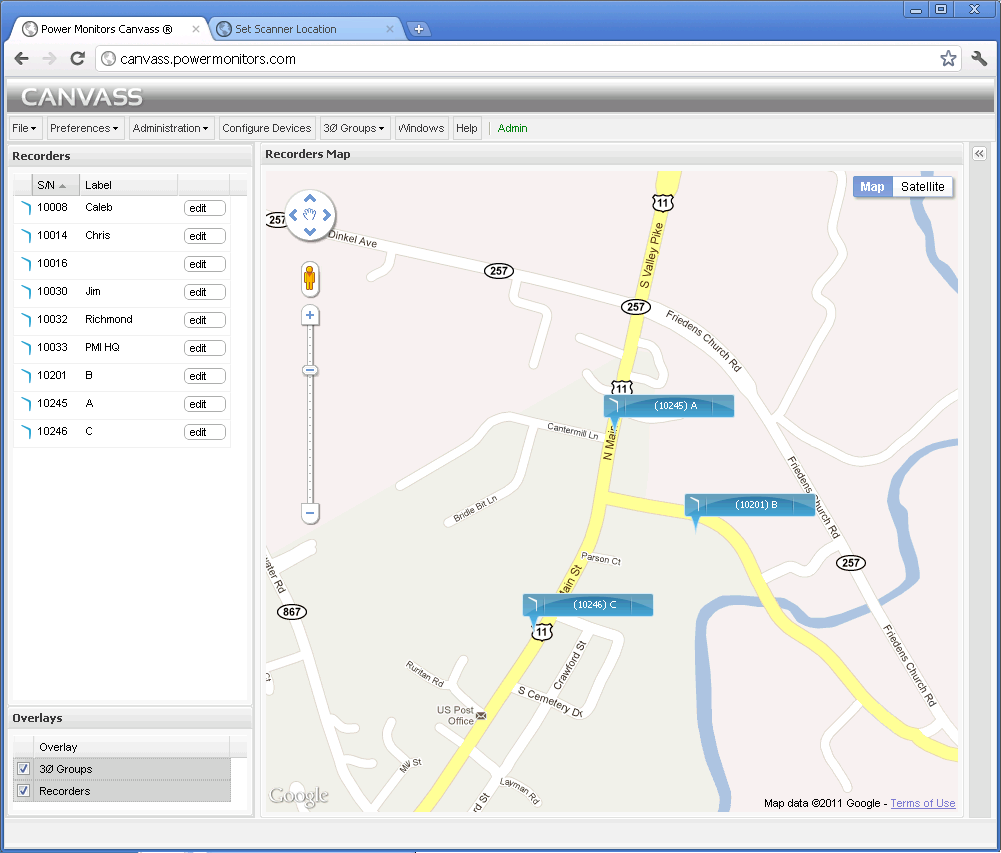
Figure 1 shows Boomerangs 10245, 10201, and 10246 located on phase A, B, and C of a 3-phase commercial service entrance (120/208V wye).
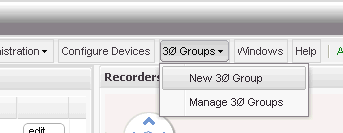
To create new 3-phase group, select 3Ø Groups > New 3Ø Group from the Canvass main menu, as shown in Figure 2. A form will appear, listing all the Boomerangs on the map. Select any three by checking the applicable checkboxes. Enter a name for the group, then click “Create Group.” In this example, Boomerangs 10201, 10245, and 10246 are selected, as shown in Figure 3 and the group will be named “PMI.”
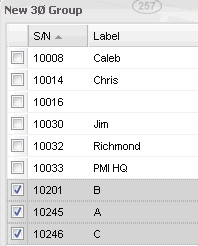
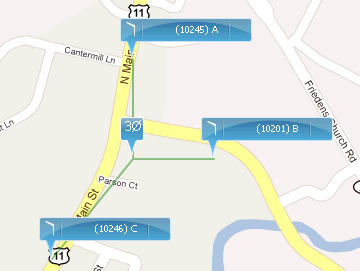
These three Boomerangs have been labeled B, A, and C, respectively to make identifying the phase easier. After the group is created, a 3-phase symbol appears in the geometric center of the three Boomerangs, as shown in Figure 4, to indicate that they are logically linked together as a 3-phase system.
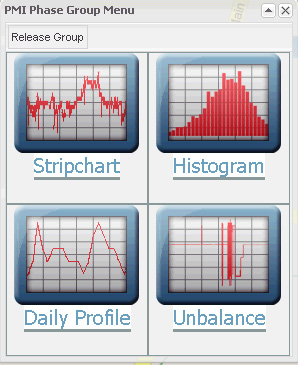
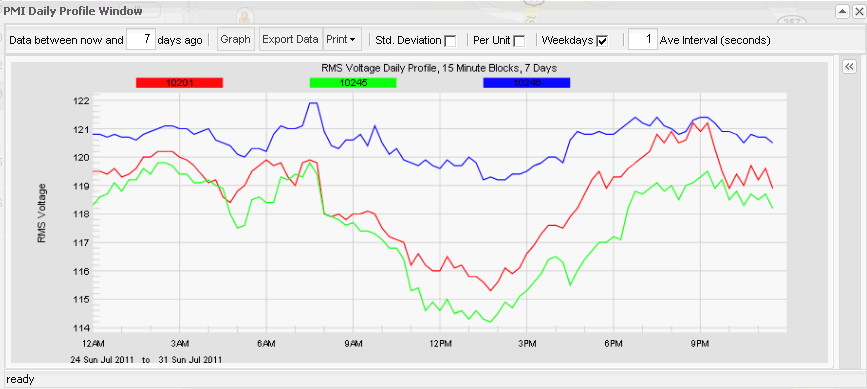
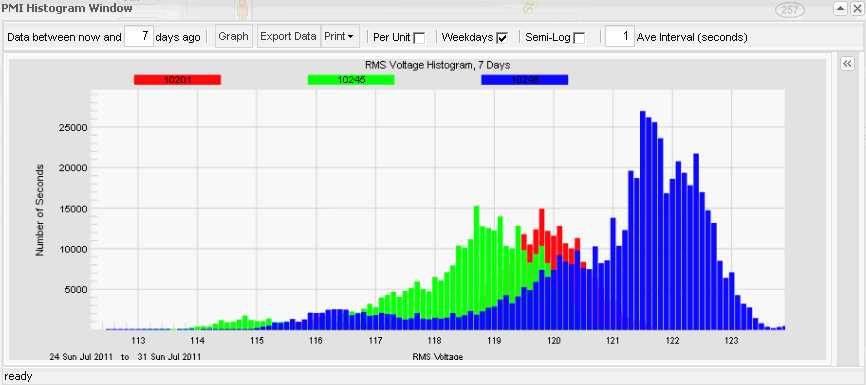
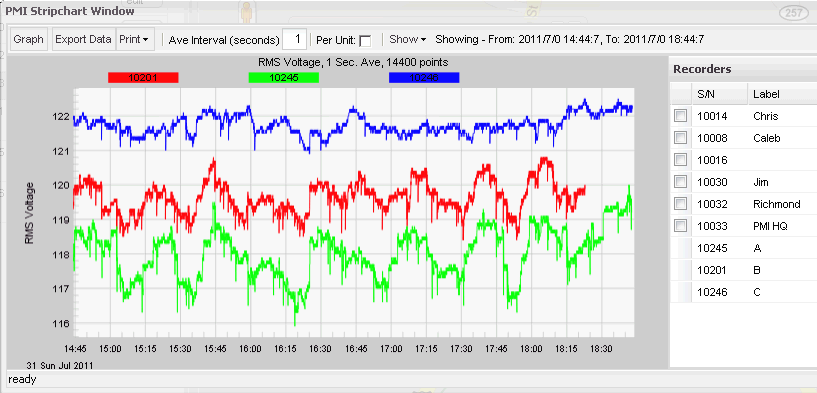
The three Boomerangs are still usable as before, as individual single-channel devices; simply click on the Boomerang icon to access the recorded data. Click on the 3Ø icon in the center will bring up a new graph form, as shown in Figure 5. The Stripchart, Histogram, and Daily Profile icons are similar to the single-phase Boomerang icons. In this case, clicking them will bring up the graph, with the three Boomerangs plotted on the same graph as shown in figures 6, 7, and 8. The list of other Boomerangs in the map are still present in the graph side-panel, and any other Boomerangs may be added to the graph as before. The three Boomerangs in the phase group may not be removed from the graph.
Clicking Unbalance brings up the new voltage unbalance graph. This graph shows a list of 3-phase groups in the side panel (only one in this graph), and the computed voltage unbalance in the graph area. Multiple 3-phase groups may be plotted together.
The unbalance is computed according to the IEEE definition – max deviation from the 3-phase average, divided by the 3-phase average, times 100%. So, for every second of voltage data, the 3-phase average RMS voltage is computed. The maximum difference of any phase from that average is found, and this difference is expressed as a percentage of the average. This is repeated for each second, and the result is plotted as voltage unbalance as shown in Figure 9.
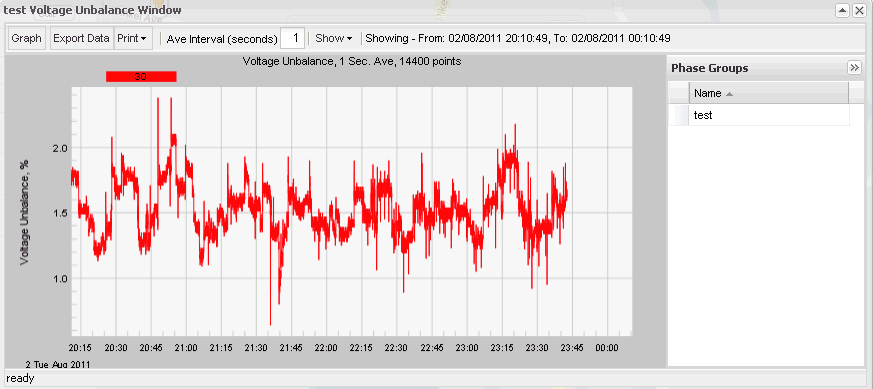
Since these devices are located on the same transformer secondary, at the service entrance, the unbalance data is the true voltage unbalance being served to the customer.
The same stripchart graphing features in the RMS Voltage graph are also present for the Unbalance graph – zooming in and out, changing the averaging interval, exporting data, graphing multiple devices, etc.
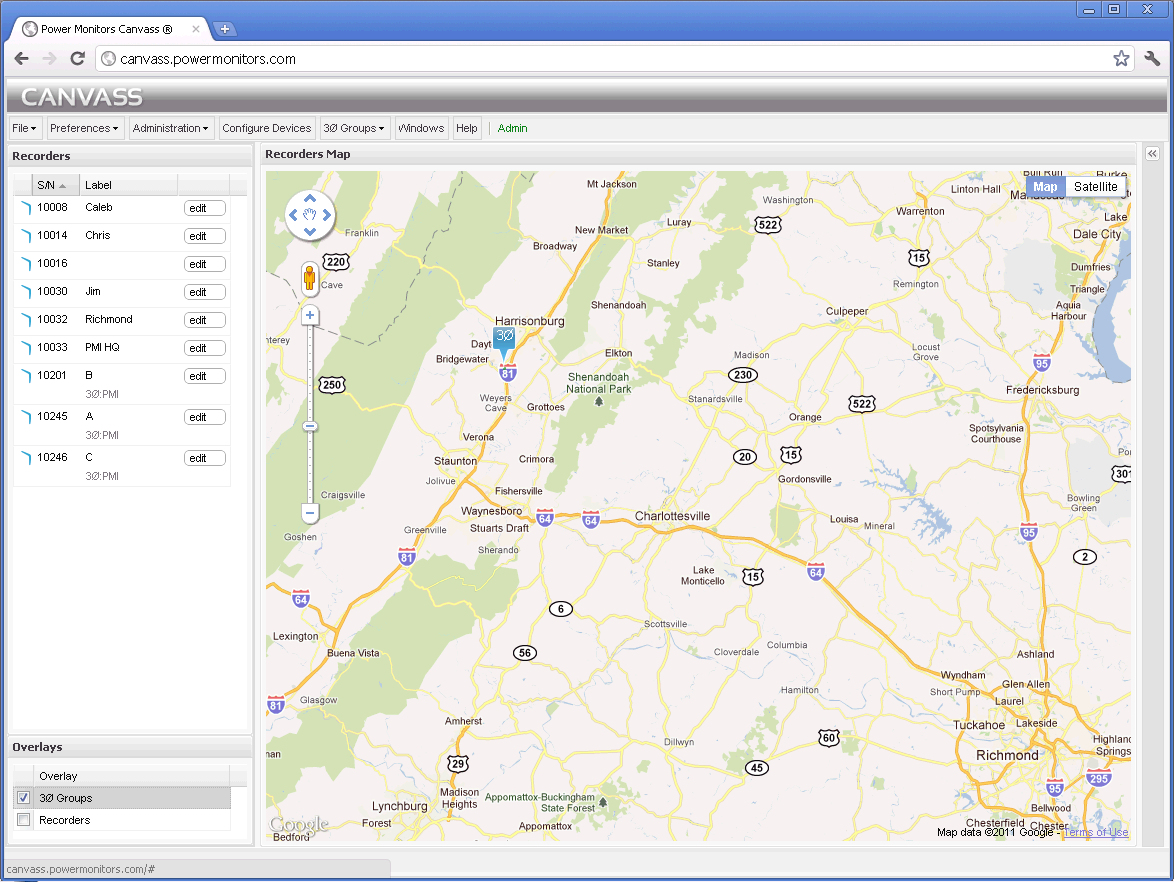
On the full-size zoomed-out map, 3-phase Groups may be difficult to see, since the Boomerangs are typically very close together. The Canvass map actually consists of two overlays – 3 Phase Groups, and Recorders; either can be toggled off or on as shown in Figure 10. The Overlay panel (lower left side) can be used to toggle overlays. Turn off the Recorder Overlay reveals the 3-Phase groups in the map.
Conclusion
The Voltage Unbalance addition to Canvass is a powerful tool for making the most of single-phase devices. With careful groupings of Boomerangs, meaningful three-phase system characteristics can be measured, without the expense of 3-phase monitors, and with the flexibility of separate single-phase monitoring points.