
Abstract
Voltages are rarely perfectly balanced in three-phase systems. Although small unbalances are not usually a problem, if this unbalance becomes too great then the unbalance can cause problems especially for three-phase motors or compressors. Fortunately unbalance is easy to measure with PMI three-phase Boomerangs and Revolutions with Canvass. Canvass provides the tools to help identify and locate the source of voltage unbalance problems.
Voltage Unbalance
Voltage unbalance in a three-phase system can be defined as the max deviation from the 3-phase average divided by the average.
Voltage unbalance = Max Deviation from Average Voltage / Average Voltage * 100 (to make it a percent).
For example, if the three line voltages are 124V, 119V, and 112V, the average voltage is (124 + 119 + 112)/3 = 118.3 volts. The maximum deviation is 6.3 volts, resulting in a percent imbalance of 5.3%. The voltage unbalance would be 6.3 / 118.3 * 100 = 5.3%.
Voltage unbalance is usually caused by single-phase and non-linear loads that are not evenly distributed. Sources of voltage unbalance are usually found inside of facilities.
A typical unbalance reading is under 1%. ANSI C84.1 recommends keeping voltage unbalance below 3% (as measured at a revenue meter), and many utilities target 2 or 2.5% as a maximum, where possible. For more information on measuring voltage unbalance and its causes see the whitepaper Measuring Voltage Unbalance.
Canvass and Voltage Unbalance
Canvass computes voltage unbalance from the one second average of the RMS voltage. The one second average of the RMS Voltage is always sent by Boomerangs and Revolutions that report to Canvass so voltage unbalance graphs are always available for three-phase devices. To view the voltage unbalance graph, choose a three-phase device and select voltage unbalance from the displayed selection dialog box (see Figure 1).
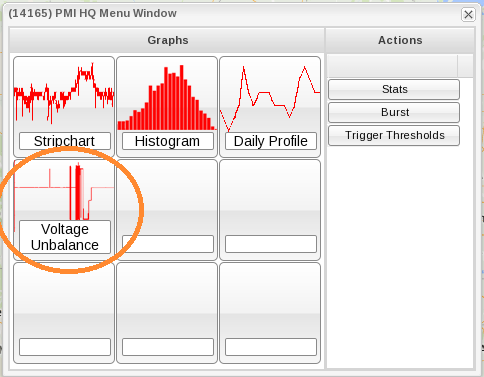
Figure 2 shows a one day graph of voltage along with a one day graph of voltage unbalance that was recorded from PMI headquarters. As people arrive and the load increases the voltage unbalance rises to almost 3 percent. Then as people leave, the load decreases and the unbalance returns to its lower level. The voltage graph shows that the unbalance is due mostly to the daily loading and that the load at this location is not very balanced with many single phase loads not distributed evenly among the phases. Figure 3 shows the voltage and current for the same day showing the sagging of the voltage is due to the current loads.
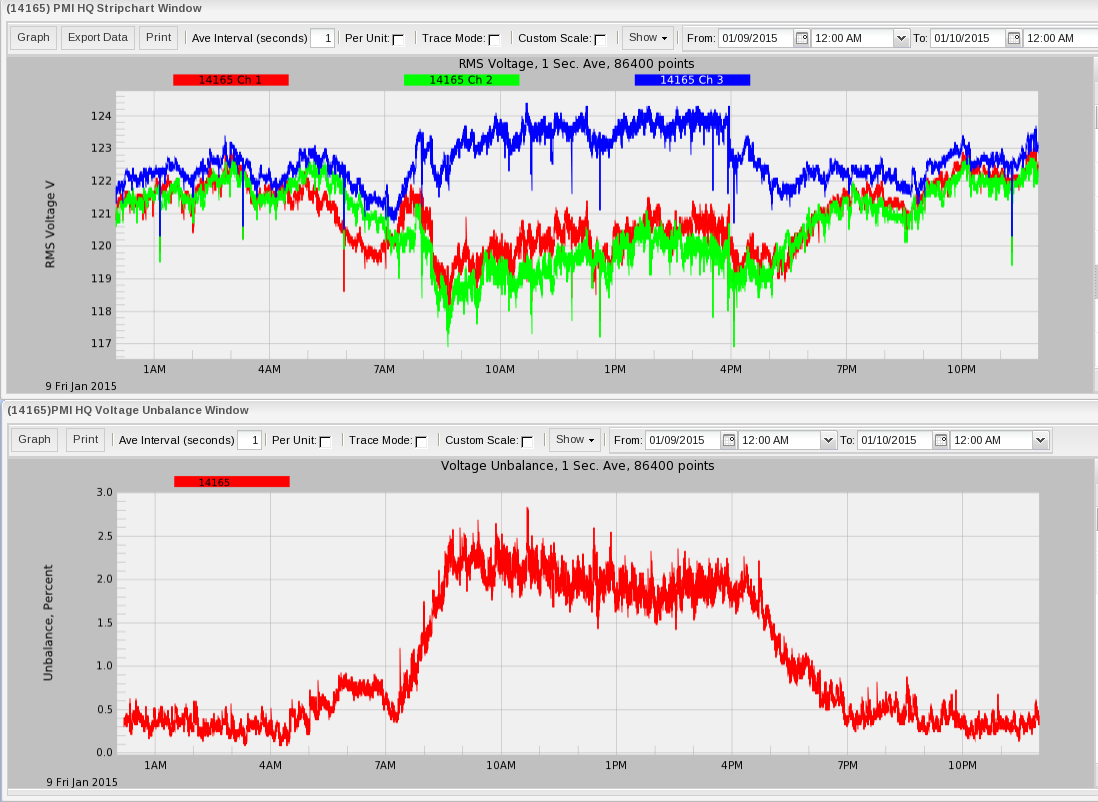
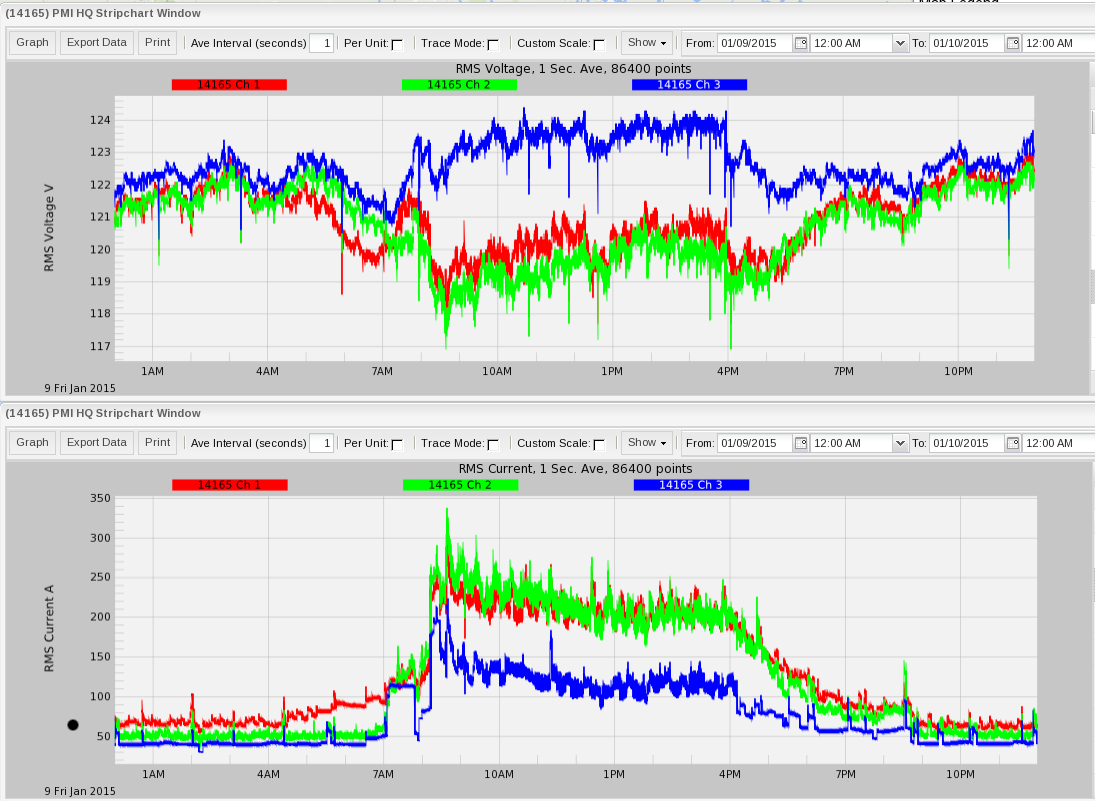
Figure 4 shows a one week voltage unbalance graph and a corresponding voltage graph. This graph clearly shows the regular pattern of voltage unbalance and that this unbalance corresponds to the arrival and departure of employees at the recorded location. Weekend loads do not reflect the same pattern as the weekday loads.
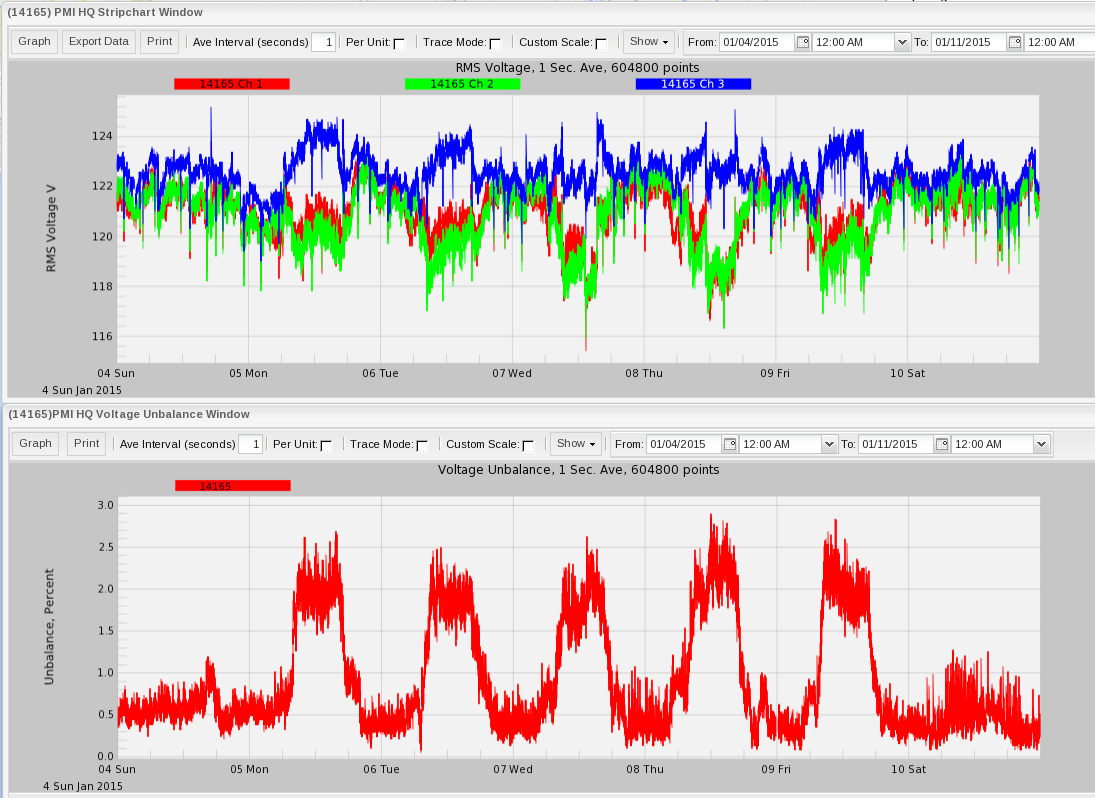
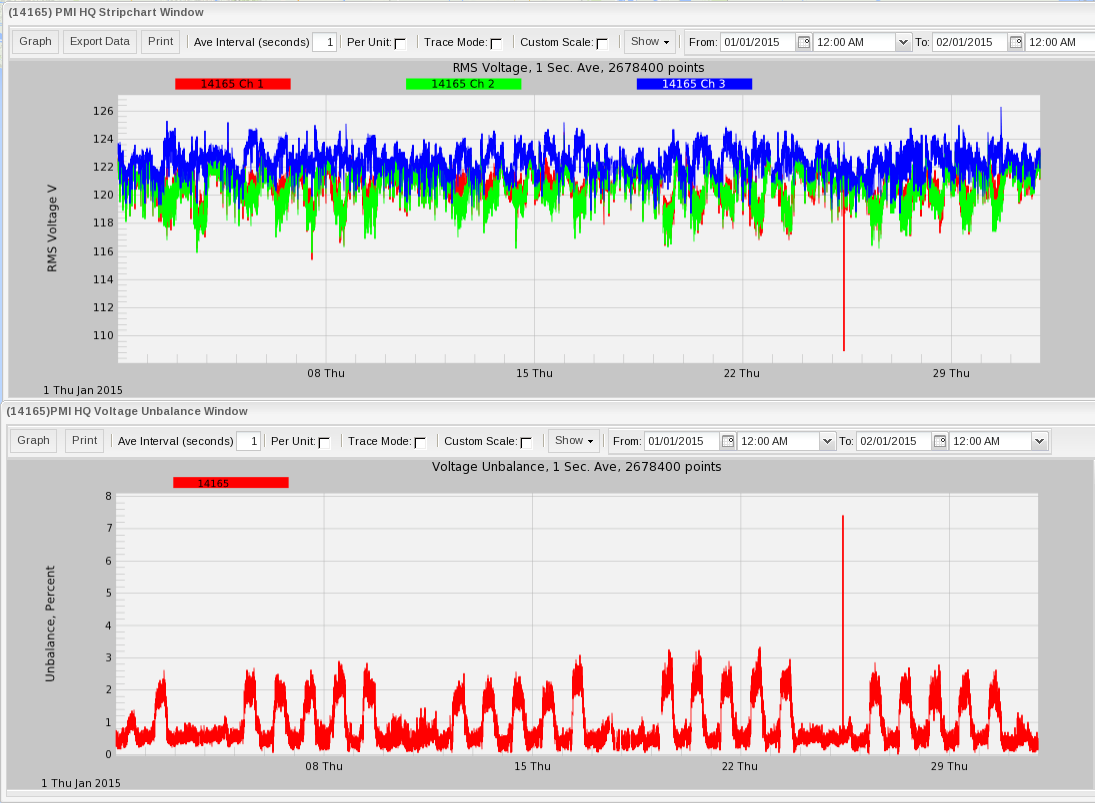
Figure 5 shows a one month graph showing the same daily usage pattern. It also shows a short external voltage drop on one phase and corresponding unbalance spike on Jan 25th at 9:57. This voltage drop on the one phase lasted less than a second. This drop pattern is typical of a momentary distribution fault. Normally voltage unbalance is a steady-state issue, and single-phase faults or sags have a different set of causes and solutions than unbalance from differing phase loads.
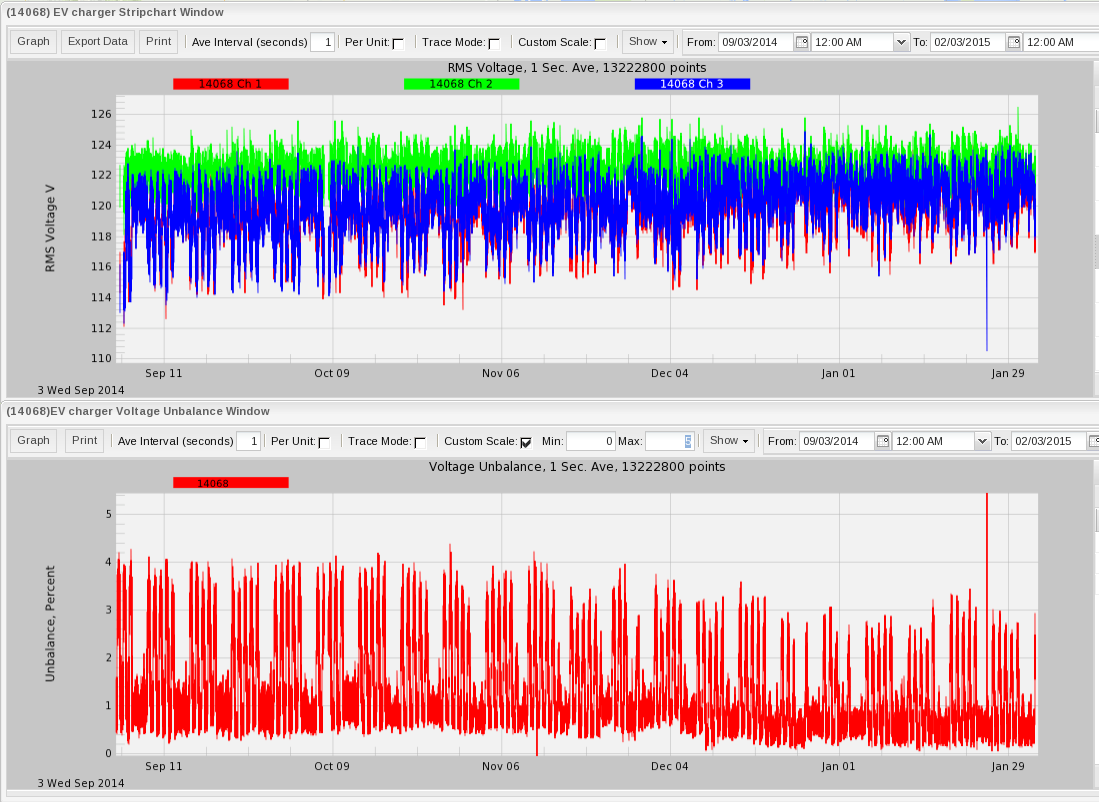
Long term graphs show patterns and can be used to establish baselines for comparing with future trends. Figure 6 shows a 5 month voltage unbalance and three-phase voltage graph. Here we can see that the unbalance sometimes exceeds 4%, but trended lower in December and January. The ability to zoom out to wide time ranges can be useful to locate infrequent problems. Once found, Canvass can be used to zoom into the problem area for more detail. Rising voltage unbalance can indicate a failure of a voltage regulator or a change in loads. Long term graphs of voltage unbalance graphs can also indicate changes in load over time such as seasonal or major equipment changes. Leaving Boomerangs or Revolution monitor at one location for longer times allows the ability to establish baselines and see long term patterns before they become apparent to customers, or lead to equipment failure.
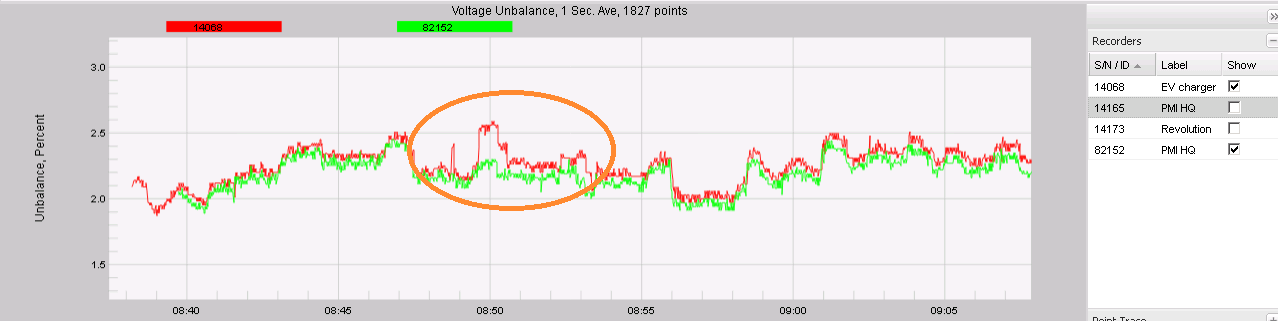
Canvass allows multiple voltage unbalance traces to be selected for a graph. Figure 7 shows a two trace voltage unbalance graph from two devices at PMI HQ, a 3-phase Boomerang at the service entrance (82152), and a Revolution at the end of a branch circuit (14068). The unbalance graphs track very closely much of the time, but as seen in the circled region, the end of the branch circuit deviates in some areas, with increased unbalance. This circuit feeds a single-phase 208V electric vehicle charger which creates an unbalanced load. Using two devices, one upstream, and one downstream, makes it easier to determine where the unbalance is coming from. This technique can be applied on a distribution line as well as inside a facility.
Data from the Boomerangs and Revolutions reporting to Canvass is stored and is available for analysis at anytime. This allows infrequent unbalance problems to be detected. The long term nature of the data allows patterns to be established. These patterns can aide in locating the cause of the unbalance.
3-Phase Groups
Within Canvass, three single-phase Boomerangs may be grouped together into a “3-phase group.” The 3-phase group acts as an integrated 3-phase Boomerang-like device, and is treated as integrated device in Canvass for voltage unbalance. The individual Boomerangs are also still available, and may be worked with individually as before, in addition to acting as part of a 3-phase group.
Although Canvass allows any three Boomerangs to form a group, to make meaningful voltage unbalance measurements, three Boomerangs must be selected that are on different phase, and electrically close together. For example, three Form 2S meter socket Boomerangs in a residential location, where each Boomerang is fed from a different distribution phase, and electrical near each other on a lateral (no large loads, voltage regulator, or cap bank between them).
To create new 3-phase group, select 3Ø Groups > New 3Ø Group from the Canvass main menu. A dialog will appear listing all the Boomerangs on the map. Select any three by checking the applicable checkboxes. Enter a name for the group, then click Create Group. For more information about creating and using three-phase groups see the whitepaper Voltage Unbalance With Single-Phase Boomerangs in Canvass.
Conclusion
Voltage unbalance can produce problems with polyphase loads, and therefore it is an important parameter to check when analyzing any 3-phase data set. Since the unbalance data is computed from the one second average voltage data, it is always available in Canvass. If you see values approaching 1.5%, it is worth noting, and anything above 3% could be a cause for concern or further action. PMI’s line of power quality monitors can be used with Canvass to quickly and easily locate voltage unbalance problems.