
Abstract
PQ Canvass is a web-based power quality analysis software developed by Power Monitors Inc. It combines the foundational elements of Canvass with the features of ProVision, providing a set of tools for power quality assessment.
This white paper explores how to use PQ Canvass for monitoring voltage regulation. It includes discussions on utilizing daily profile graphs, side-by-side displays, and custom annotations to collect and interpret data effectively.
What Is Voltage Regulation?
In simple terms, voltage regulation is assessed by measuring the service voltage (also known as the point of connection) in order to attempt to stay within the standards outlined by ANSI C84.1 (which is recommended for any utility). A brief overview of the key elements of this standard are listed below:
- RANGE A: Defined as being within +/- 5% of the design target most of the time. Note that “most of the time” lacks a precise definition, and may be set by the utility. Typically, it is set at 95%, meaning your recommended target voltage should be within 5% of the defined target 95% of the time
- RANGE B: Covers short-term excursions occurring within +6% to -13% of the standard design. These excursions typically last 5-15 minutes and are meant for unusual situations such as switching events or alternate circuit configurations
ANSI C84 also defines the following terms:
- Service Voltage: The voltage level at the point of delivery (typically the meter base).
- Utilization Voltage: The voltage level at the utility customer’s electrical equipment.
We’ll now look at the quickest way to assess voltage regulation using PQ Canvass.
Custom Annotations
PQ Canvass allows you to create and save custom annotations based on your needs, as well as adjust the graph axes to better focus on the relevant data.
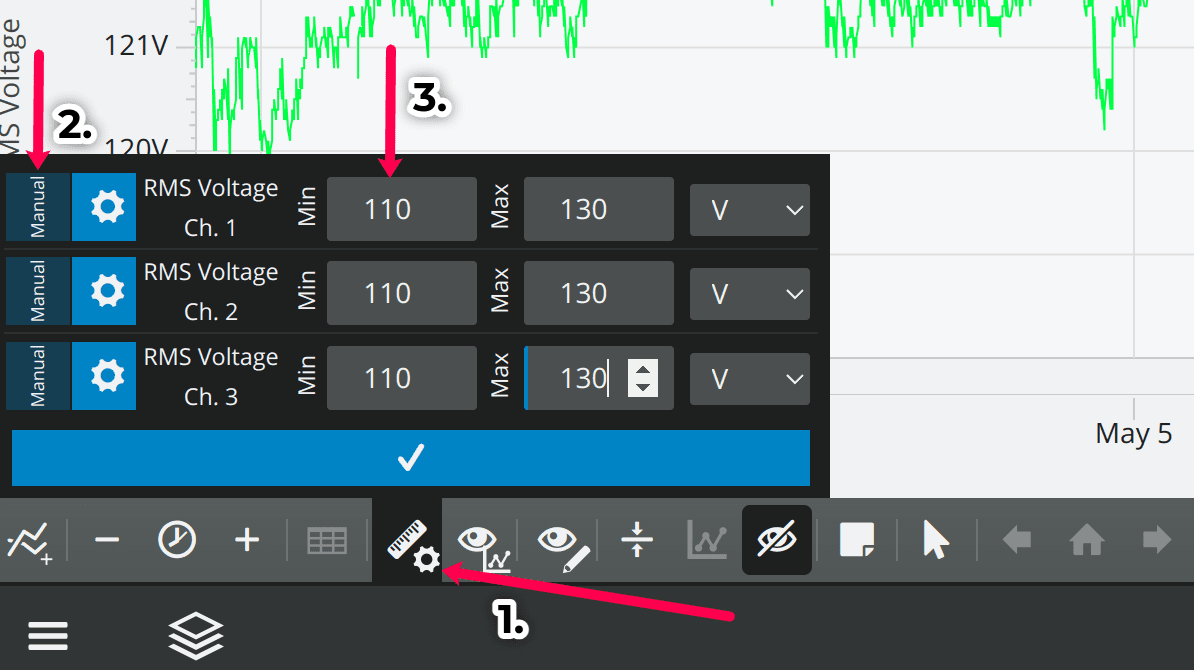
For example: You can create a custom axis based on your nominal. In this example it is 120V, so we set the range to be between 110V and 130V (see Figure 1).
Going further, we can then create graph annotations to demarcate our limits. In this case we will mark Range A, which you will recall is +/- 5% our nominal.
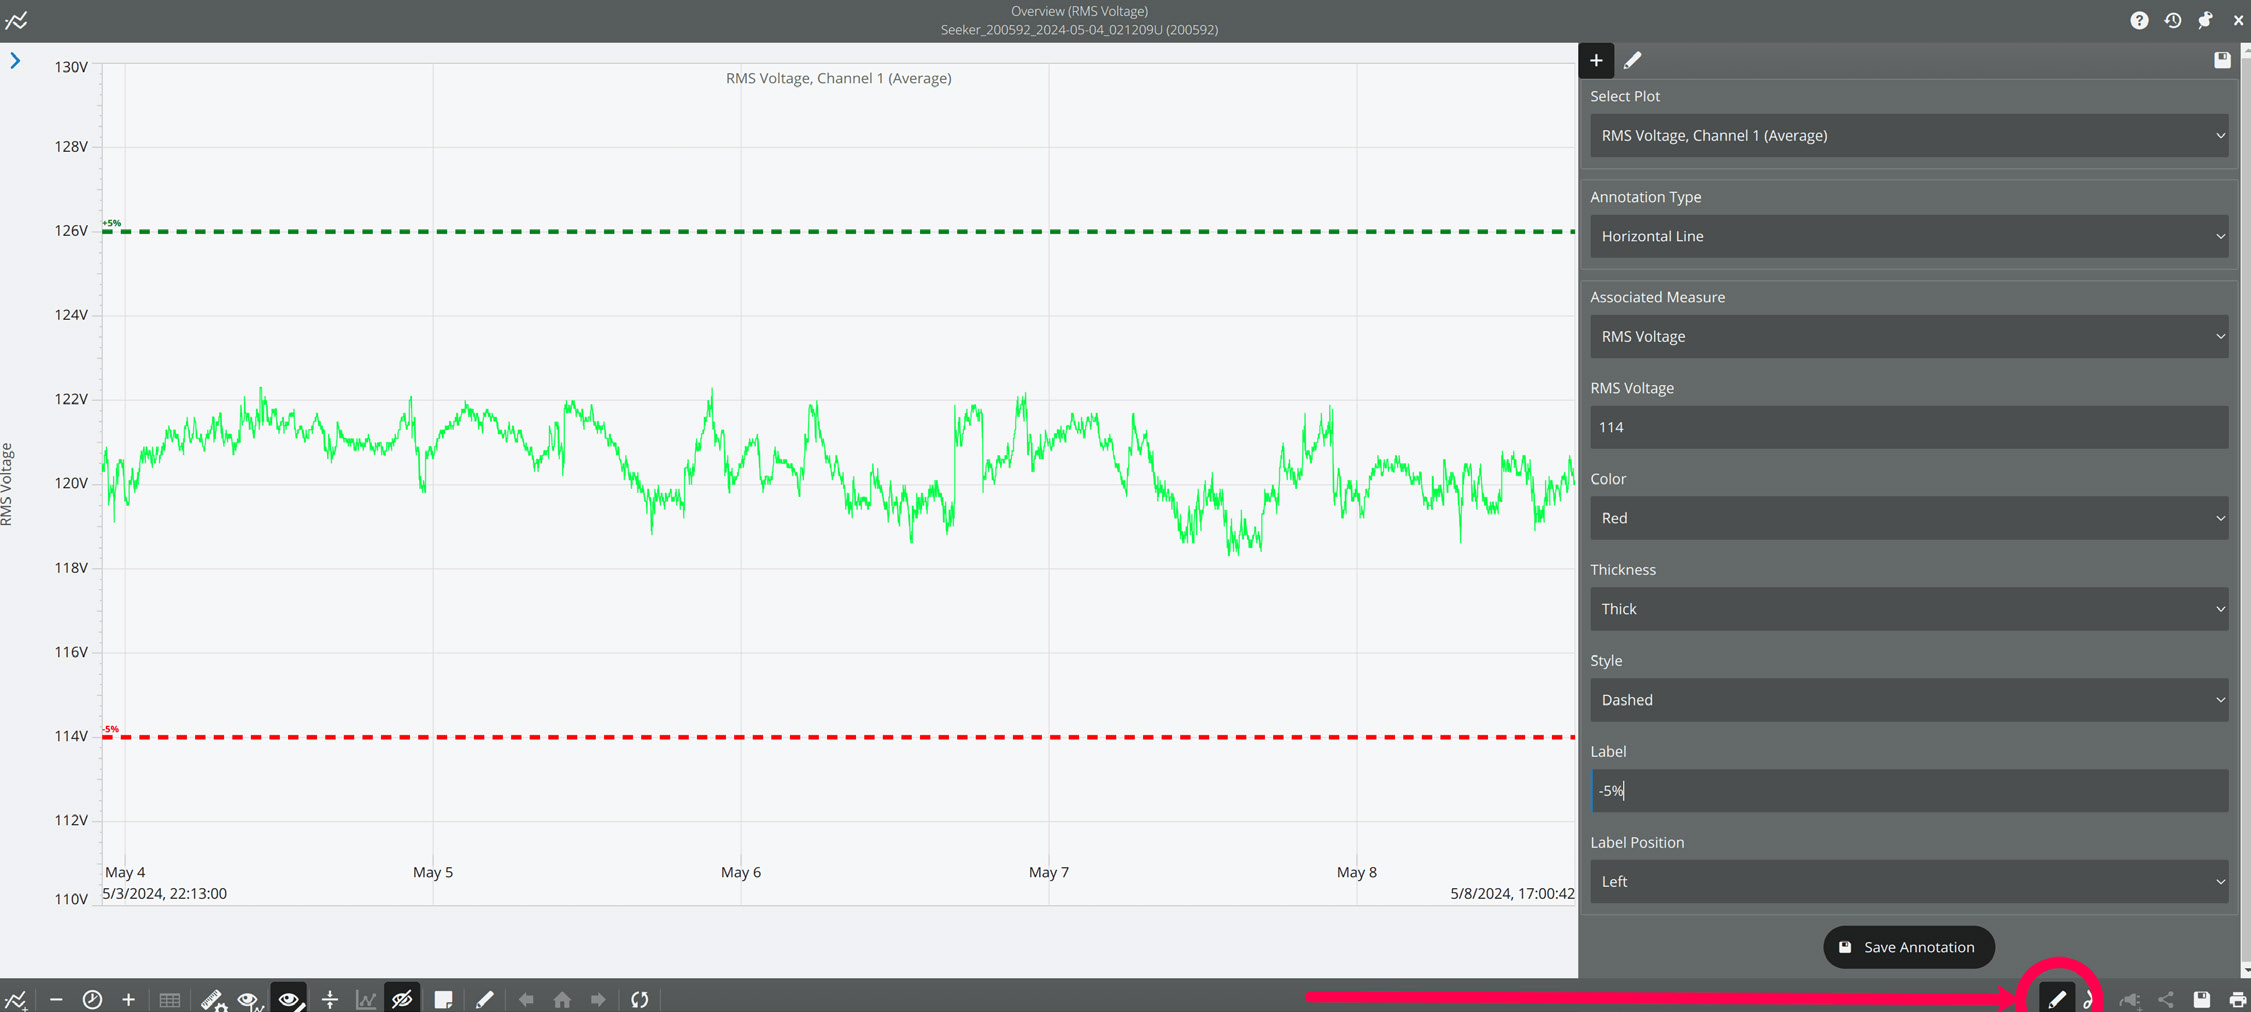
After saving your annotation, make sure to select “Show Annotations” in the toolbar.

Side by Side Views
Viewing just one graph may not paint the full picture however. For example, if a customer were to take a measurement at the affected equipment, this is not necessarily indicative of a voltage regulation issue for which the utility needs to intervene. Measurements should instead be taken at the point of connection (again, typically the meter base).
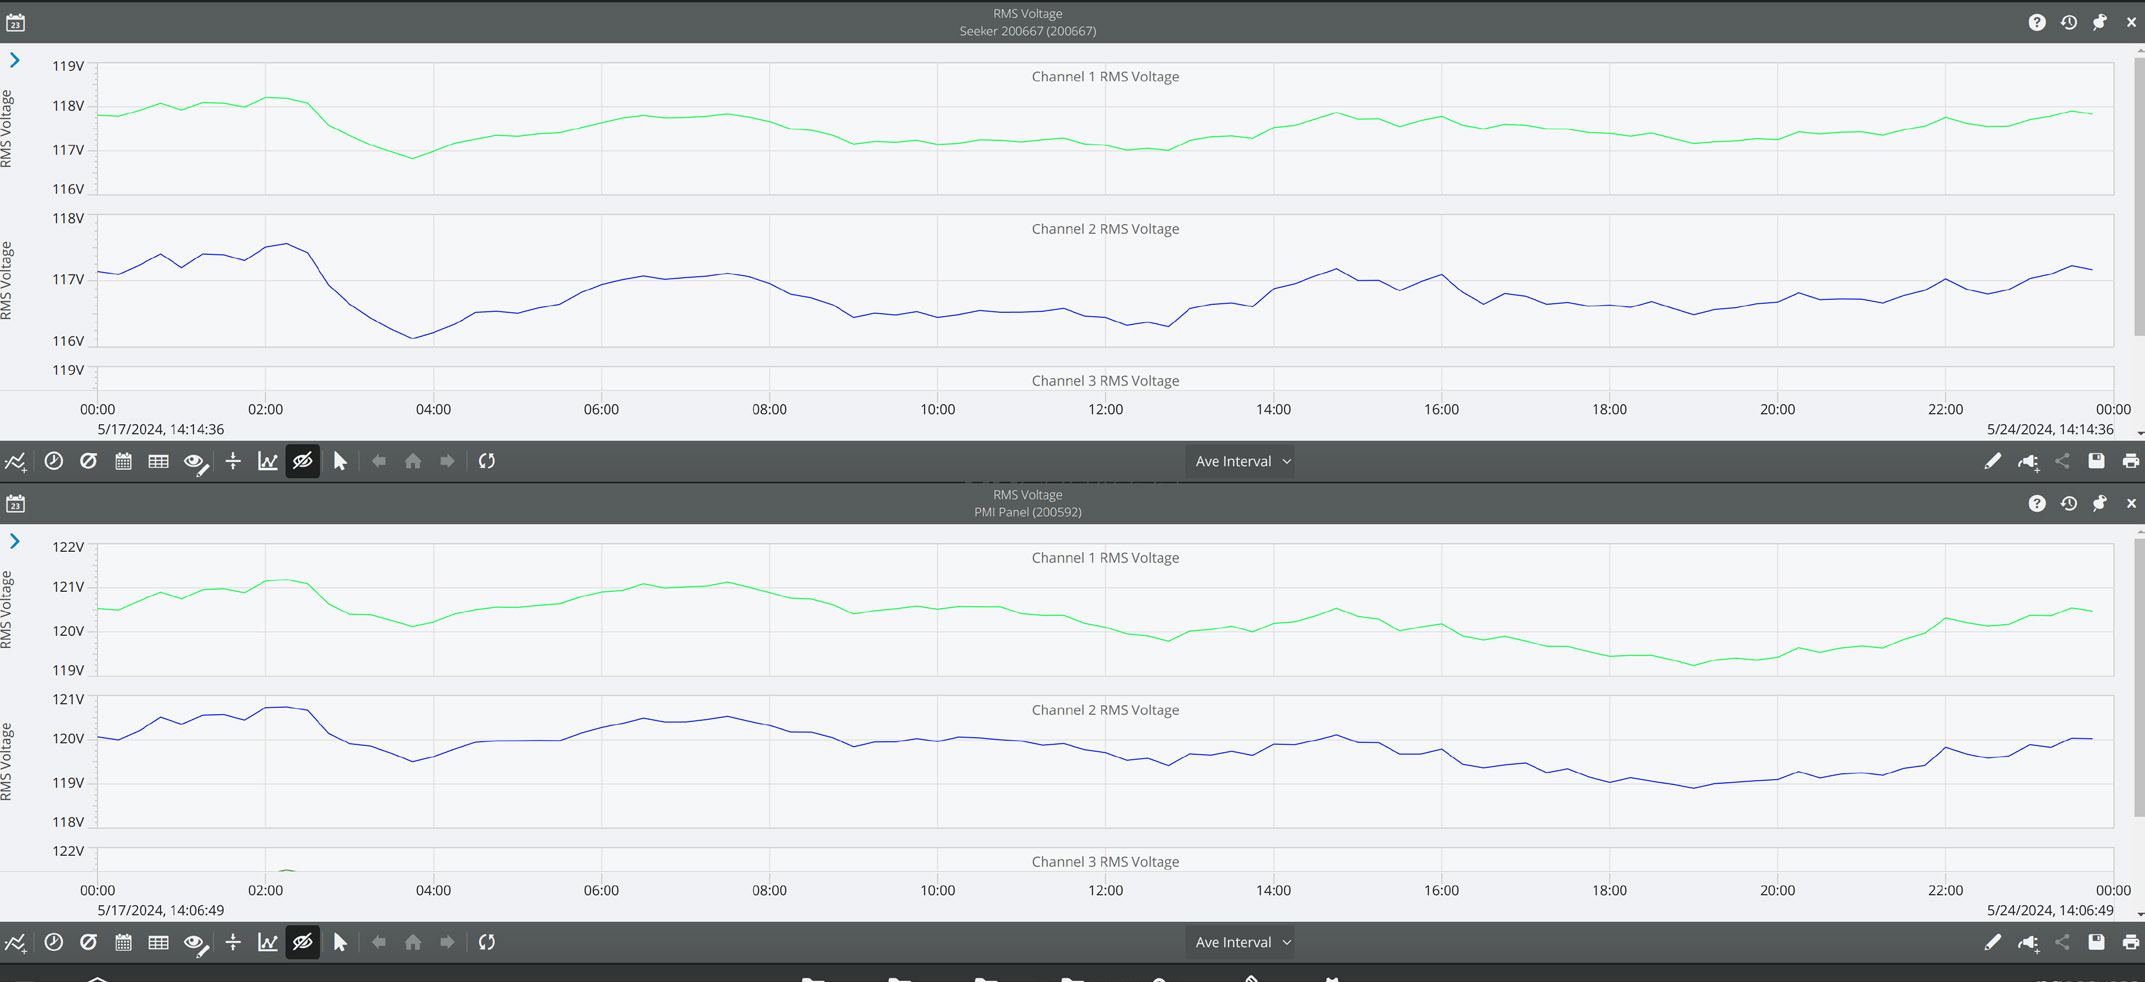
If the utility’s customer has a PQ Canvass enabled recorder, a side-by-side view of the utilization voltage (measured at the customer’s equipment) and the service voltage can be viewed. Any drops between the service voltage and utilization voltage are likely the result of loads within the customer’s facility.
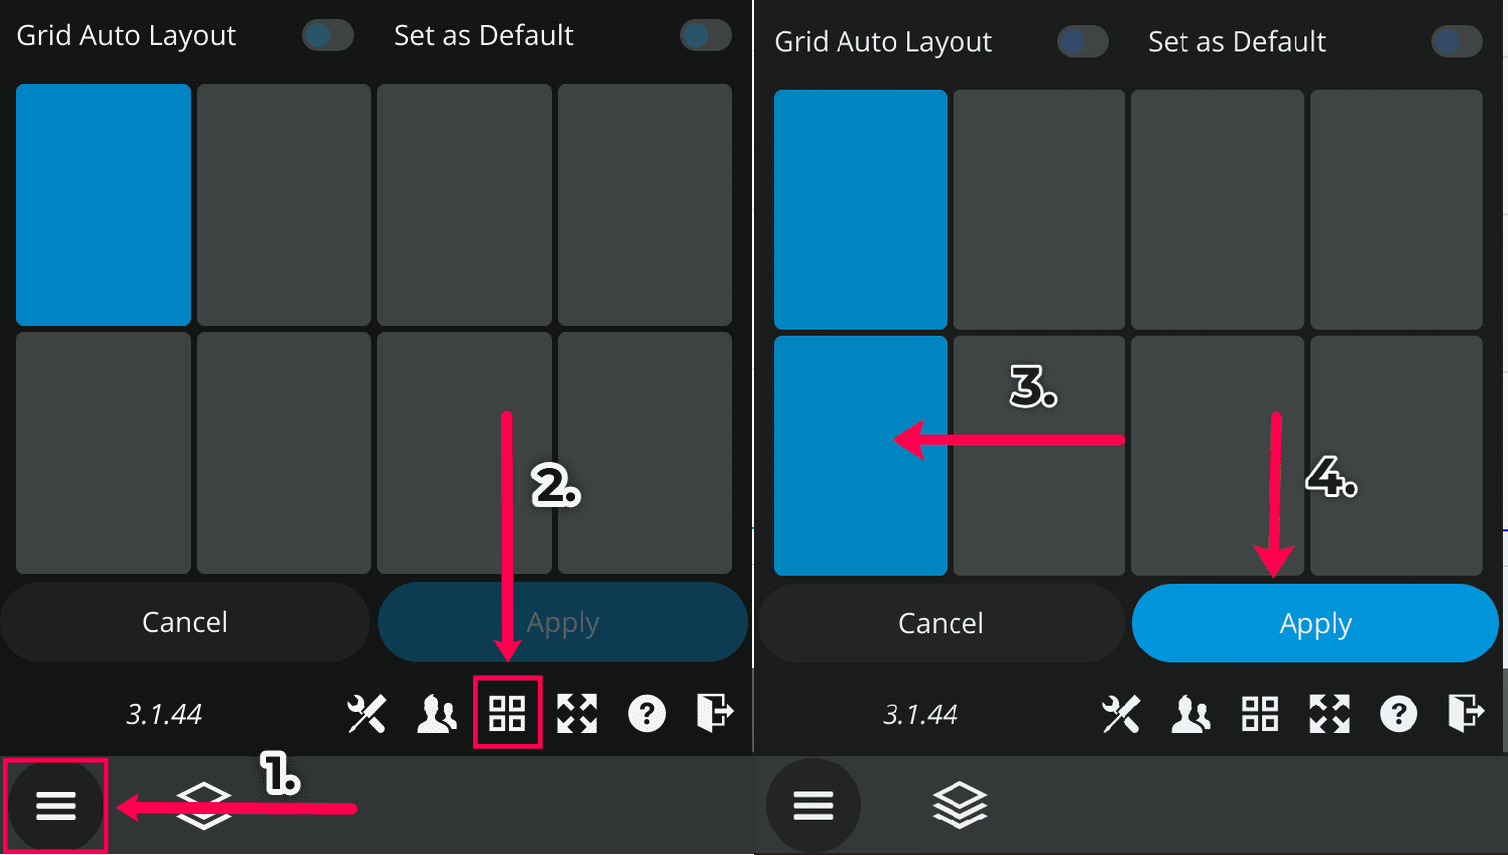
To see these side-by-side graphs, select the Menu icon in the bottom left corner of the screen, then the grid button found within. You can then choose how many different views you want active at once. For the purpose of this example, select the cell beneath the blue cell and click “Apply” to get a side by side view.
From here, follow the same instructions as before to navigate to the Daily Profile Graphs of the second device. You’ll now have a side by side comparison of your service voltage and utilization voltage.
Daily Profile Graphs
Daily Profile Graphs provide a high-level overview of a device’s readings by averaging data over 15-minute intervals across a user-defined period of time, typically one week. This is ideal, since voltage regulation is a steady state issue that plays out over longer time periods. Focusing on short duration events, while important, may distract from the steady state issues you’re trying to resolve.
Tip: You can show the standard deviation of the intervals by selecting the sigma “σ” icon in the bottom left of the toolbar. This feature lets you see how much variation there is between days for the same 15 minute bin.
To begin, navigate to the Devices Page by selecting the Devices icon at the bottom of the home page.

Next, select your device. This will bring up your device Quick Access View. In the top right corner of the menu will be a button labeled “Graphs”. Select this then “Daily Profile”.
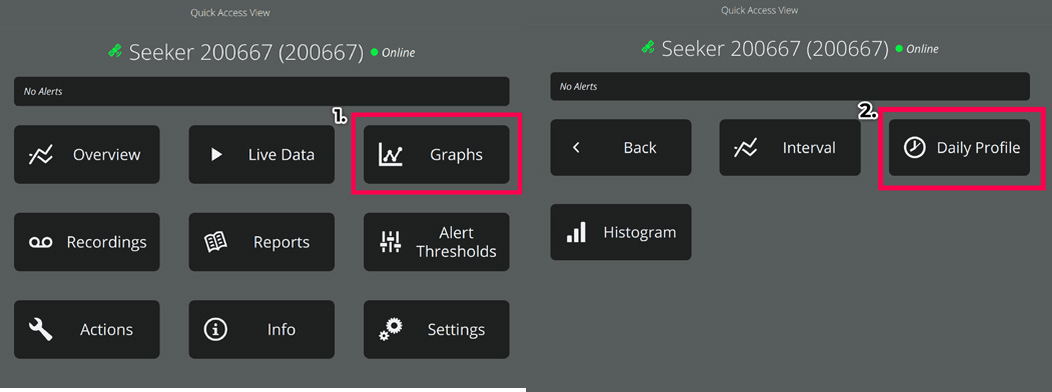
Next, select “RMS Voltage”. Once the graph finishes loading, you will see a 24-hour view of the device’s RMS Voltage, with each point representing the average value of a 15-minute interval over the past week.
Alert Thresholds
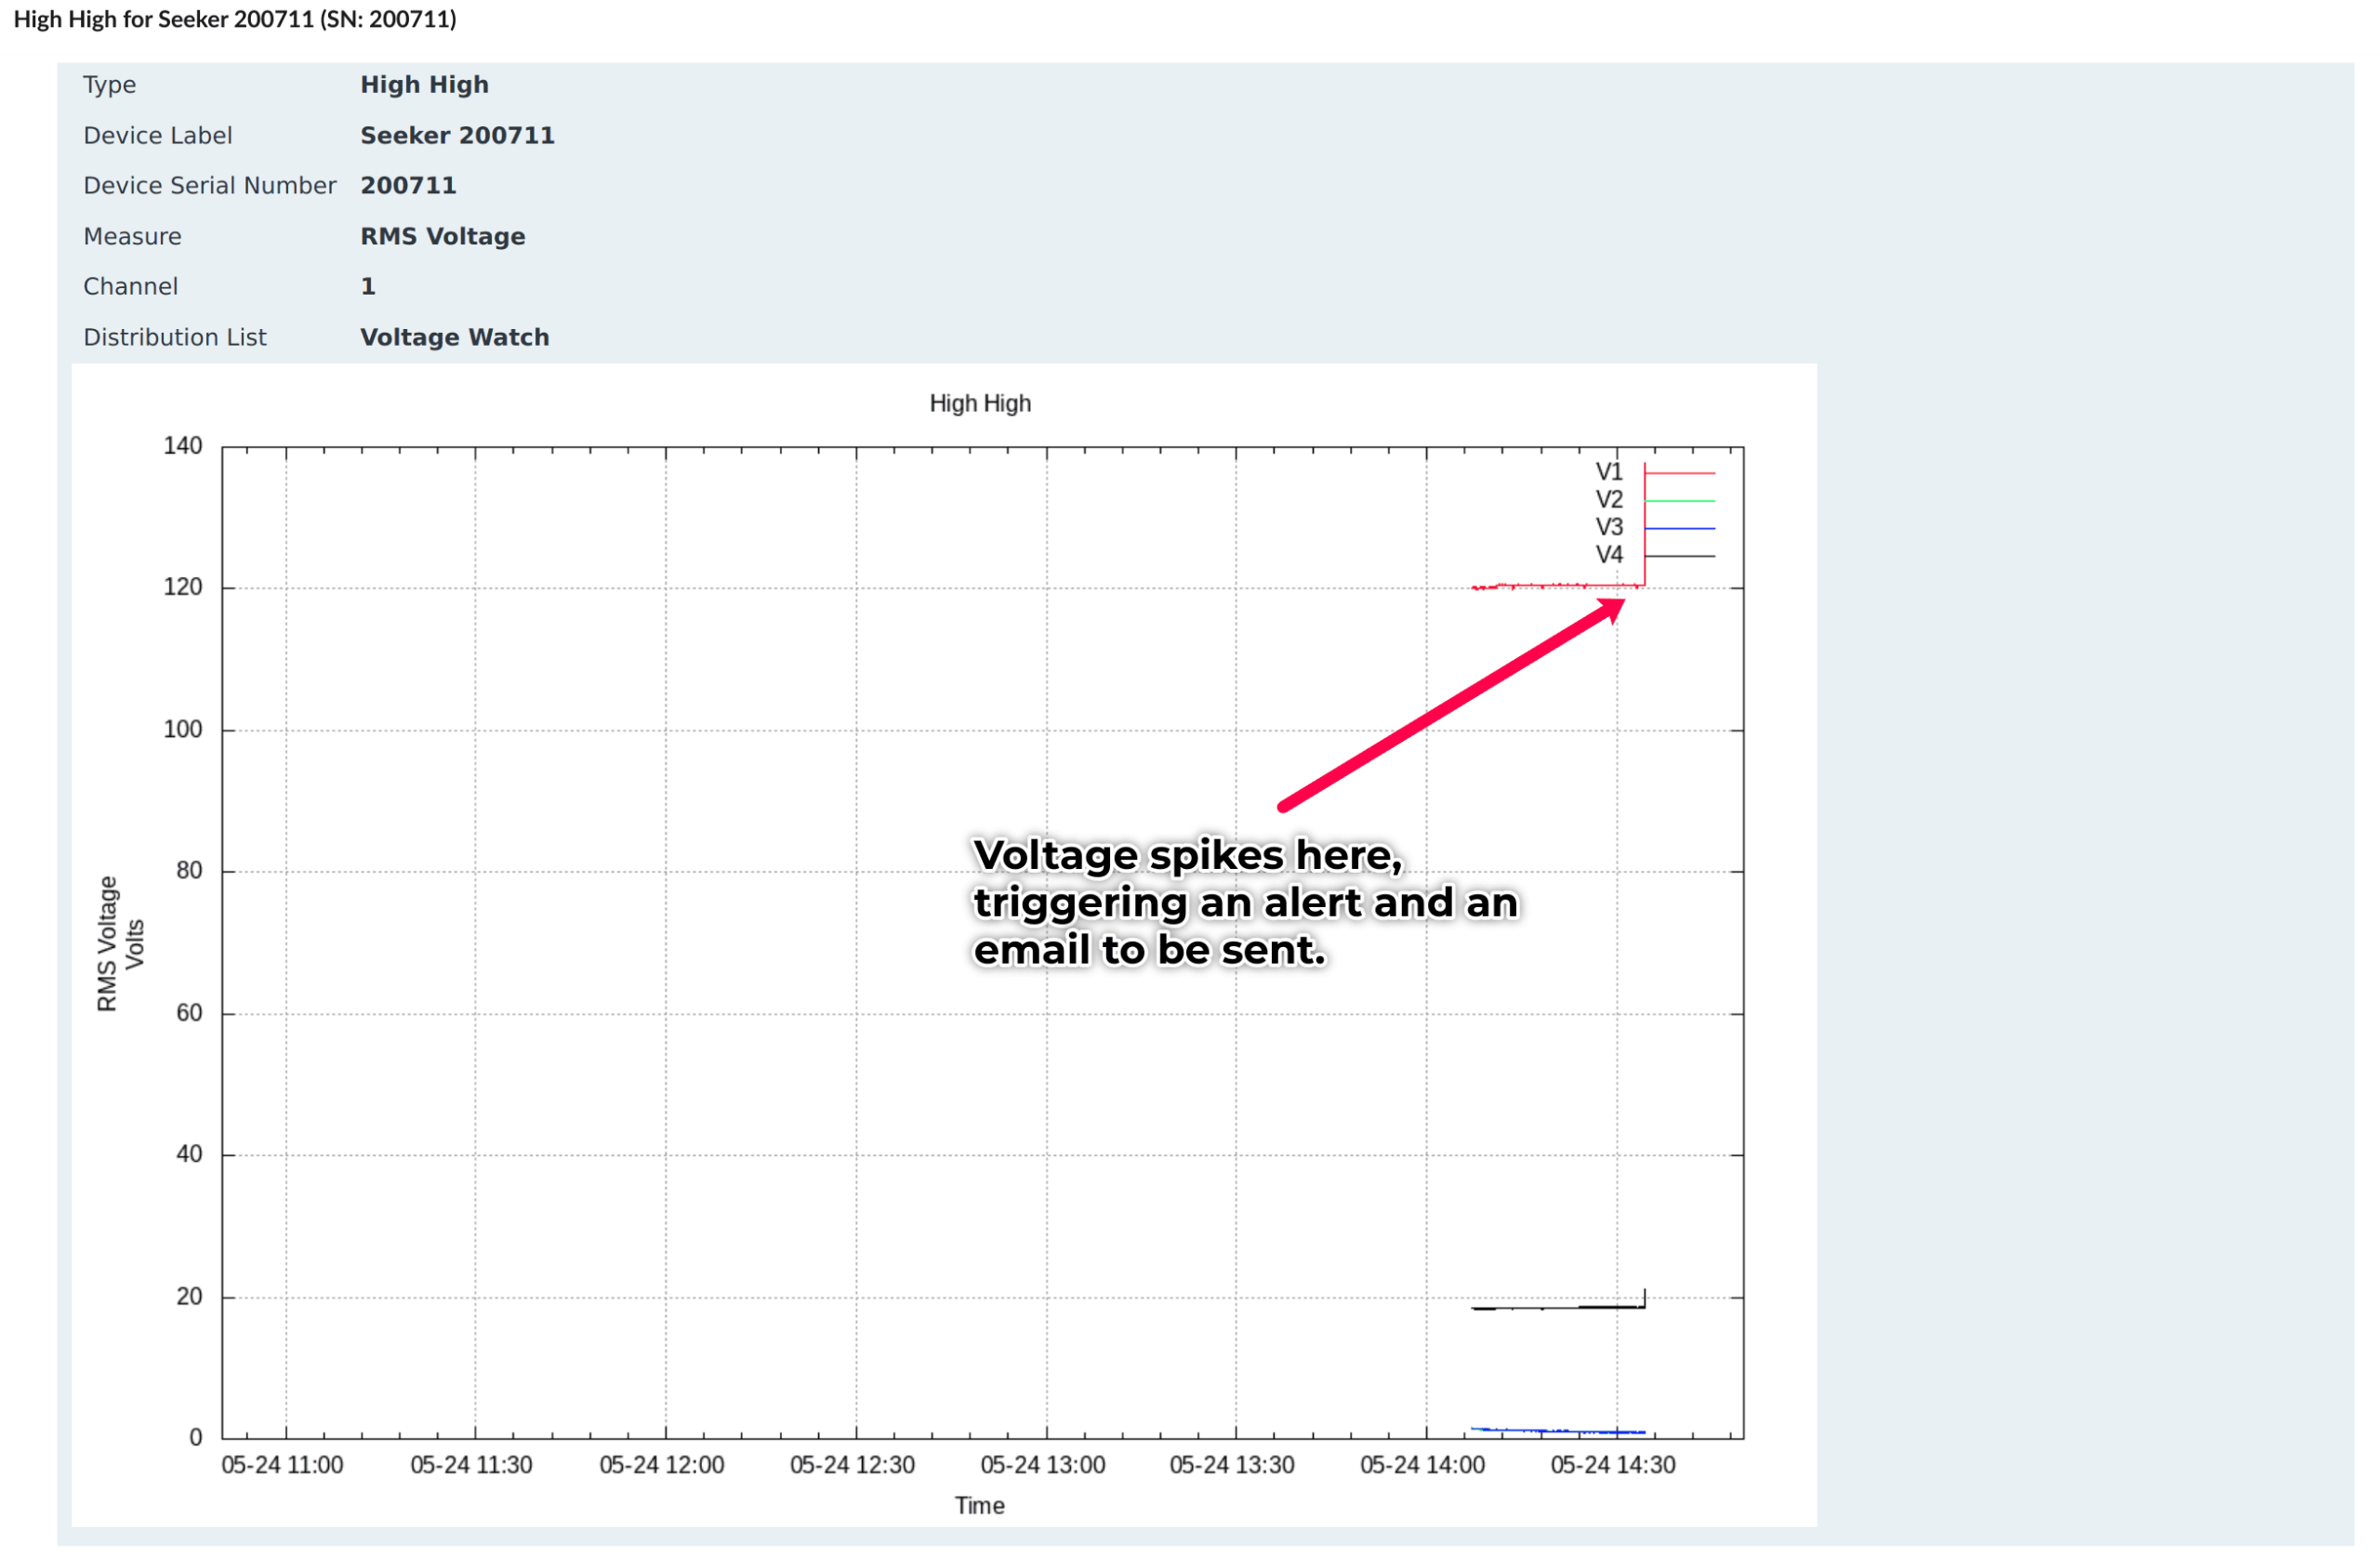
Alert thresholds let a user (or even multiple users) receive SMS and/or email notifications when a device’s measurements go above or below a set level. For example, you can get alerts if a device’s readings fall outside of Range A or Range B thresholds. In this example, we’ll show you how to set thresholds specifically for Range B.
Select a device in the device list, then select the “Alert Thresholds” option. Here you can set thresholds for a number of measures, but only voltage is relevant in this particular case.
Assuming a nominal of 120V, the high should be set to 127.2 (+6%). The low should be set to 104.4 (-13%). The holdoff time could be set to 5, 10 or 15 seconds, ensuring that quick one second fluctuations don’t trip any alert. When finished, press “Set Thresholds” at the bottom of the page.
In order to start receiving text messages or emails, you will need to configure your account to permit it.
- While at the home page, go to settings (represented by the gear icon).
- Next, select “Contact”.
- Add a new email address and/or phone number. (You may skip this if the desired contact information is already present.)
- Go back, and select “Notifications”.
- Create a new Notification entry.
- Aggregate: This option accumulates alert messages and sends them as a single email once the specified time interval (in minutes) has elapsed.
- Holdoff: This option delays the triggering of an email alert to see if the issue resolves itself within the specified time frame. For example, if a threshold is reached for one minute but the holdoff is set to three minutes, no email will be sent if the alert condition resolves within those three minutes.
- Select the newly created entry.
- Select the devices you wish to receive alerts from, as well as which users should receive those alerts. You will want to make sure the user you select has contact information filled out. (See step 3)
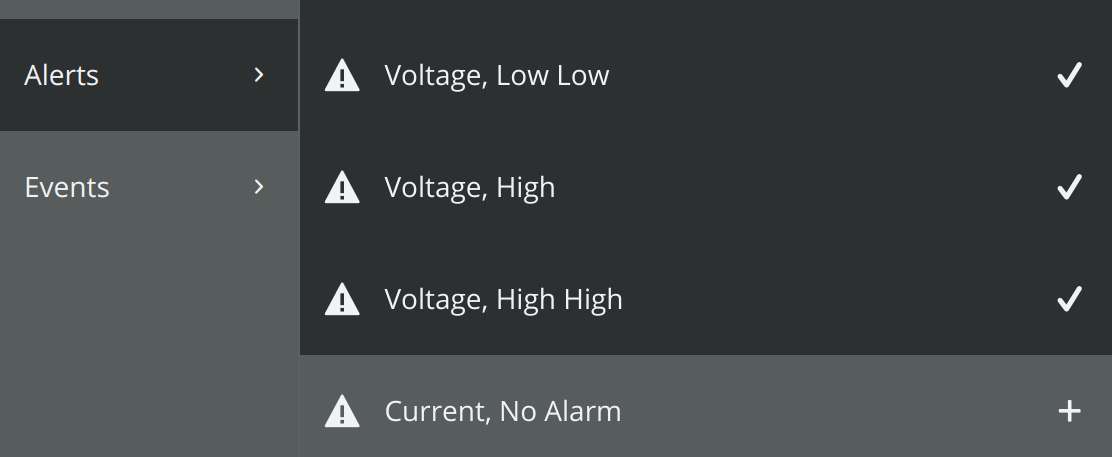
You must also ensure the right alerts are selected. In our example we set alerts for Voltage thresholds.
Conclusion
PQ Canvass advances beyond its predecessor by enriching its graphing and user interface capabilities. It simplifies voltage regulation analysis through configurable visualization tools, making daily and historical data review more accessible. Additionally, the platform maintains essential alerting features, allowing for timely notifications. This blend of enhancements makes PQ Canvass a valuable tool for utilities focused on maintaining high standards of power distribution.