
Abstract
Notching is a voltage waveform distortion resulting from short-duration high current pulses. These distortions typically present themselves graphically as a “notch” in the time domain representation of the waveform. The IEEE 519-2014 standard, which deals with harmonics includes an appendix (IEEE Std 519, Appendix C) that provides a table of maximum notch depth (measured as a percentage of measured voltage) and notch area. (See White Paper 198 for information on calculating notch area using ProVision). This whitepaper is going to discuss some notching scenarios and will present some measurements and calculations for helping a utility better understand this phenomenon.
IEEE 519
The IEEE 519 standard, IEEE Recommended Practice and Requirements for Harmonic Control in Electric Power Systems, mainly discusses waveform distortion in terms of harmonics. Notching, while a type of waveform distortion, is more commonly analyzed in the time domain, rather than the frequency domain. As mentioned above, waveform notching is covered in its very own, dedicated section in IEEE 519. Unfortunately, this is a single page appendix, without much discussion. There is also no information connecting notch distortion back to harmonics.
While the standard’s coverage may be sparse, there is still some good information that can be gleaned from the table (Table C-1 in the IEEE Std 519 document, for reference).
To begin with, the standard defines three relatively broad categories into which their recommended limits fall: “Special Applications” (airports and hospitals are given as examples); “General Systems”; and “Dedicated Systems” (a system exclusively providing power for a specific user or load). Each of these three categories is given a pair of recommended limits for notch depth (as a percentage of voltage) and notch area (see white paper 198 for information on calculating notch area using ProVision). Using these recommendations, some observations can be made.
Observations
The first observation is that the notching causes a deviation from an ideal sine wave. Since the deviation is roughly constant from cycle to cycle, it may be analyzed with harmonics. Detecting and quantifying voltage notching in the time domain requires a waveform capture, which may not be available in all recordings. By analyzing notching with harmonics, metrics such as total harmonic distortion may be used to detect the possibility of notching. To do this, the correlation between notching distortion and harmonics must be determined.
In order to get a handle on just what that correlation may be, a series of simulations were run in order to examine the link between notch width, notch depth and total harmonic distortion (THD). To start, a “pure” sine wave with a magnitude of 120Vrms was generated:
Mrms × sin(2πft)
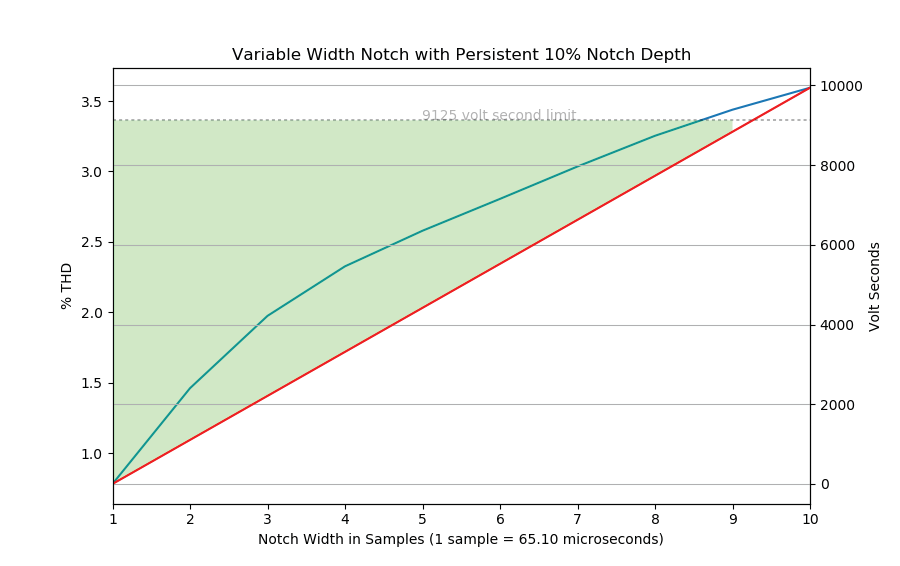
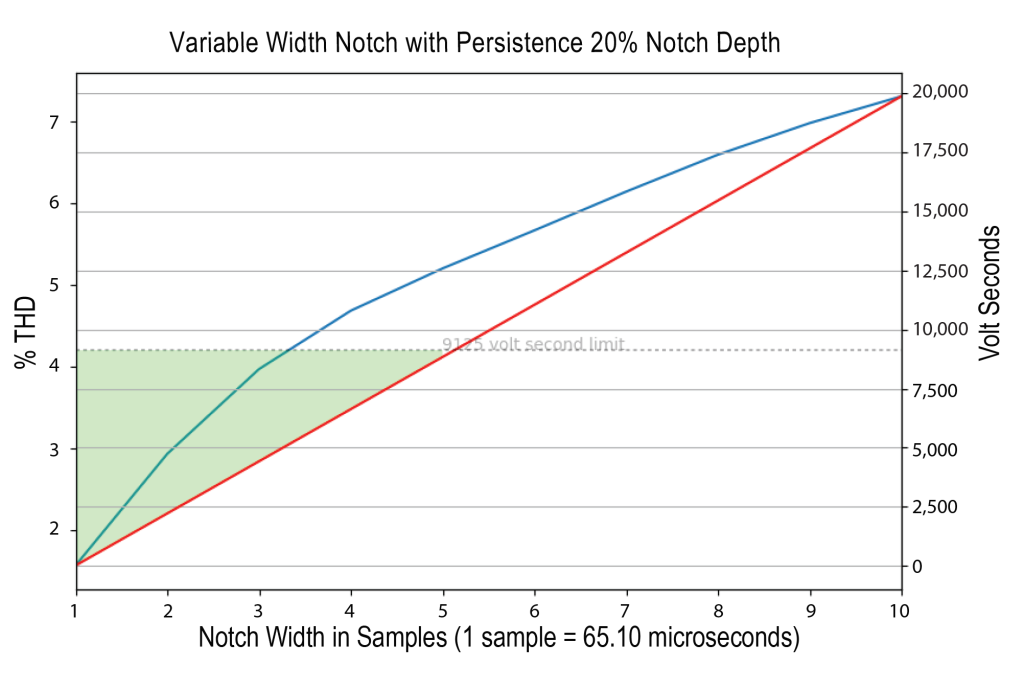
where Mrms is the magnitude of the voltage in RMS. Then each peak in the cycle was modified by a persistent notch at 10%, 20% and 50% while the notch width was varied (between 1 and 10 milliseconds). For each variation, the THD and notch area were calculated and plotted. Figures 1 through 6 below show these combinations as well as the time domain graph of the waveform representing the maximum recommended notch area as per IEEE 519.
[Note: The sampling rate and frequency used for generating the pure sine wave were 256 samples at a 60.0Hz frequency.]
Interpretations
In Figures 1, 3 and 5, the maximum notch depth was fixed while the notch width (expressed in samples where 1 sample = 65.1 microseconds, the normal waveform capture rate in PMI recorders) was varied in order to determine the variance in THD and notch area as the width expanded. The left y-axis for each of those figures (1, 3, 5) is the THD percentage while the right y-axis shows the notch area in volt-seconds. The recommended limits in notch area vary based on system type (special application, general system or dedicated system) as do the notch depth. These graphs are representative of the maximum allowance for each recommended system.
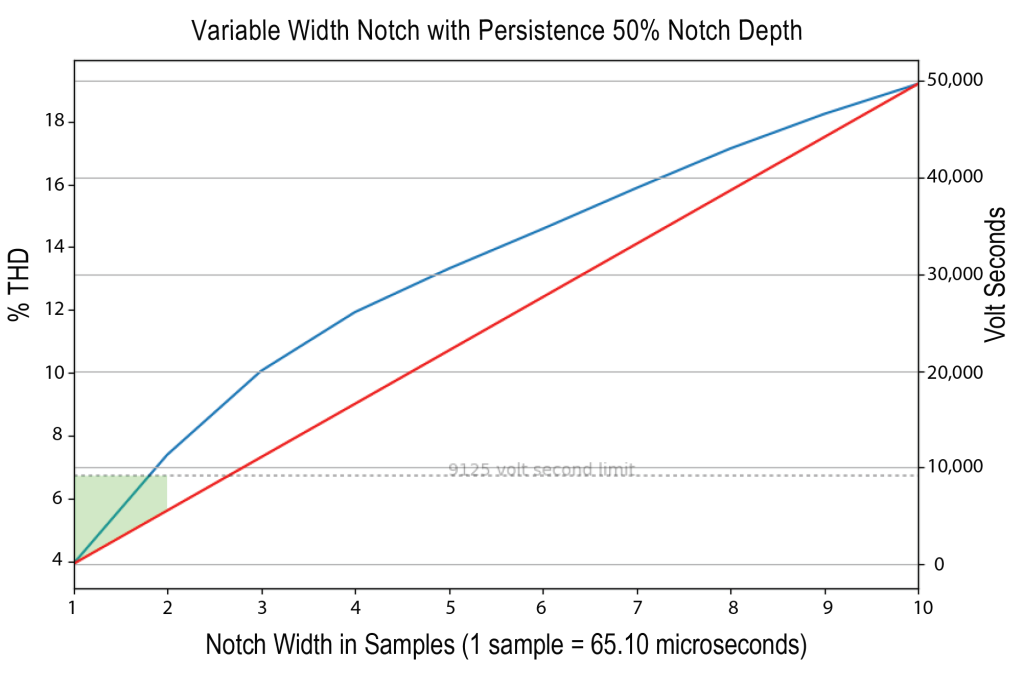
The green shaded region in Figures 1, 3 and 5 represents the “tolerable” zone – the region in which the IEEE Std 519 notch standard is not exceeded. Note again, that this region was generated assuming the maximum notch depth at each system type (10%, 20% and 50%) while the notch width was varied. An important observation from Figures 1, 3 and 5 is that the THD starts relatively low for small notch widths (1-2%), but climbs quickly as the width increases. Notches outside the IEEE volt-second limit are at least 3.5% THD for a 10% depth, and rises quickly for 20% depth and greater. These THD values are more often associated with traditional harmonic problems, but in this case the root cause is much different.
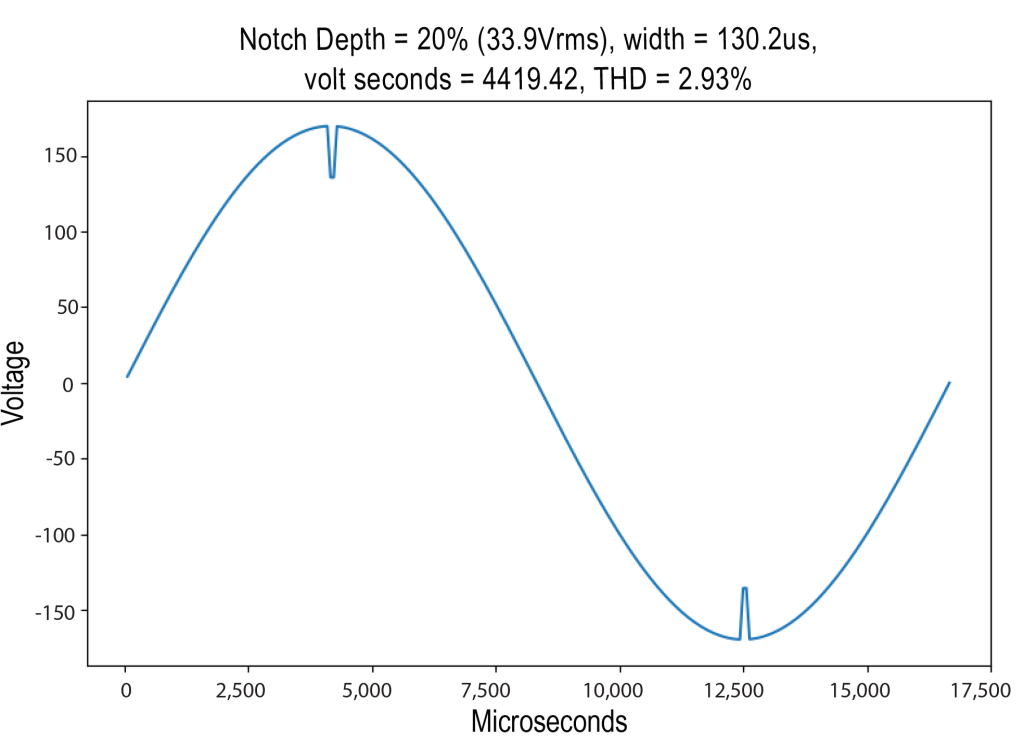
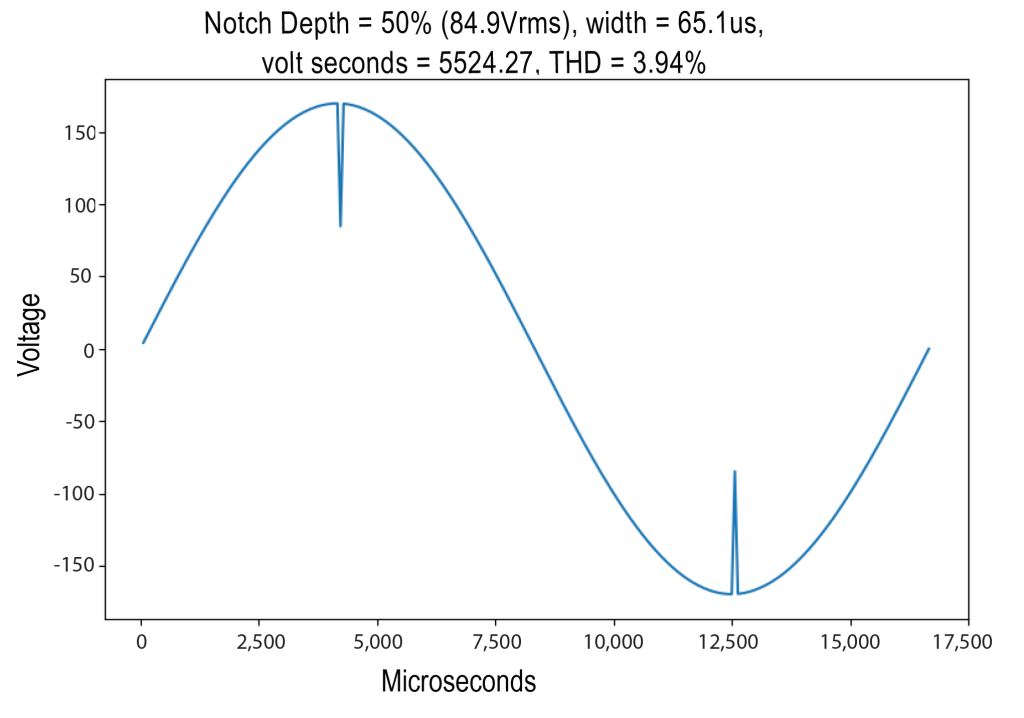
Figures 2, 4 and 6 are time domain graphs of the waveforms generated from the maximum depth and notch area for each recommended system type. A quick glance at these figures and the notching is readily apparent. The statistics at the top of each of these figures present the notch depth (in percentage and in actual RMS Volts), the notch width (in microseconds), the notch area (in volt-seconds) and the total harmonic distortion (THD) in percent.
Perhaps the most apparent observation to be made by looking at the time domain figures (2, 4 and 6) is that the width is short (meaning a very narrow notch width) while the THD figures are elevated – at a 20% notch depth, the THD is almost 3%. That’s at a notch width of 130 microseconds (or just 2 samples, with a sample rate of 256 samples per cycle or 15360 samples per second). Finally, at 50% notch depth, it takes just 65.1 microseconds (a single, solitary sample) to reach the notch area limit (for “Dedicated Systems”) with a THD at just under 4%.
Harmonic Composition
The primary harmonic frequencies present in a notched waveform are dominated by the 11th and below (odd-only). Because the notch is equal in the upper and lower halves of the sine wave, there are no even harmonics. Figure 7 is a three-dimensional representation of the harmonic composition of a waveform whose notch depth is fixed at 5% of nominal voltage and whose notch width is varied from 0 to ~4000us.
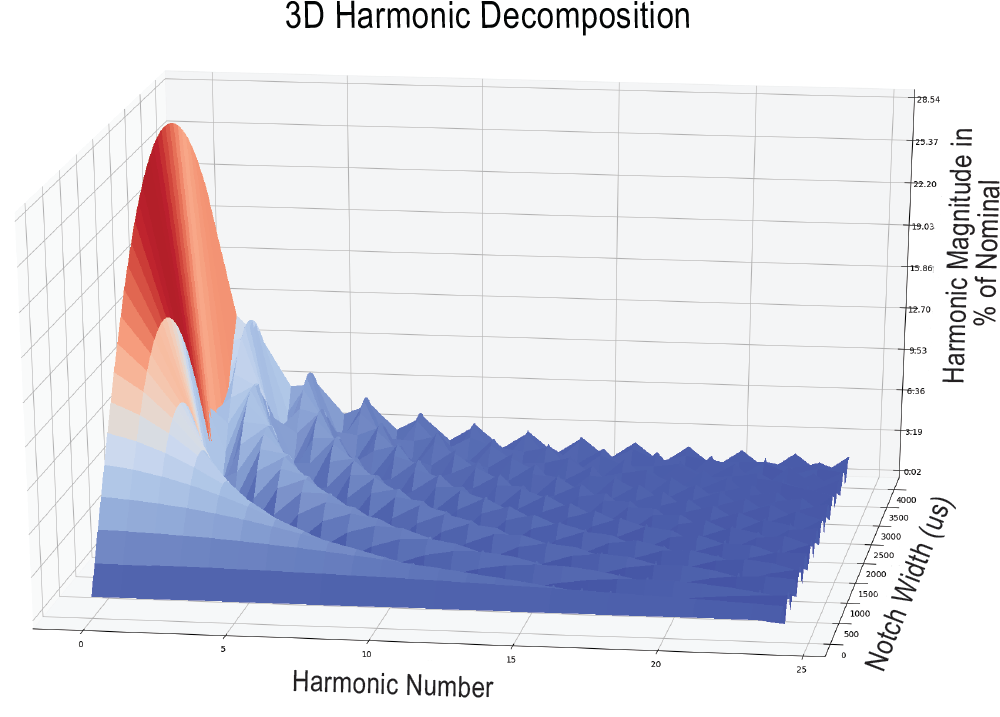
What can be seen in this graph is that the harmonic magnitudes – even at great depth – fall off pretty sharply as they approach higher harmonic numbers. It’s also apparent how rapidly the magnitudes increase with an increase in notch-width. Intuitively, as the notch width increases, the lower frequency harmonics become even more pronounced – a wide notch is a slow (= lower frequency) notch. The higher harmonics are caused more by the rise and fall times of the notch edges.
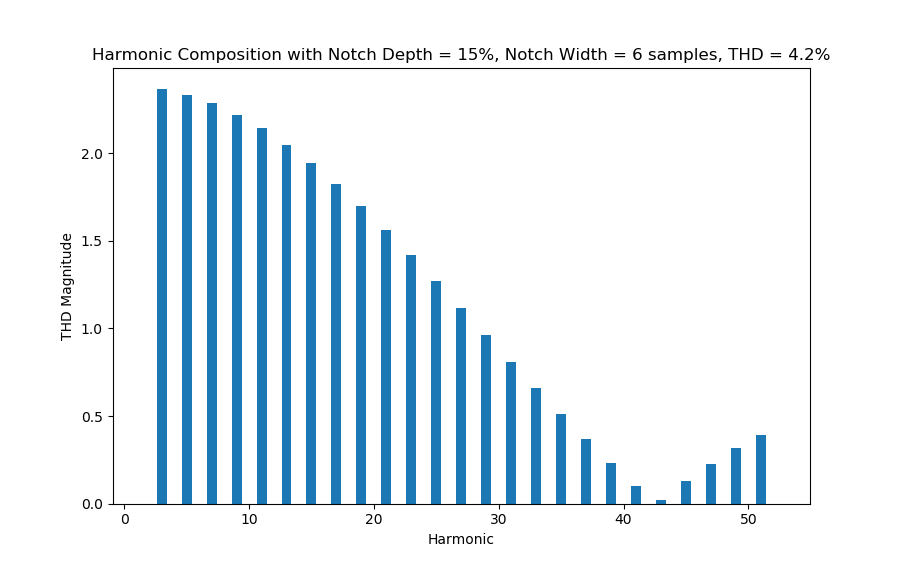
Another useful figure is Figure 8 which depicts the harmonic composition as a two-dimensional graph for a waveform that exhibits 15% notch depth and a 6 sample (~391 microsecond) notch width. As can be seen in the graph, there is no single harmonic that dominates. A notch, while simple and distinct in the time domain, is a broadband phenomenon in the frequency domain, covering a broad range of harmonics. This pattern is very different from traditional harmonic sources such as capacitor bank resonances, electronic power supplies, or VFD controllers.
Not a Traditional Harmonic Issue
While waveform notching will present a high Total Harmonic Distortion, the remedies are not the same as for traditional harmonic problems. A common source of notching is VFD (Variable Frequency Drive) commutation in which the phase pair transition isn’t on a clean boundary (there is a marginal overlap). This will present as very large spikes in a THD stripchart that may have a duration of several seconds or even a little over a minute, or much longer if the switching overlap is sustained. In this situation, the traditional VFD harmonic pattern (e.g. 5th and 7th, 11th and 13th harmonics) will be combined with the broad notching spectrum.
Since notching creates a broadband harmonic pattern, a harmonic filter tuned to a specific harmonic will not mitigate the problem. A series reactor can reduce current changes at the notch edges, and thus slow the rise/fall times of the notch. This will reduce high-frequency harmonics, but may leave the lower order harmonics mostly unchanged.
A high voltage THD could indicate traditional harmonic problems or waveform notching. If a waveform has been captured, analyzing the waveform during the period of high THD will distinguish notching from “regular” harmonics. If there is no waveform available, but harmonic data available, a broadband spread over many odd harmonics can indicate notching. If neither is available in the recording, a follow-up recording may be needed to pin down the problem.
Detecting Waveform Notching
Waveform notching generates a relatively high total harmonic distortion (depending on notch width and depth). In order to find scenarios in which notching may be occurring (and in which the notch area or notch depth exceed the IEEE Std 519 limits), triggered or periodic waveform capture with a Revolution or Guardian may be used.
With triggered waveform capture, a user can specify a THD threshold (for example 2%) at which the individual waveform (as well as a series of pre- and post-cycle captures (user configurable)) will be recorded. The periodic waveform capture will force the recording of a waveform sample (with pre- and post-cycles) at a regular, periodic interval (5 minutes, for example).
Both methods of waveform capture have their merits, but the triggered waveform capture is certainly preferable in this particular case. By only triggering on waveforms with minimum change in THD the user is much more likely to capture the offending waveforms and at the same time will eliminate potentially “harmless” or “clean” captures.
Remembering that a 10% notch depth at just 5 samples will generate a THD of ~2.5% it is recommended that a threshold of 2% be used to capture waveforms that exhibit notching. If notching is sustained, periodic waveform capture may also be used.
Conclusion
Waveform notching can be a tricky phenomenon to identify without a good waveform capture. Assuming a high voltage THD indicates an underlying harmonic problem may result in missed notching problems. Although nonlinear loads such as VFDs and switching power supplies generate harmonics that can increase THD, the mitigation for these is much different than high THD from notching. Keeping in mind the similarities and differences in these two causes of high THD can prove useful in successfully finding and mitigating waveform notching power quality disturbances.