
Abstract
This whitepaper will discuss what vector diagrams are, what they display, and how PMI’s power quality recorders and ProVision can provide the user with this information.
The Vector Diagram
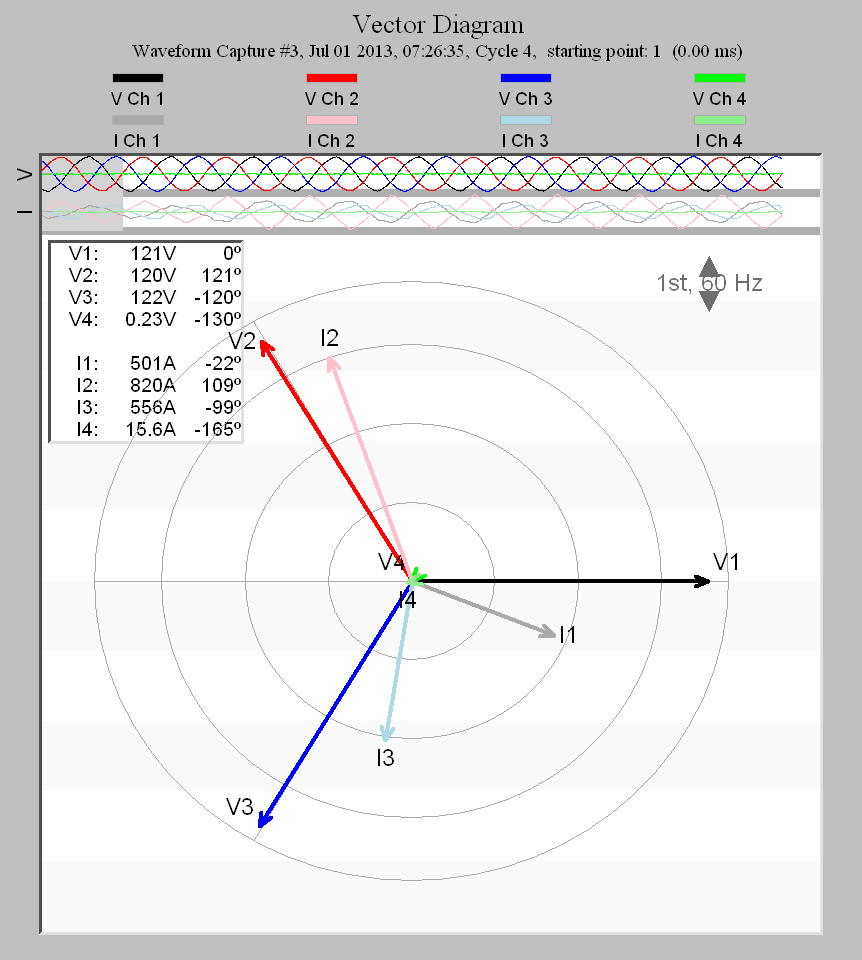
The Vector Diagram, as shown in Figure 1, allows a user to graphically represent the magnitudes of current and voltage along with their phase angles. The main use of the Vector Diagram is to show the phase shift between the current and the voltage. In an AC circuit, the voltage and current do not peak at the same time if the load is not purely resistive but has a capacitor or inductor involved.
A sine wave as a function of time t can be described by three variables: frequency F, amplitude A, and phase Θ:
x(t) = A SIN(2ΘFt + Θ)
For a fixed frequency (normally 60Hz), the only two free variables are the amplitude and phase. For a pure sine wave, the amplitude is related to the RMS value by the familiar sqrt(2) factor: RMS x 1.41 = A. The phase represents the shift in time referenced to some absolute time, or relative to another sine wave. Generally, voltage phase A (or the channel 1 voltage input of a PMI recorder) is considered the reference, and all other channels are with respect to it. Consequently, the voltage channel 1 phase angle should normally be zero.
A vector on the vector diagram represents a sine wave, and serves as an easy way to visualize the amplitude and phase of several sine waves, compared with looking at the raw sinusoids.
Figure 2 shows the voltage ‘V’ leading the current ‘I’ in phase by angle φ. The difference between the two peaks, which is a fraction of a period, is called the phase difference (which becomes a negative phase for a capacitive circuit since the current leads the voltage and becomes a positive phase for an inductive circuit since the current lags behind the voltage).
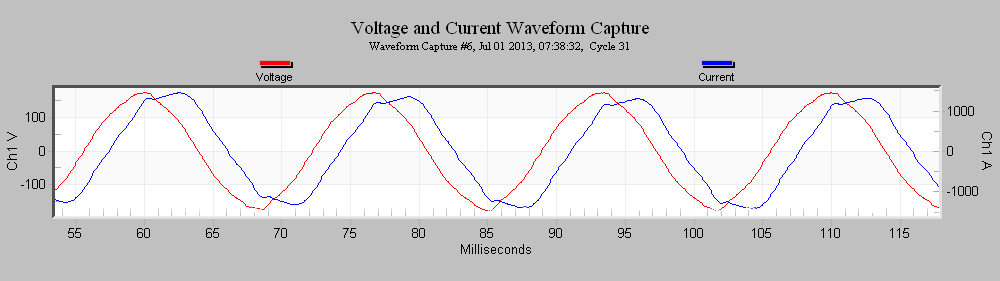
The length of the vector is proportional to the RMS value of the sine wave, while the vector’s angle represents the phase of the sine wave (with respect to voltage channel 1). Since a sine wave repeats every cycle, and 360 degrees spans a full period of a sine wave, a circular vector graph is sufficient to view all the voltage and current vectors.
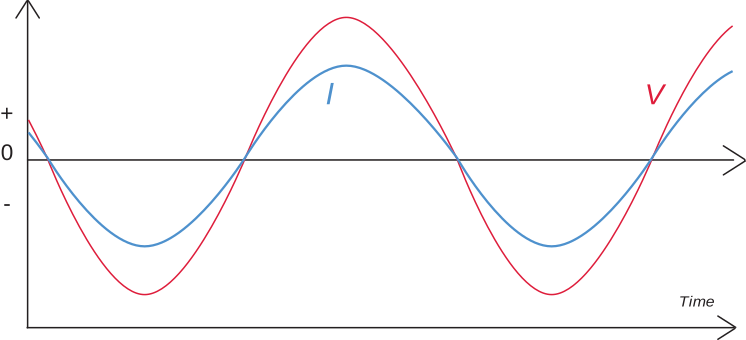
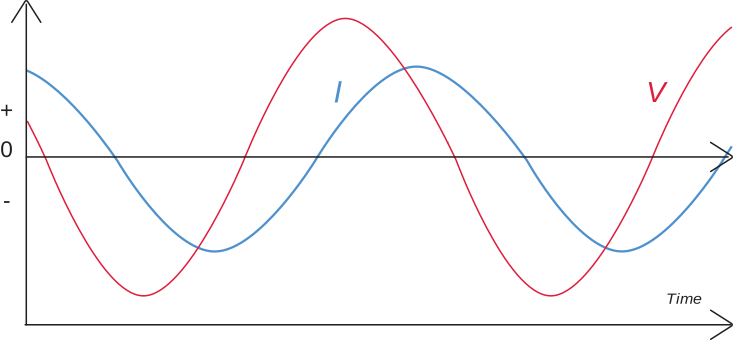
Typically, the voltage vectors for each phase of a 3-phase wye circuit will be located at 0, 120, and 240 degrees as in vector diagram in Figure 1. Ideally the current vectors are very close to the voltage ones (if they’re not, that implies a worse power factor – PF=1.00 = no phase shift). In a 3-phase delta, the currents are shifted 30 degrees. In a single-phase system, the two voltage channels are 180 degrees out of phase. The phase current vectors will be leading, in-phase with (Figure 3), or lagging (Figure 4) the corresponding voltage vectors depending on the impedance in each phase.
Vector Diagrams in ProVision
ProVision can be used to view Vector Diagrams real time and in captured waveform data. All angles are taken with reference to channel 1 voltage input.
To create a Vector Diagram from captured waveform data, use these steps:
- Choose the recording.
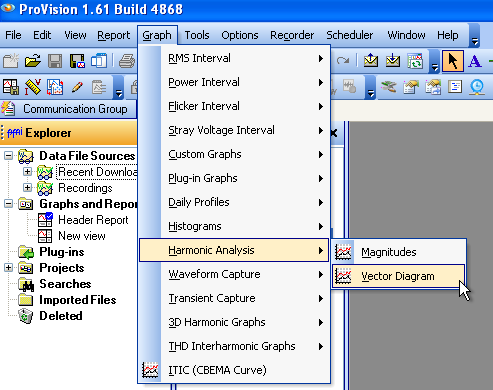
- From the menu click on Graph
- Click on Harmonic Analysis
- Click on Vector Diagram (as shown in Figure 5)
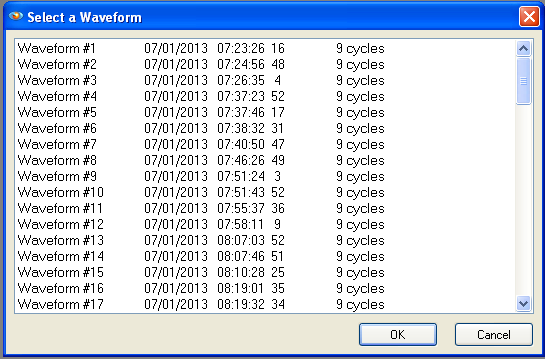
- Choose the waveform to graph from the displayed list (shown in Figure 6)
NOTE: If no recording is selected and a recorder is connected, then the real time graph is displayed.
To create a real time vector diagram, follow these steps:
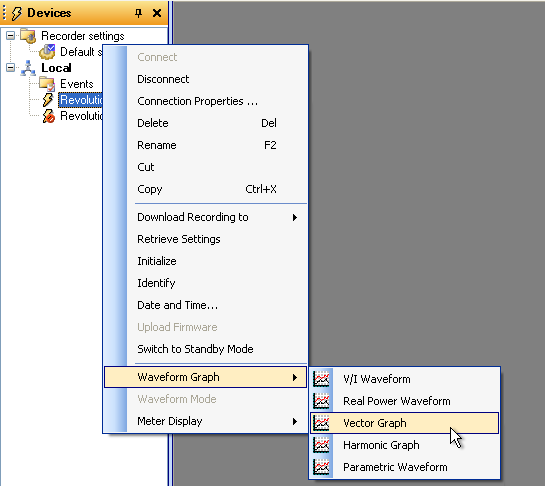
- Right-click on the desired recorder in the Devices view.
- Click on Waveform Graph
- Click on Vector Graph (as shown in Figure 7)
To the top left of the circle are the values of each of the Voltage and Current magnitude and phase readings. You can get a vector diagram breakdown for each harmonic by clicking the up/down arrows in the upper right side. There is a separate set of vectors for each harmonic; ProVision by default shows you the fundamental (1st) harmonic.
When used with recordings, vector diagrams are available for the waveform captures. Often, waveform capture is triggered based on an event like a voltage sag, etc., and the waveform capture includes non-normal cycles. Periodic waveform capture can be enabled, and this allows the capture of “normal” waveforms. To learn more about waveform capture read the white paper on using waveform capture for harmonic analysis available for download by clicking here. For vectors from waveform capture data, you can slide the gray rectangle around in the top window to find a normal-looking cycle. The vector diagram is computed by ProVision from the cycle inside the gray rectangle. This is not available for the real time vector diagram. To see a text report of recorded waveform phase angles, use the Harmonic Analysis Report. The phase angles for the 1st harmonic should correspond to the vector diagram.
To get this report:
- Choose the recording.
- From the menu click on Graph
- Click on Harmonic Analysis
- Click on Magnitudes
- Choose the waveform to graph.
- Right-click on the graph and choose Launch Report
NOTE: The Harmonic Analysis report is not available for real time readings.
The recorder measures voltage line-to-neutral and these values are the ones shown in the Vector Diagram by default. Pressing the “I” key while viewing the graph causes ProVision to calculate and display line-to-line voltage.
Conclusion
The Vector Diagram allows a user to graphically represent the magnitudes of current and voltage along with their phase angles. Vector diagrams are available for waveforms in a recording or can be displayed for real time data. The “I” keyboard shortcut can be used to toggle the Vector Diagram from the default line-to-neutral to line-to-line display. The Harmonic Analysis Report is a text report of the phase angles. Analyzing phase angles is easy using ProVision and one of PMI’s many waveform capturing recorders.