
Abstract
Harmonic distortion that is produced from power conversion systems can cause interference on analog telephone lines. The degree of telephone interference can be expressed in terms of the Telephone Interference Factor (TIF). This white paper will discuss how interference is generated, how TIF is calculated and how PMI’s power quality recorders can provide the user with these measurements.
Telephone Interference
As mentioned above, the TIF is a measure of the potential telephone noise caused by the harmonic distortions from a power system on nearby telephone equipment. It is a dimensionless quantity that depends upon a weighting factor derived from 1960 weighting curve by the Edison Electric Institute (See Figure 1). This weighting factor is weighted heavier on frequencies that tend to cause interference in the audible range and are based on the response of the human ear. The higher the factor the more interference is being generated. Other forms of communication, besides telephones, are also effected.
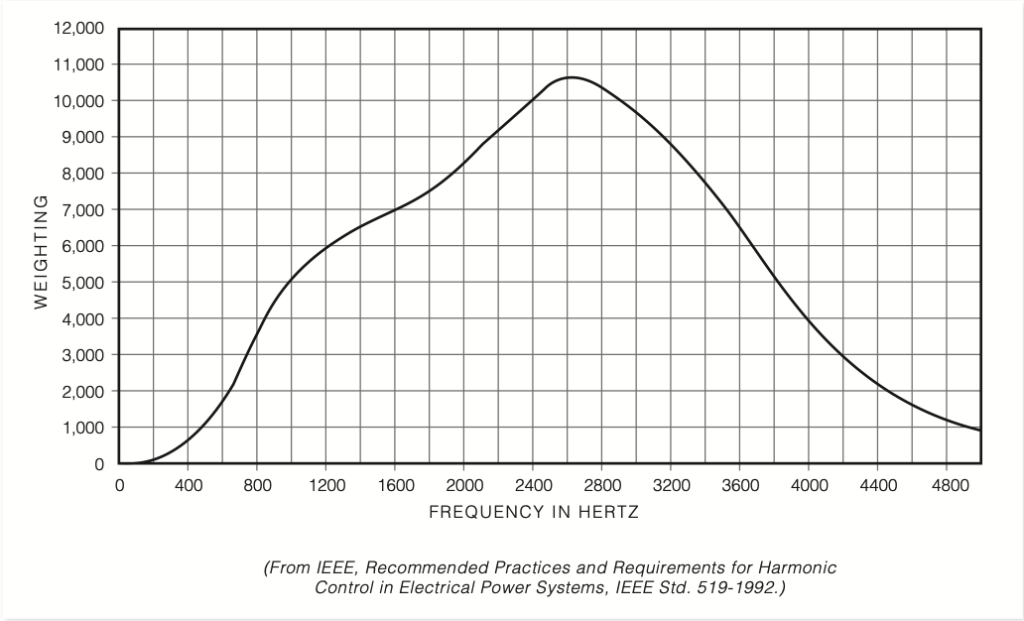
(From IEEE, Recommended Practices and Requirements for Harmonic Control in Electrical Power Systems, IEEE Std. 519-1992.)
The TIF weighting factor was originally developed by placing power lines close to unshielded telephone lines. A group of people were asked to compare the noise, in a telephone receiver, to a buzzing noise and adjust the buzzer so that it was equally disturbing as the noise to be measured. Later this factor was revised and extended to higher frequencies.
Interference on communication lines happen for several reasons. Power stations transmit very high energy and telecom systems transmit much smaller signals. Power and telecom cables are often close together and run in parallel for long distances. Power transmissions produce electric and magnetic fields which can induce noise on the telecom systems communication lines. Several powerline communications systems can cause telephone interference. High current systems like TWACS can inductively couple to telephone lines, but by their nature are more transitory. Slow, narrowband systems like TS2 signals are usually too low to be problem, however, improper grounding at the substation can cause the transmitter voltage signal to be coupled into the telephone system.
Harmonic voltages and currents, especially high frequency harmonics generated by in rotating machinery and adjustable speed drives, can have a serious impact on telecom systems. Distortion in harmonics between 540 Hz (9th harmonic) and 1200 Hz (20th harmonic) are particularly disruptive.
Most of the distortion is produced by the load but power generation can also produce distortion. Voltage TIF can be an issue resulting from the output of a generator or UPS. Some generators have a TIF specification, but often do not. Inverters fed from solar panels, windmills, etc. synthesize a sine wave, and often have harmonic content that can create audio problems through telephone line coupling as well as direct interference through AC powered audio devices.
Telephone interference is often expressed as a product of current and TIF. Since traditional telephone interference was inductively coupled, the current harmonics are usually examined with TIF. Voltage harmonics can also be a problem though, most often due to grounding differences between the telephone and power networks.
Telephone interference was a severe problem in the days of open wire telephone circuits. Now with shielding and twisted pair conductors it is not as much of a problem. Telecom systems design takes into consideration interference and noise and there are mitigating systems that can reduce the effect of the interference.
Reducing interference is a joint effort with the power producers, telecom company, power consumers, and equipment producers.
Calculation
Formula:
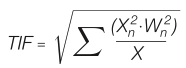
Where:
- X = Total RMS voltage or current
- Xn = Single frequency RMS current or voltage at the frequency corresponding to harmonic order n
- Wn = Single frequency TIF weighting at the frequency corresponding to harmonic order n
ProVision and TIF
TIF is computed by ProVision from the harmonics of captured waveforms. In ProVision, after loading a waveform capture, it’s possible to click on the harmonic toolbar icon to switch to a harmonic analysis of that waveform. It is also possible to go directly to that with Graph, Harmonic Analysis, Magnitudes on the toolbar. Once there (after selecting a waveform capture record), THD will be visible, drawn on the graph.
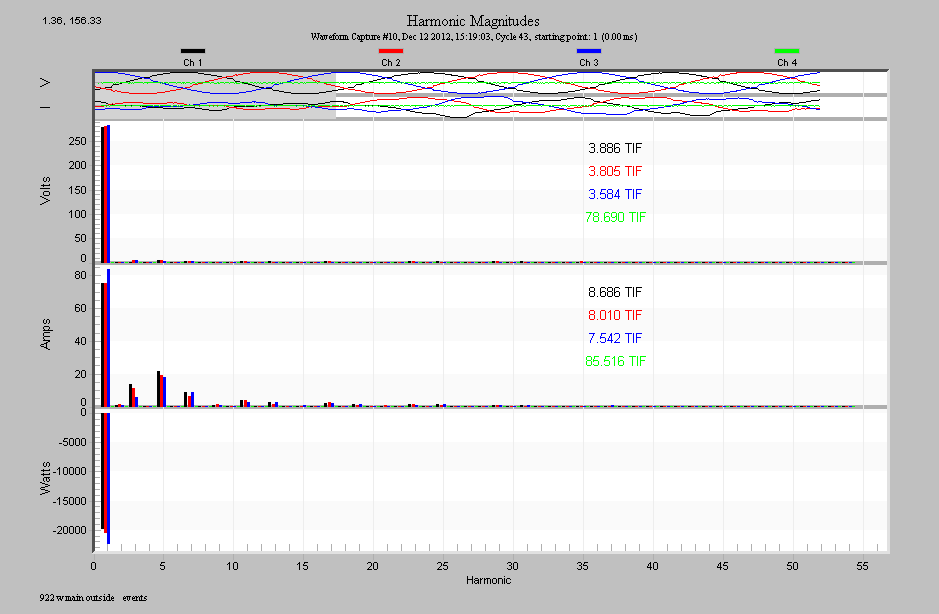
A little known fact is that those graph annotations are clickable. After clicking a few times, it will switch to showing TIF for the displayed waveforms as shown in Figure 2. To select the cycle that is being computed, move the grey cycle in the top trace to select the appropriate cycle.
It’s important to carefully select the cycle that is analyzed. Move the grey box at the top of the graph around to pick a cycle of data from the waveform capture to select a “typical” looking cycle. Often, waveform capture is triggered based on an event like a voltage sag, etc., and the waveform capture includes non-normal cycles. TIF, like harmonics, are a steady-state phenomenon, so it is necessary to select a waveform that is representative of the steady-state wave shape, not one during a PQ event. The very first, and sometimes very last cycles in the capture are often the most representative, due to the pre- and post-cycle parameters with waveform capture.
Alternatively, periodic waveform capture can be enabled, and this allows the capture of “normal” waveforms. To learn more about waveform capture refer to the whitepaper Harmonics from Periodic Waveform Capture.
Conclusion
- Harmonic distortion can have a large effect on communication systems. This effect is known as Telephone Interference Factor (TIF). The factor has been revised during the year as technology changes.
- Interference is often expressed as a product of current and TIF. Other forms of communication, besides telephones, are also effected.
- Reducing interference is a joint effort with the power producers, telecom company, power consumers, and equipment producers.
- Using TIF as a measurement for working with telephone noise is a simple process, especially when using ProVision and one of PMI’s many harmonics-enabled recorders.