
Abstract
In many cases when a local utility customer complains of voltage problems, it can often be traced back to a neighboring electrical load change that has caused voltage dips on connected services through their substation feeders. One of the many utilities using PMI troubleshooting equipment brought to our attention such an incident. Using properly installed power quality monitoring units, they were able to put together a timeline of events that made it possible to clearly identify the causes of voltage dips on low voltage circuits. This case study examines this incident and the investigation of its cause.
Initial Conditions
The utility providing power to the customer site had seen incidents over the year that caused them some concerns about neighboring residents and businesses. They decided to conduct an investigation using a PMI ViP three-phase recorder connected to the customer’s grain elevator 1000kVA transformer and an Eagle 120 recording 120 volts at the neighboring business power outlet. The customer at this business had been complaining about flicker conditions and power interruptions to their incoming service panel.
Review of Evidence
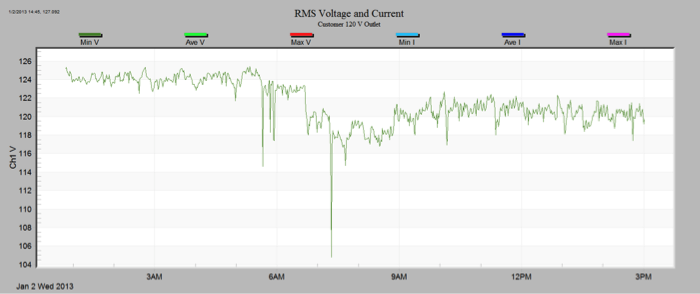
According to evidence gathered at the customer outlet, at approximately 4:40am on January 2, 2013 a momentary voltage sag of 114V was recorded. A second sag was also detected around 6:15am, which measured 105V. Initially after investigating the data recorded from the ViP three-phase recorder located at the Grain Elevator, evidence of a major startup of the grain shipping leg was noted.
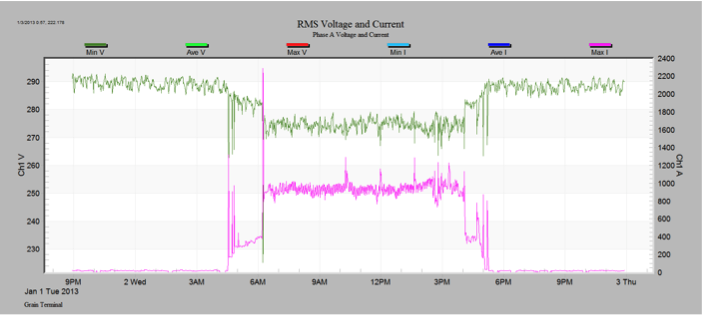
The timing of this sequence was consistent with the recorded data from both the three-phase meter and the 120V outlet. During start-up the current increased sharply, from a nominal low level to around 1300Amps. Approximately 4 hours another significant current inrush was detected, also consistent with a large motor load starting up.
It became clear these waveform events were significant and required further investigation by the utility PQ Group.
Once the data from both recorders had been reviewed by the utility PQ engineers some conclusions were drawn and an explanation of the sequence of events started to emerge. See Figure 1.
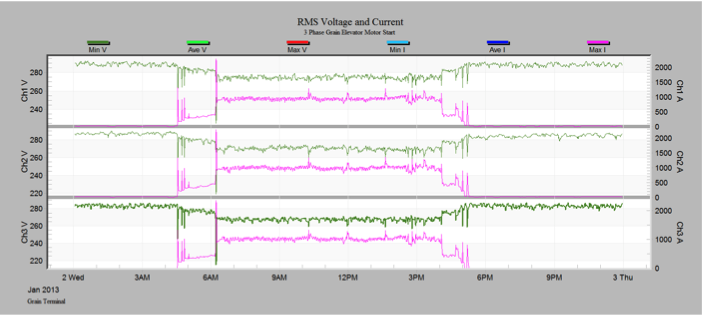
During the grain terminal elevator initialization it is required to engage and control the start-up shipping leg using 2 x 150HP motors. Motor control consoles have the ability to select either “soft start” or “hard start”. Many local utilities will require a customer using over 25HP motors to en- gage the soft start controllers, to avoid any major voltage sag as a result of the large current demand.
Figure 2 shows two initial motor start conditions and the resulting voltage dips along with the current in-rush.
The RMS voltage graph shown in Figure 3 is the result of recording low voltage at 120 volts at the neighboring power outlet and the effect of hard starting the large motors.
Conclusion
During a visual inspection it was determined that 3 of the 4 controllers were selected to hard-start at the MCC panel, and as a direct result, significant voltage reduction and a 38V sag were seen at the neighboring residents and businesses. Two solutions were proposed– setting a permanent soft start condition, or adding independent variable frequency drives (VFD) to the controller panels. By capturing important data at both locations a formal conclusion can be drawn and acted upon.