
Abstract
There are two typical definitions used when dealing with Total Harmonic Distortion. The two types of Total Harmonic Distortion are THD-F and THD-R. They both are figures of merit used to quantify harmonic levels in voltage and current waveforms; however, each one uses a different reference. THD-F is a comparison to the fundamental and THD-R is a comparison to the signal’s RMS value. For power systems, the THD-F is the most accurate measurement especially when there is high harmonic content. The THD-R measurement can be prone to misinterpretation which can easily lead to measurement errors when measuring larger distortions.
THD-F
Total Harmonic Distortion in reference to (F) Fundamental, represents the ratio, in percent, of the voltage/current harmonic components relative to the voltage/current of the fundamental. When the reference is not indicated (i.e. simply THD), then it is usually assumed the reference is fundamental. For power systems, THD-F is by far the best measurement to use. Below is the equation for THD-F. V2 stands for the 2nd harmonic, V3 for the 3rd and so on. V1 represents the fundamental voltage.

THD-R
Total Harmonic Distortion in reference to (R) RMS, is the ratio, in percent, of the voltage/current harmonic components relative to the absolute voltage/current RMS. Because this is related to an RMS base, all harmonic values must be calculated in RMS. The formula for THD-R is below:

THD-R was adopted from the field of audio amplifier measurements, where THD-R is used to measure the system’s linearity and its numerical value is always much less than 1 percent. In most Hi-Fi systems, THD is in the range of 0.1% to 0.3%; in other conventional audio systems it may be as high as a couple percent, however these are still relatively low values. The allowable range for THD-R in power systems is much higher– up to 5%. Another measurement that is sometimes used related to audio is THD+N, where N is additional noise. This too, has very little use in dealing with power systems.
In the graph shown in Figure 1 it is clear how the % values for THD-R and THD-F are very close for the low values; however, the values deviate greatly as distortion increases.
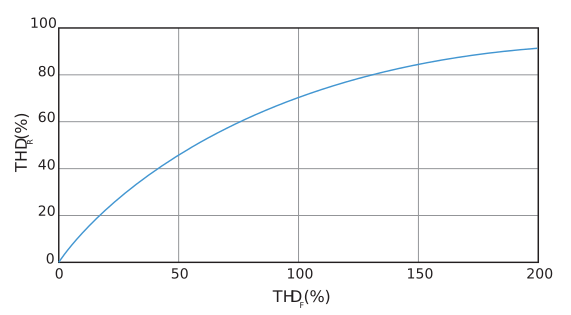
As shown in Figure 1, at low values of THD, as in most audio work, there is little difference in which system is used. Mixing up THD-F and THD-R does not create much of a problem for the technician making audio distortion measurements. In the past, the audio distortion measurements were made with the older type of analog distortion analyzers. With these older analog distortion analyzers, it was much easier to make THD-R measurements than THD-F measurements.
Newer state of the art technology incorporated in PMI recorders makes measuring THD-F just as simple as measuring THD-R. THD-R is limited by definition to values up to 100%. THD-F has no finite limits. This allows for higher resolution measurements of power containing high harmonic distortion content with THD-F. PMI recorders measure THD-F and THD-R equally well, however, the preferred usage of THD-F over THD-R is recommended.
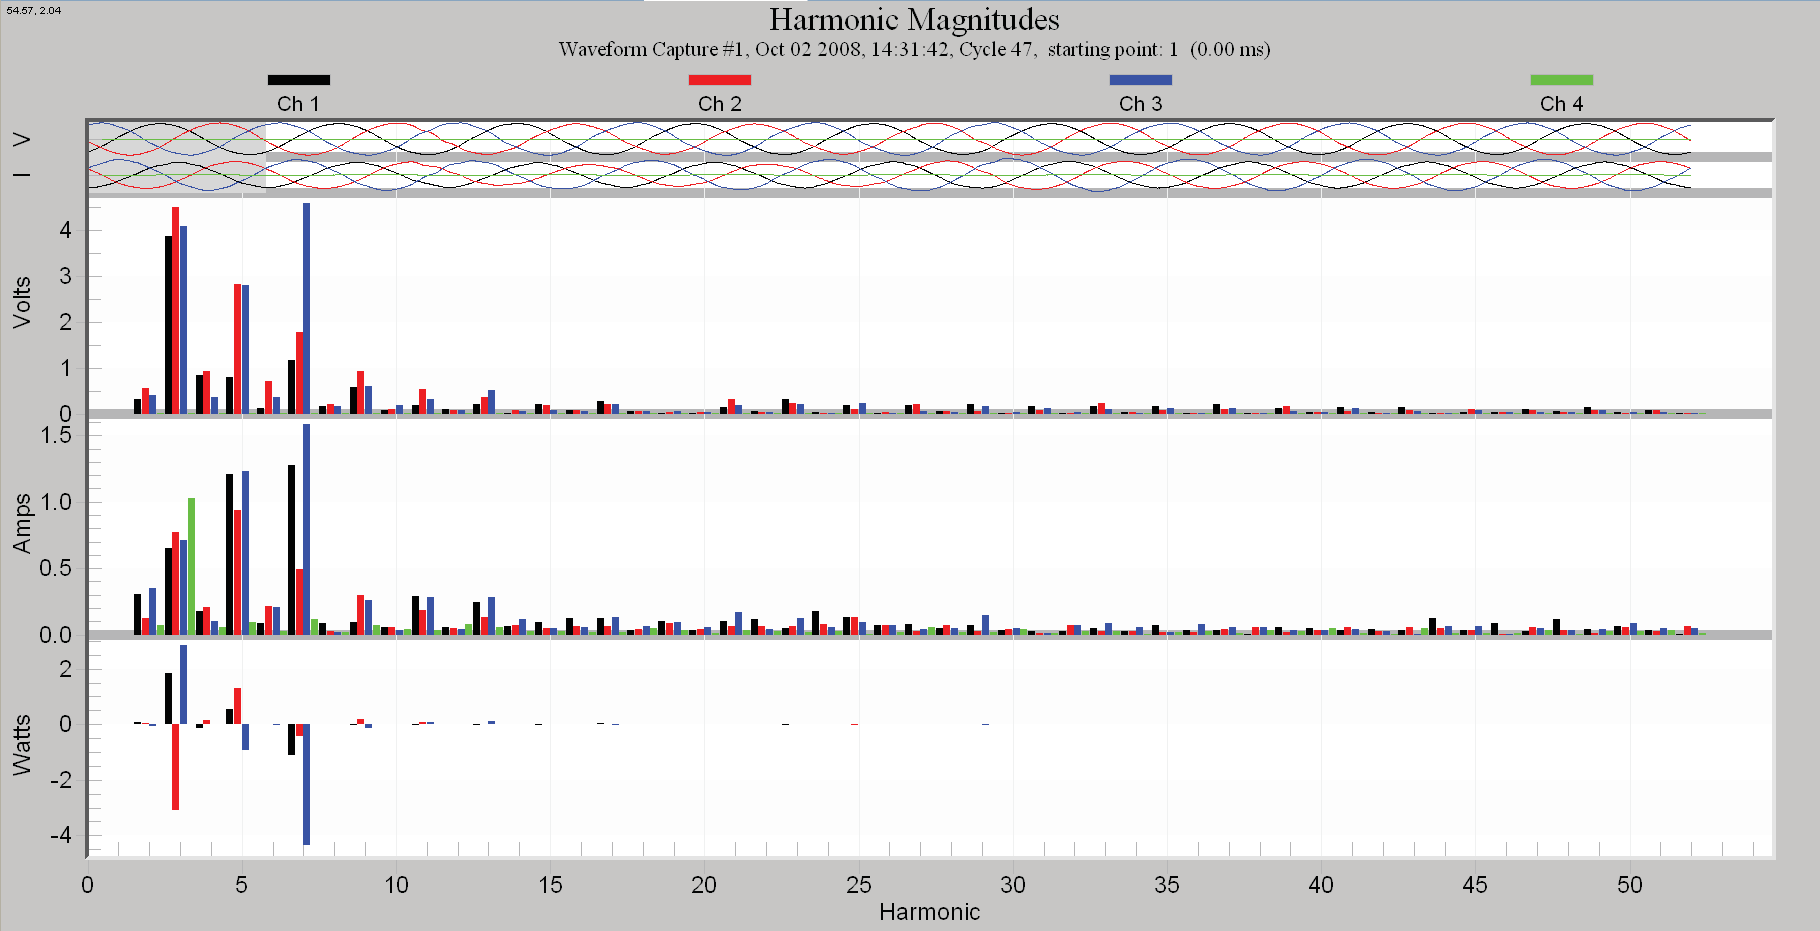
Nearly all PMI recorders are capable of measuring THD-F and THD-R. Figures 2-5 demonstrate the use of Provision reports and graphs when examining THD-F and THD-R data.
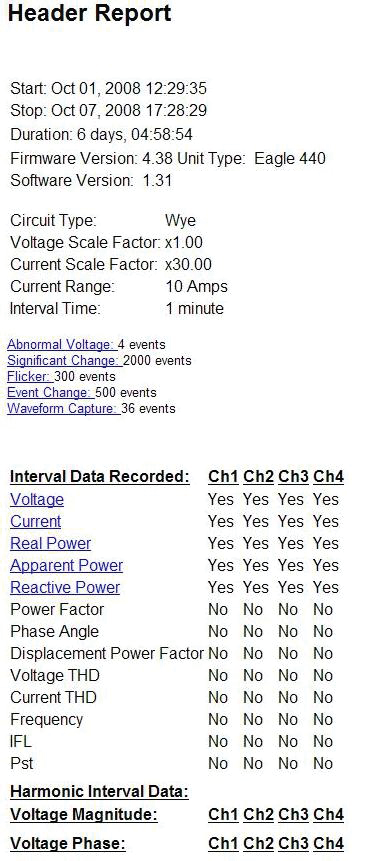
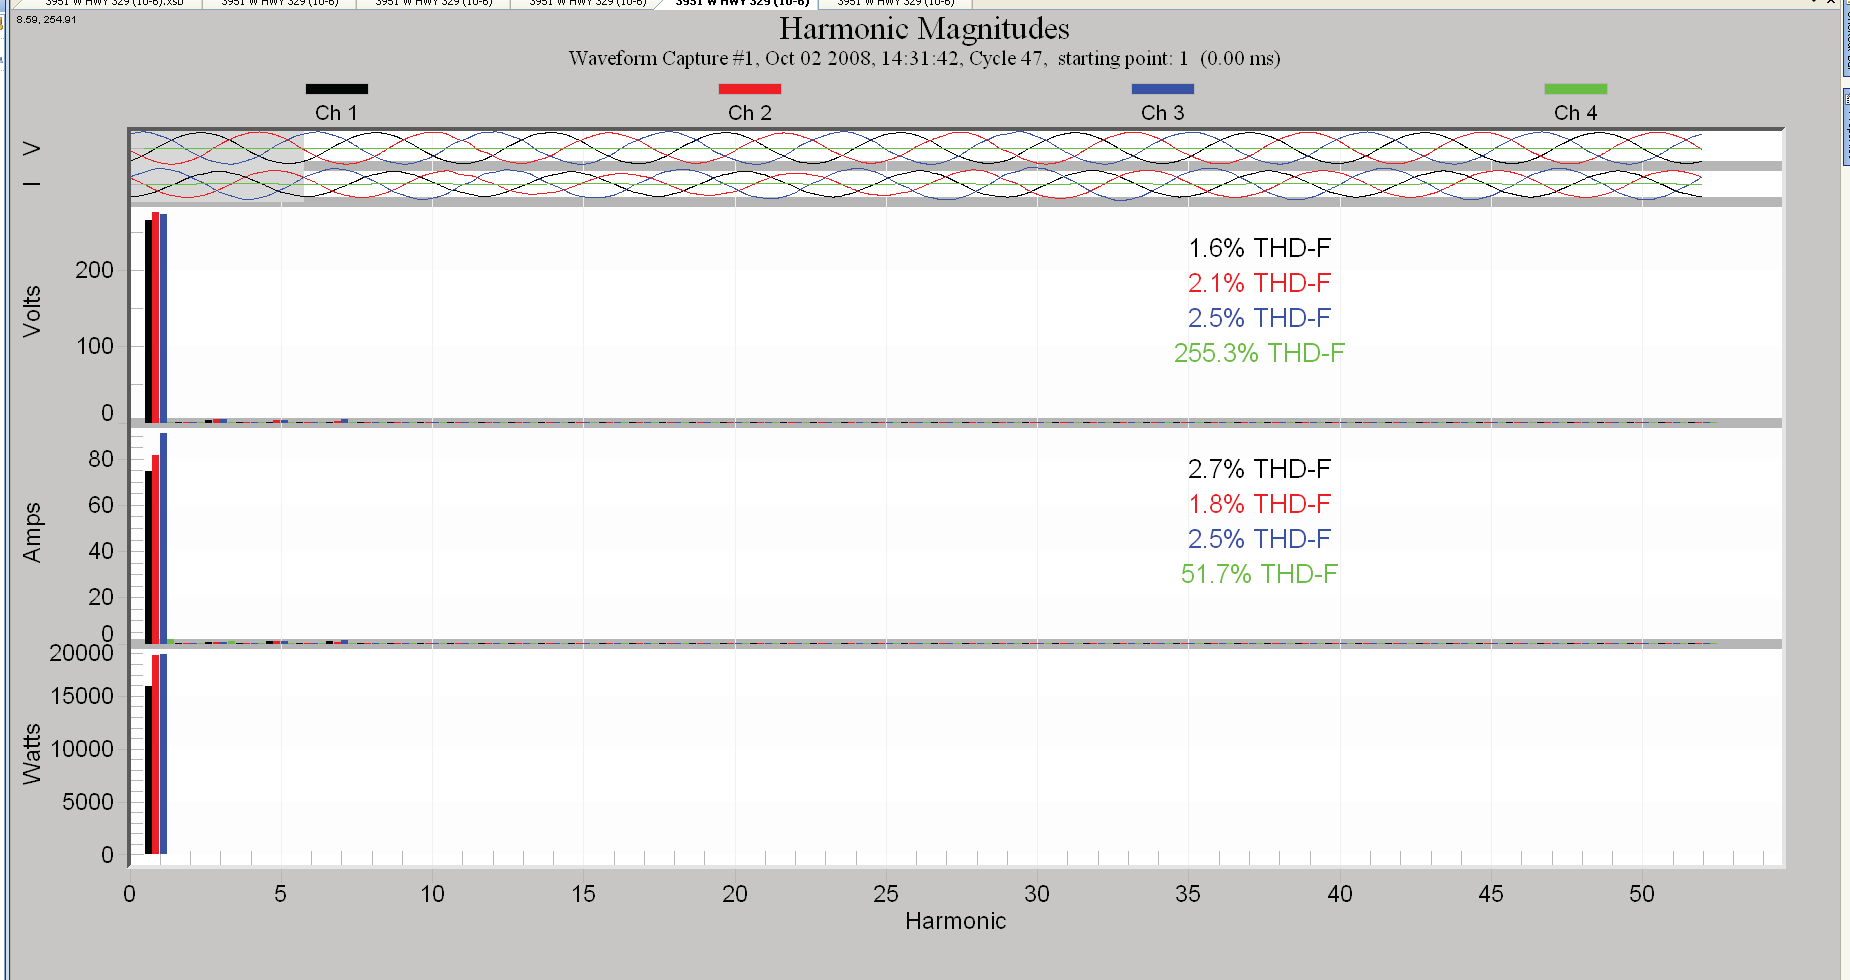
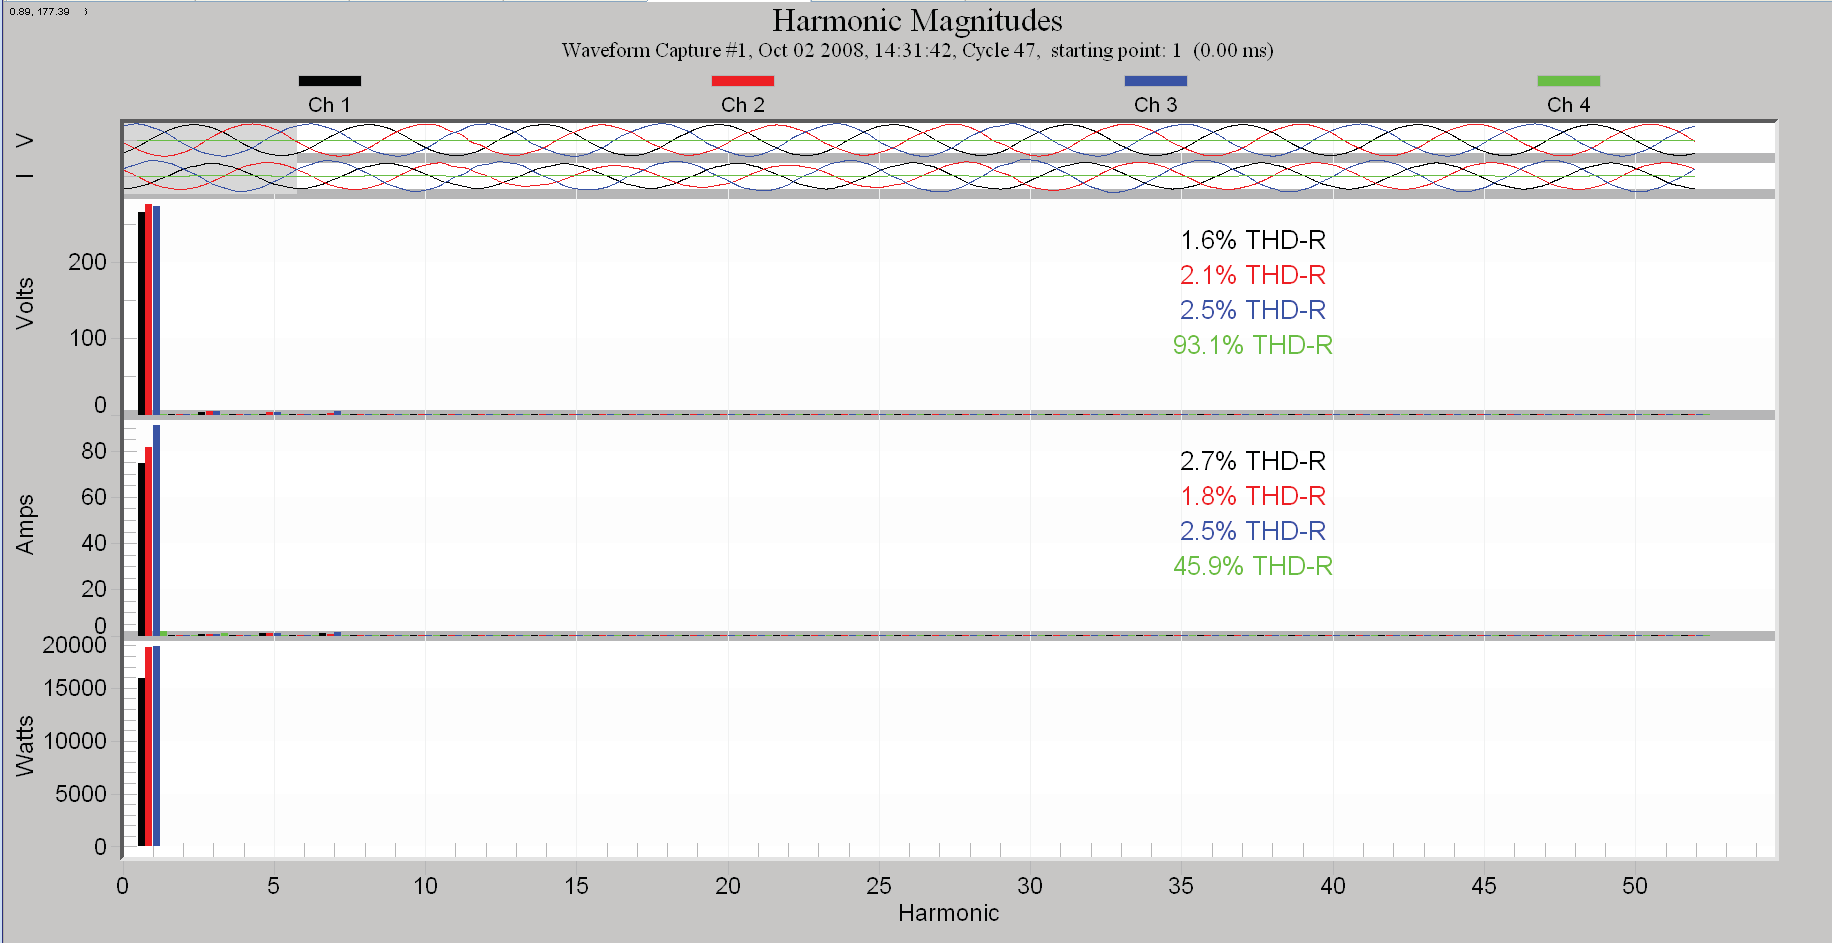
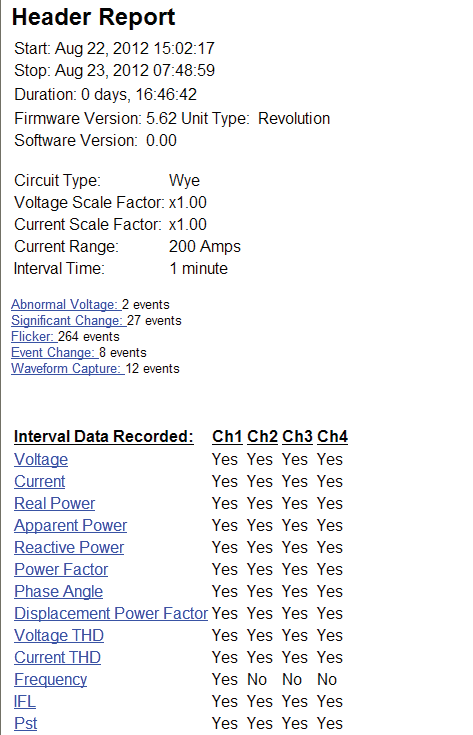
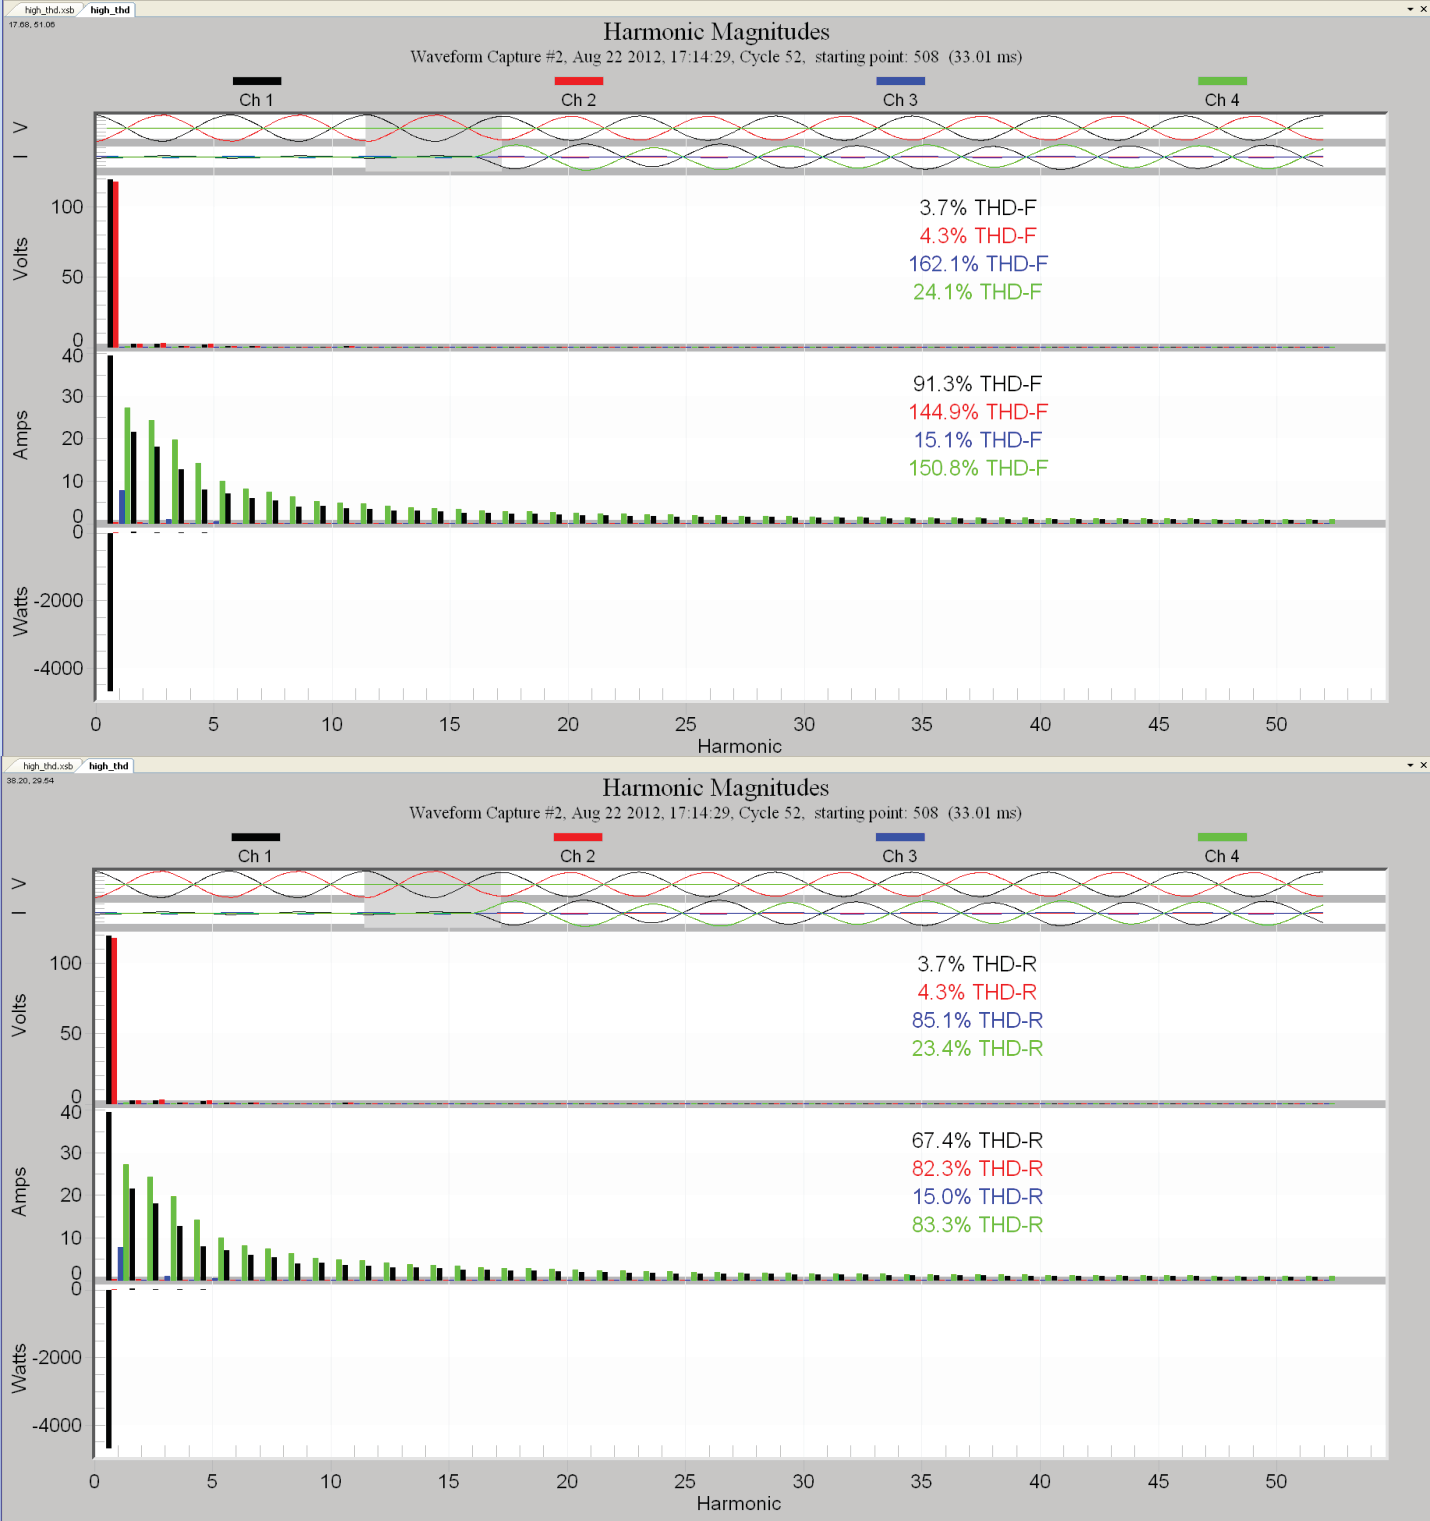
A header report from a Revolution (Figure 6) shows high levels of THD-F versus -R. In Figure 7, Channel 2 shows higher THD and clearly shows how THD-F and THD-R diverge. THD-R can never go over 100% however THD-F can go almost to infinity.
As the harmonic distortion increases, the THD-R value becomes increasingly less sensitive to further changes, as compared to the THD-F value. Since 100% is the ceiling for THD-R, as the harmonic distortion increases, the THD-R just gets closer and closer to 100%, and at some point further increases are difficult or impossible to distinguish. In Figure 7, the THD-F value on channel 4 is over 150%, but the THD-R value is just 83%. At these high levels, the THD-R value will just increase slightly with a significant increase in harmonic distortion, while the THD-F will increase linearly.
Conclusion
Use THD-F, not THD-R for measuring Total Harmonic Distortion on Power Systems. THD-F is far more accurate especially on systems with larger THD values. Leave the THD-R measurements for audiophiles who require THD values on high end audio equipment to be very low, usually below 0.3%. THD on Power Systems can be much higher– up to 5%, and still meet standards in most cases. PMI’s products are capable of measuring either THD-F or THD-R, but the default is THD-F for the reasons noted. Unless there is a specific application to use the THD-R, THD-F is always recommended.