
Abstract
Symmetrical components can be useful in a PQ investigation, especially in cases of voltage imbalance, where the customer’s negative sequence current can help determine their contribution to the imbalance. Many PQ data sets do not include symmetrical components. This paper shows a method to compute positive, negative, and zero sequence components from any PQ recorder or data set with fundamental magnitude and phase angle data, including the PMI Seeker, Bolt, and Revolution.
Step 1: The Math
Everyone is familiar with the Pythagorean theorem: c2 = a2 + b2. Most are also familiar with many of the Trigonometric identities and Trigonometric functions associated with the Unit Circle (for example, sine, cosine, tangent and their inverse functions).
For any right triangle, if we are given the angle between the base and leg of the right triangle and the length of the hypotenuse, then we can compute the lengths of the base and the leg of said triangle. This is a property that we shall exploit mercilessly for the remainder of this paper.
For a detailed mathematical description of Symmetrical Components, see White Paper 371: Symmetrical Components. Note here, though, that the inputs to the equations of symmetrical components are complex, hence the Trigonometry.
When computing symmetrical components from a raw waveform capture, the user simply takes the DFT of a single cycle and selects the 60Hz (Fundamental) bin. (Remember that all DFT outputs are always complex.)
Since we do not have the individual waveform captures from each cycle of each second of our recording, we will have to reconstruct them using simple Trigonometric functions. Specifically, we know that we can identify any point on the Unit Circle with the following equation: R(cos(θ) + sin(θ)) where R is the radius and cos(θ) is the X or base of the right triangle and sin(θ) is the Y or leg of the right traingle.
Conveniently, complex numbers follow very similar mathematical rules to right triangles: we can recover the real and imaginary portions of a complex number if we know the magnitude and the phase angle of said number. The real portion is M × cos(θ) where M is the magnitude and θ is the phase angle. The imaginary portion is simply M × sin(θ) where, again, M is the magnitude and θ is the phase angle.
Step 2: Configuring a Recorder to Record 60Hz Magnitudes and Phases
When initializing a recorder for a new session, simply enable the recording of the 1st (the Fundamental) harmonic magnitude and phase angle in the Harmonics configuration. For the purposes of this analysis, only the first (fundamental) harmonic has been enabled for both voltage and current magnitudes and phase angles.
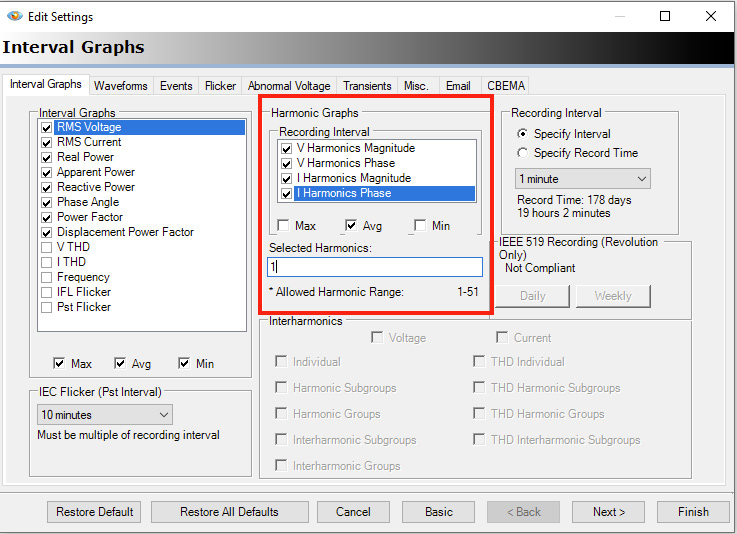
Once the recording is complete, it can be downloaded with ProVision. Looking at the Header Report (the default view for a recording in ProVision), the reader will note the presence of harmonic stripcharts for both magnitude and phase.
To begin the computation of symmetrical components, start by applying the custom template called Vharm, Vphase to the newly downloaded recording. To do this, select Graph -> Custom Templates -> Vharm, Vphase. You will be prompted for the recording to apply this to — simply select the active recording that you’ve just downloaded. (If this template does not appear in your Custom Templates graph selector, you can download the template from the Downloads section for this paper. See the links at the bottom of the paper for more details.)
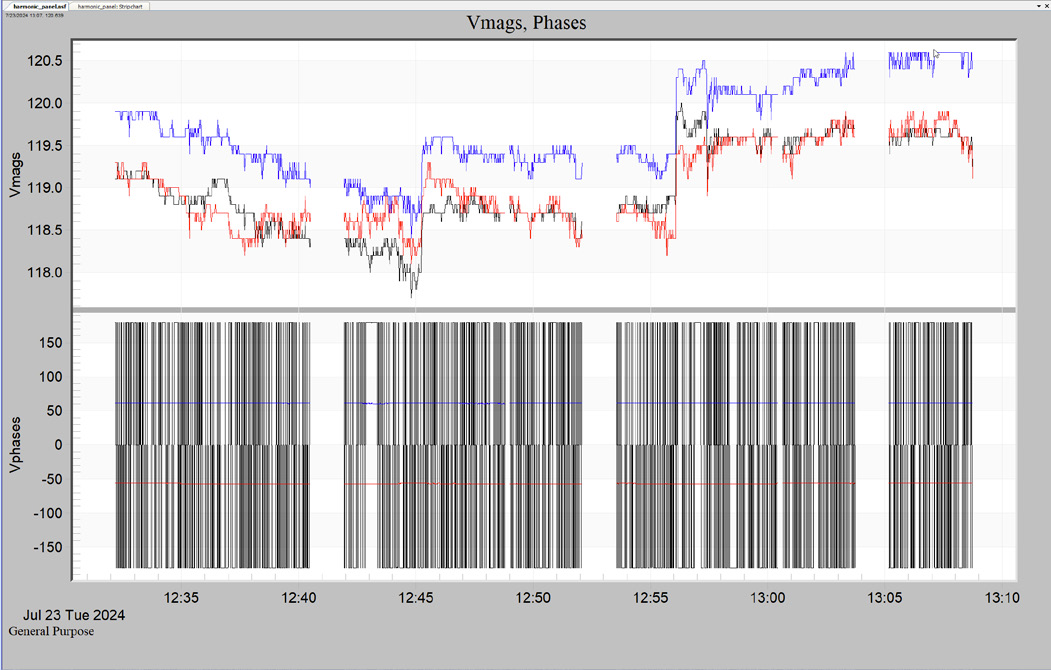
Once applied, a two plot graph will appear. See Figure 3 for an example of what you may see.
From this graph, the user can now generate a tabular data report for these traces. To do so, simply right-click on the graph and then select “Launch Report.” Note that it may take a few moments to render, especially if the recording is large.
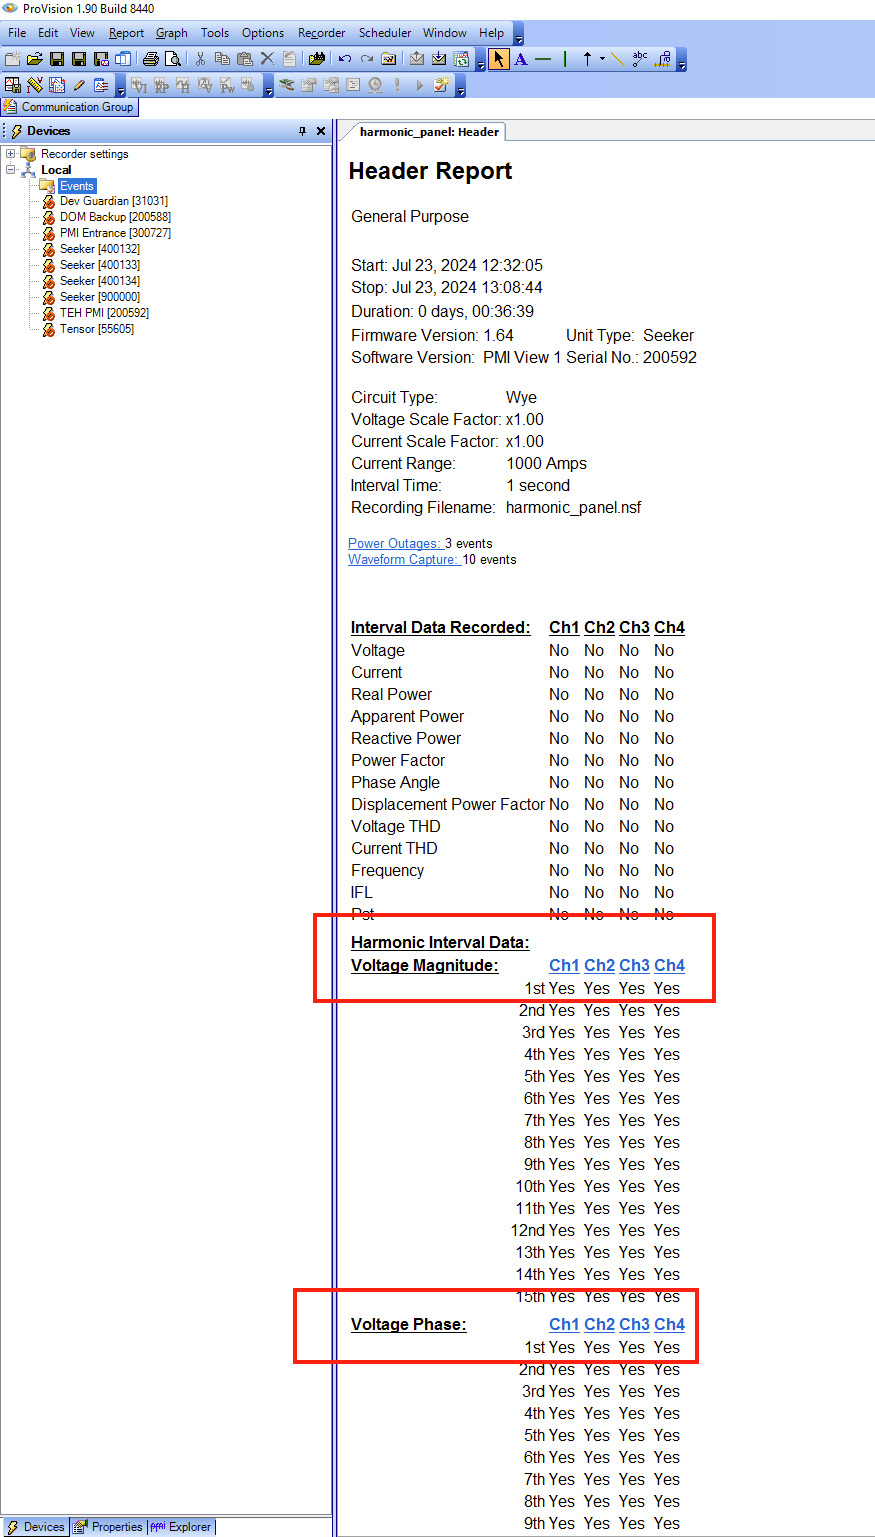
Next, we need to generate a CSV that can be copied and pasted into the Symmetrical Components spreadsheet. To do this, right-click on the newly generated report and select “Export to CSV.” Save this to a file where you can easily load it.
Step 3: Using the PMI Symmetrical Components Sheet
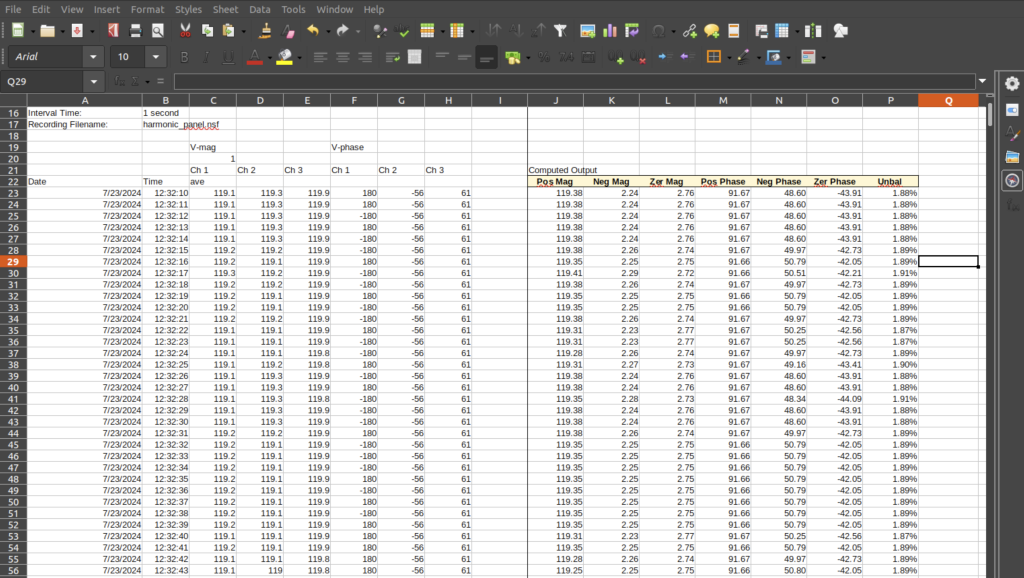
Finally, we can paste this exported data into the spreadsheet. Load the symm_comps.xlsx sheet into Excel or LibreOffice and copy the Ch 1, 2, 3 magnitude and phase columns from your CSV export and paste them into the corresponding columns in the PMI-provided symmetrical components spreadsheet. This should be a one-for-one bulk copy and paste — no need to copy each column individually.
Once these columns have been inserted, the user will note that the corresponding columns for Ch 1, Ch 2, Ch 3, Pos, Neg, Zer, Pos Mag, Neg Mag, Zer Mag, Pos Phase, Neg Phase, Zer Phase and Unbal have been computed and updated in the sheet (Figure 4).
It should be noted that the columns here are unitless — they can be used to compute symmetrical components for either voltage or current. If the user wishes, all of the columns can be duplicated and both voltage and current symmetrical components can be computed at the same time.
Conclusion
This paper has demonstrated how to quickly and easily compute symmetrical components using harmonic magnitudes and phases from a PQ recording with nothing more than ProVision and a simple spreadsheet.