
Introduction
PMI View for iOS continues to evolve with new features and improvements since our last white paper. This document highlights the significant additions that enhance your ability to perform power quality analysis in the field.
Through multiple releases, we’ve focused on streamlining common workflows, adding powerful new analysis tools, and improving the overall user experience. These updates reflect direct feedback from power quality professionals who use PMI View daily for critical tasks.
At a Glance
This white paper explores the following additions to PMI View:
Live Data and User Interface
- Redesigned meter view for enhanced readability and usability.
- Added support for Delta Voltage analysis.
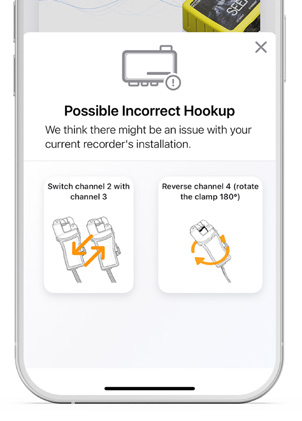
- Improved hookup detection with animated guides to more clearly demonstrate how to fix CT connections.
- Added quick controls to edit common initialization parameters much easier.
Advanced Diagnostics
- View diagnostic readings live from your device.
- Access real-time cell statistics data.
Recording and Data Management
- Set recording reminders and export them to the iOS Calendar or Reminders app.
- View recordings in their original recorded timezone or your local timezone.
- Inspect device settings and make quick edits to recording templates.
Device Management and Maintenance
- Update your recorder’s firmware directly from the app.
- Search, save, and view the Bolt’s calibration certificate.
- Download system logs for advanced troubleshooting.
Live Data and UI Improvements
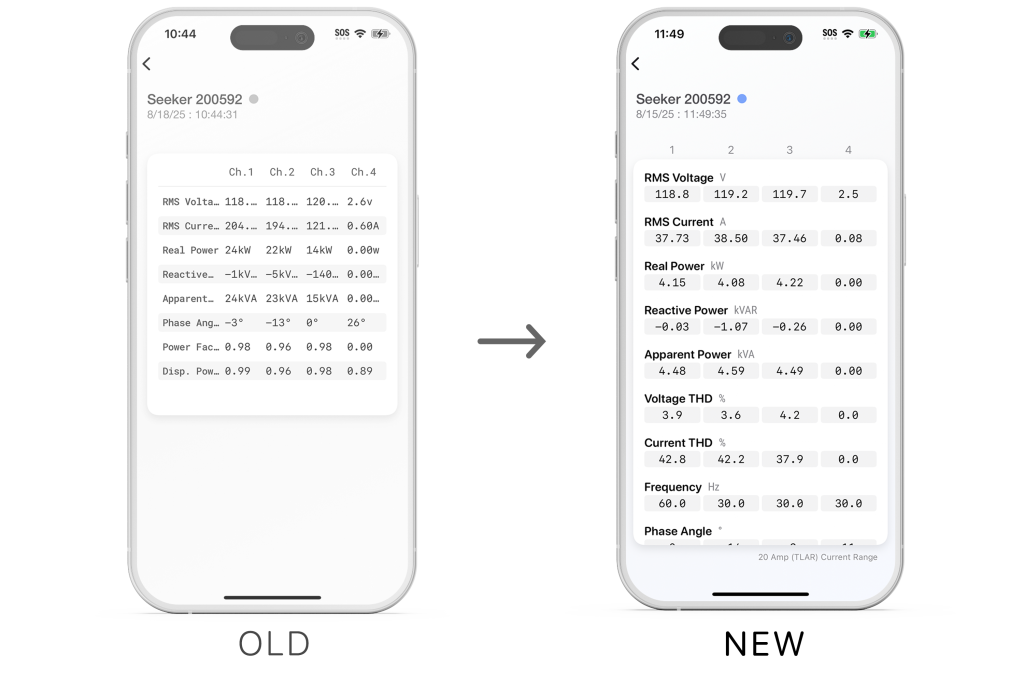
New and Improved Meter View
The live meter view has been redesigned, replacing the previous text-based layout with a structured, multi-column grid for improved clarity. Additional measurements, including Voltage THD, Current THD, and Frequency, are now displayed. The active current range has also been added for quick reference.
Improved Hookup Detection
Our hookup validation tool is now more powerful. In addition to detecting potential CT connection mistakes, PMI View will now display helpful animated images that clearly guide you through the steps required to correct any potential issue, ensuring your physical connections are correct before you begin your recording.
Advanced Diagnostics
PMI View now provides direct access to live diagnostic and cellular data from your connected device, offering insight into its operational health and network connectivity.
To View Live Diagnostics and Cell Data:
- First, connect to a device from your device list.
- On the device’s main screen, scroll down to the Live Data section.
- The Diagnostics tab will be selected by default, showing a snapshot of the recorder’s key operational parameters.
- For cellular-equipped devices, tap the “Cell” tab to view detailed modem and signal information.
Live Diagnostic Readings
This screen allows for on-the-spot health checks and proactive issue identification without needing to stop a recording.
Available readings include:
- Supercap voltage
- Firmware version
- Timezone
- Line Frequency
- Hook-up configuration
- Current Range
Live Cellular Statistics
When using cellular-equipped devices, understanding signal strength and connection quality is key. This panel provides a dashboard of live cell statistics.
Available data includes:
- Cell-Modem Status: Real-time signal strength indicators like RSSI, RSRQ, and RSRP.
- Device & SIM: Network details such as IP Address, APN, ICCID, and IMEI.
- Radio Metrics: Information about the cellular connection, including the current Band and Tower.
Recording and Analysis
Recorder Reminders & Calendar Integration
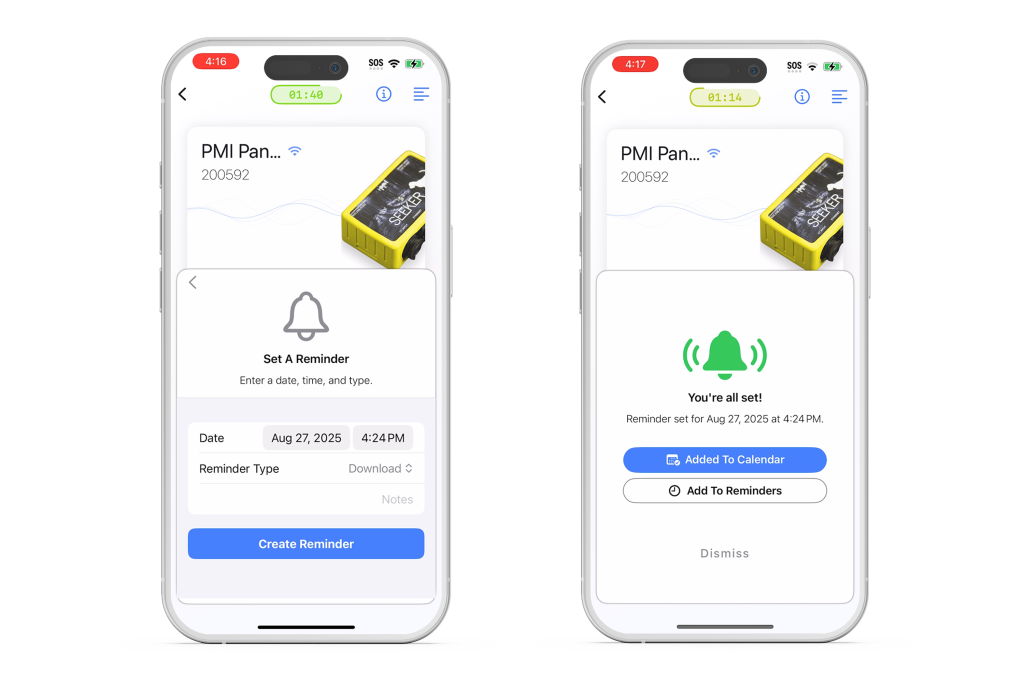
We added recording in-app reminders as a direct result of customer feedback (If you have usability or new feature recommendations for PMI View, please let us know!). After initializing a device, you can now set a reminder for yourself directly within PMI View. For added convenience, these reminders can be exported to the native iOS Calendar or Reminders app with a single tap.
To Set a Reminder:
- After a device has been successfully initialized, a confirmation pop-up will appear. Tap “Set Reminder“.
- On the ‘Set A Reminder’ screen, you can adjust the date and time for the notification.
- Select a “Reminder Type” (e.g., Retrieve, Download, Inspect) and add optional notes.
- Tap “Create Reminder” when finished.
- On the confirmation screen, you can optionally tap “Add To Calendar” or “Add To Reminders” to export the event to your iOS apps.
Recording Timezone Display
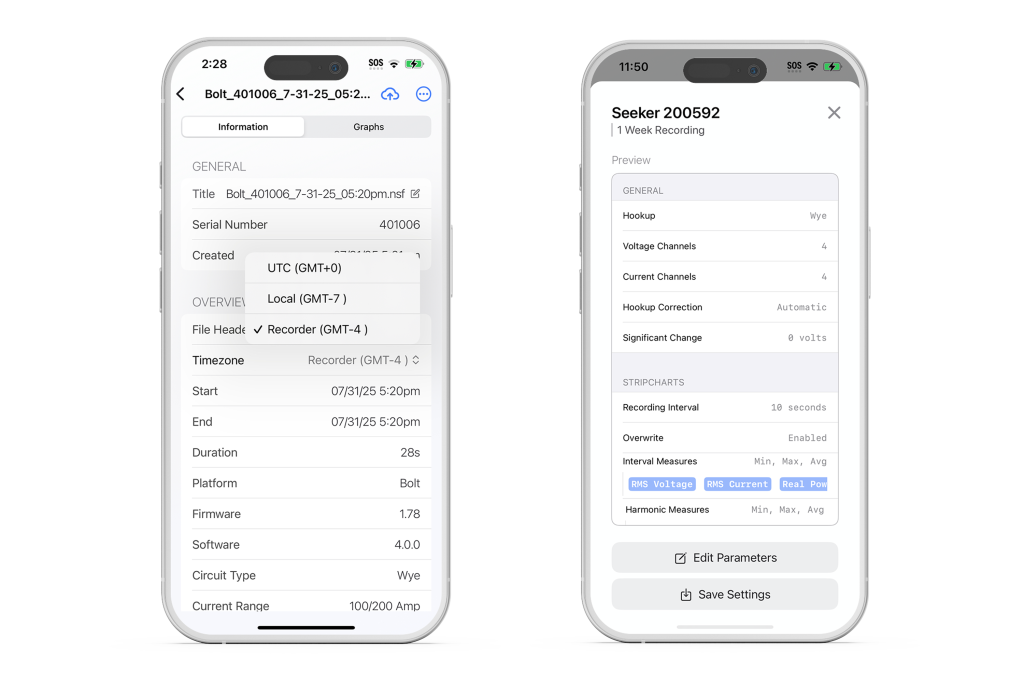
When viewing a downloaded recording, the app gives you the flexibility to display all timestamps in the recorder’s original timezone, your phone’s local timezone, or UTC.
Whenever you initialize a device, PMI View syncs the recorder’s timezone with your mobile device. You can also see a recorder’s current timezone in the Diagnostics panel when connected.
To switch the timezone for a downloaded recording:
- From the Recordings screen, tap on any downloaded recording to open it.
- On the Information tab, locate the Timezone field in the Overview section.
- Tap the Timezone field to open a dropdown menu.
- Select your preferred viewing option:
- Recorder – The device’s timezone when it was recording
- Local – Your mobile device’s current timezone
- UTC
- All data in the recording will now be displayed relative to the chosen timezone.
Inspect and Edit Settings
We have improved the process of reviewing and modifying your recorder’s configuration. You can now quickly inspect the current settings of a connected device. Furthermore, we’ve added quick edit capabilities, allowing you to make minor adjustments to an existing initialization template without having to build a new one from scratch.
To Inspect Device Settings:
- When connected to a device, tap “Inspect Settings” on the main screen.
- A preview window will appear, showing a read-only summary of the recorder’s current configuration.
To Quickly Edit Settings:
- From the settings preview screen, tap the “Edit Parameters” button at the bottom.
- On the editing screen, you can modify common parameters such as Current Range, Waveform Capture settings, and more.
Device Management
Device Firmware Updates
Keeping your recorder’s firmware up-to-date is crucial for performance and accuracy. PMI View now allows you to update your device’s firmware directly within the app.
Downloading Updates
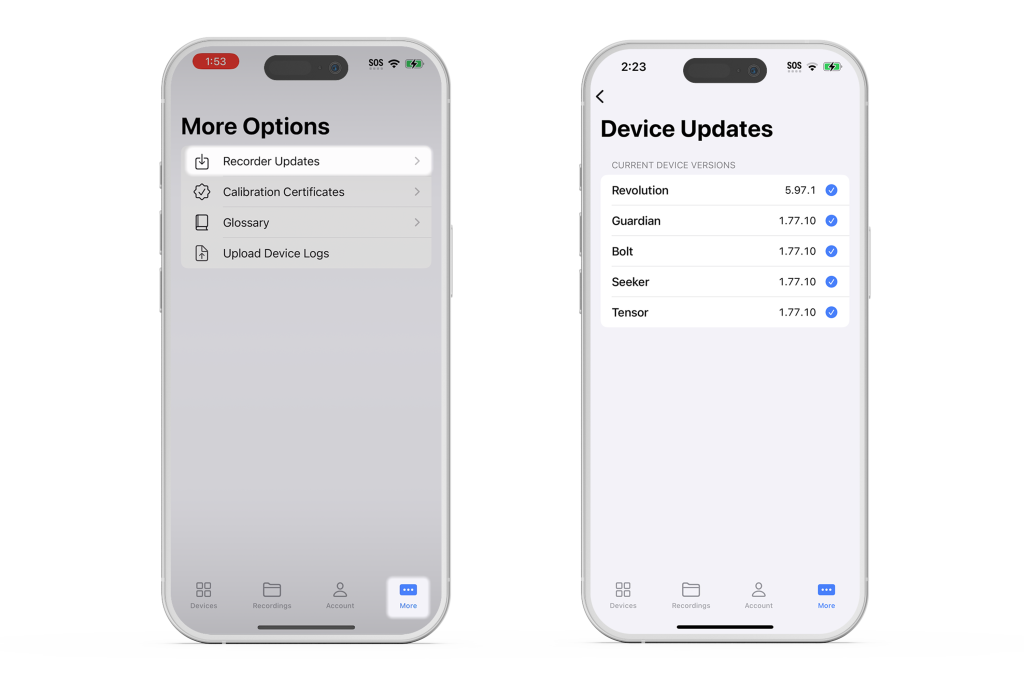
Firmware updates will download from the Power Monitor’s servers to your iOS device automatically (by default) on application launch. The firmware can then be uploaded and installed to your devices whenever you wish. Note: you must be on a network with internet access for the update check to work. The Device Updates page displays which version of firmware has been downloaded for each supported recorder type.
Installing Device Firmware Updates
To upgrade a device’s firmware, simply connect to the device and, if there is a newer version available on your mobile device, you will see a red notification on the side menu, in the top-right hand corner. Simply tap the side menu, and you’ll see the Update Firmware button available. Click the upgrade button to start the process of uploading and installing. The upgrade button displays the version number and the word “Available”.
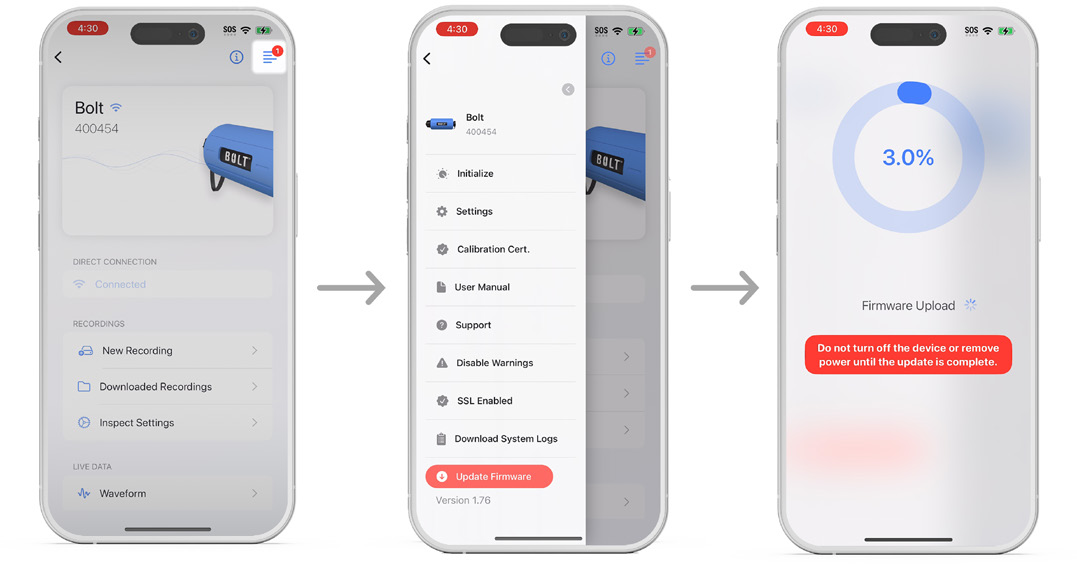
Important: Before starting an update, ensure the device will remain powered on and your phone can stay nearby for the entire process, as it may take several minutes. Interrupting the update may result in having to send the unit back to PMI for repair.
When a firmware update is available for a connected device, a red notification dot will appear on the side menu icon in the top-right corner.
To update your firmware:
- Connect to a device that has an update available.
- Tap the icon to open the side menu. A red “Update Firmware” button will appear at the bottom of the list. Tap it, then follow the instructions to begin the update process.
Bolt Calibration Certifications
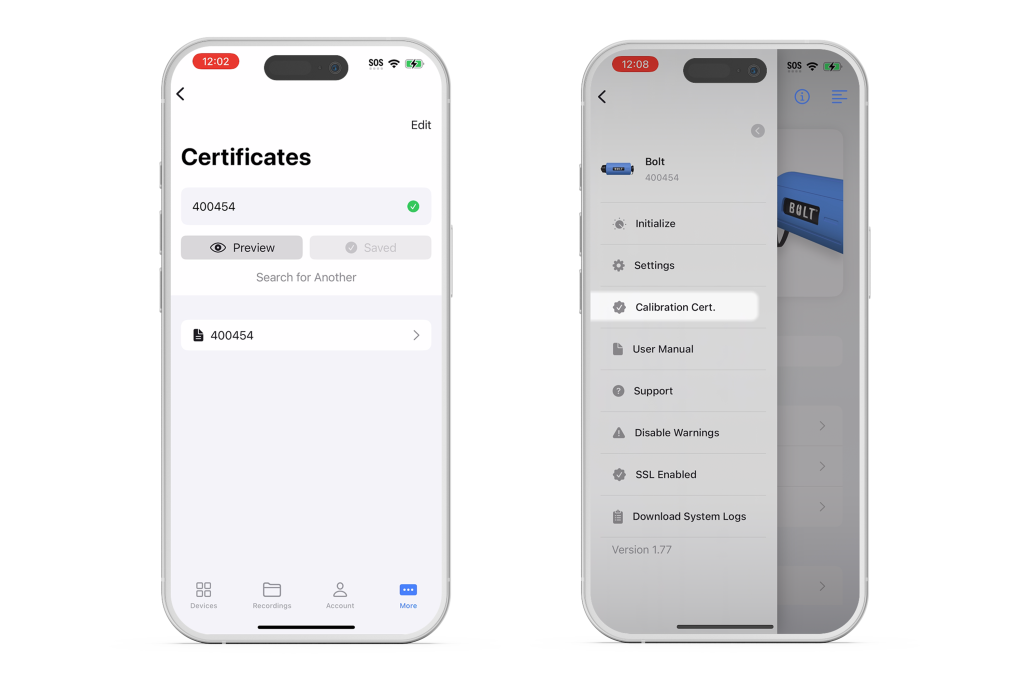
Accessing your device’s calibration history is now easier than ever. You can search for, view, and save your Bolt’s calibration certificate directly from the device menu in the app.
From the app’s main “More Options” tab, you can search for and manage all of your certificates in one place.
Note: An internet connection is required to find and download certificates.
To Find and Save a Certificate:
- Navigate to the “More Options” screen and select Calibration Certificates.
- Enter the device’s serial number into the search bar and tap “Find Certificate“.
- Once found, tap “Preview” to view the PDF or “Save” to download it to your device.
- Your saved certificates will appear in a list below the search bar. From the list of saved certificates, tap any entry to view the full PDF document.
To remove a certificate, tap the “Edit” button, then the red minus icon next to the certificate, and finally tap “Delete“.
Viewing a Certificate from a Connected Device
You can also access a saved certificate directly from the menu of a connected device.
To View a Certificate:
- Connect to a device from the main device list.
- Open the side menu and select “Calibration Cert“.
System Log Downloads
When using cellular-equipped devices, understanding signal strength and connection quality is key. This panel provides a dashboard of live cell statistics.
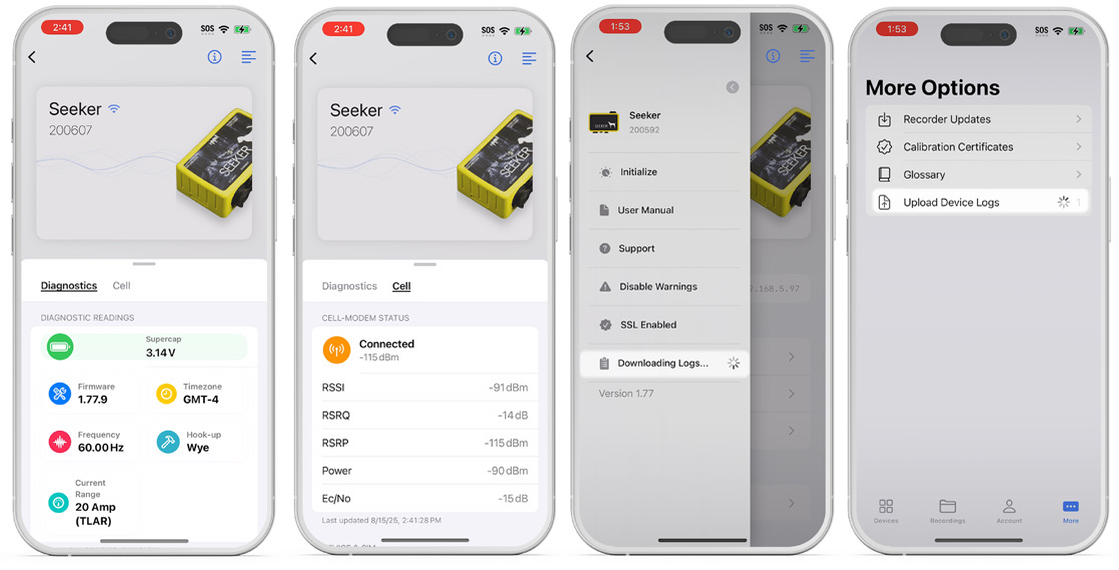
To Download Logs from a Device:
- First, connect to the desired device from your device list.
- Once connected, open the side menu and select “Download System Logs“.
- Wait for the “Success!” confirmation message to appear. The logs are now saved locally within the app.
To Upload Logs to PMI View:
- Verify that your mobile device is connected to the internet first.
- After downloading logs, navigate to the “More Options” tab from the home screen.
- Note: A badge on the Upload Device Logs row indicates how many logs are ready to be sent.
- Tap “Upload Device Logs” to send the files to our support team for analysis. The option will disappear from the menu once all logs have been uploaded.
- Note: For security purposes, users will not be able to view the logs. You’ll need to coordinate this with our technical support team directly.
Conclusion
The latest iteration of PMI View represents a significant advancement in mobile power quality analysis. These improvements, combined with an intuitive mobile-first interface, establish PMI View as an essential tool for modern power quality analysis.
Feedback
The continuous evolution of PMI View is driven by the valuable input we receive from power quality professionals who use our software daily. We encourage users to share their experiences, suggestions, and feedback by contacting our development team at support@powermonitors.com.