
Abstract
This white paper aims to highlight some of the storage and live-data capabilities of the Vision Power Quality Recorder.
Configuring for Recording and Capabilities
In addition to its real-time data viewing capabilities, the Vision is capable of recording several different key pieces of data: interval data (voltage, current, power), waveform capture, transient capture, harmonics and much more. What distinguishes the Vision from the rest of the PMI line, however, is its ability to record this data while simultaneously displaying the different real-time values all without disrupting the recording process.
The Vision can be configured for recordings through PMI’s PC software ProVision or directly from the device itself. (See Device Initialization, below.) Once the device has been set to record the desired data and it has been connected, the recording can be started from any of the live data menus by selecting Record as shown in Figure 1.
Once the recording has started, a tape-recorder icon will appear in the top right-hand corner of the screen to indicate that the device is in fact recording data as shown in Figure 2.
Note that while the device is recording, it is still possible to navigate through the live graphs and meter displays without disrupting the recording.
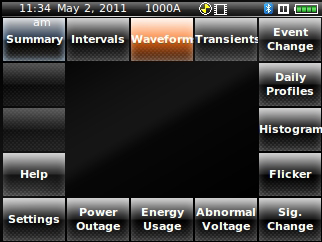
Another useful feature of the Vision is the ability to get live-data previews in live-data mode by hovering over the menu as shown in Figure 3.
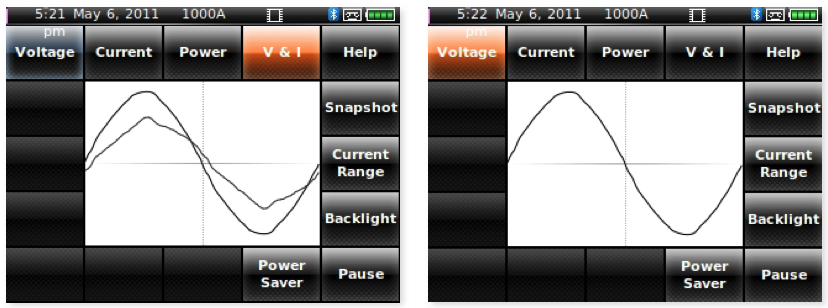
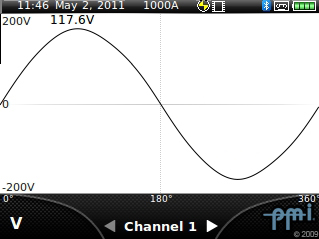
The Vision’s live-data interface was also designed to preserve the selected channel and measure between each of the different data screens being viewed. For example, if the live waveform for voltage on channel 3 is being viewed, and one of the other live graph screens (harmonic graphs or vector graphs) is selected, they would present the harmonic or vector readings for channel 3 voltage as well. This allows the operator to view several aspects of the power quality data without having to reconfigure the device between live readings.
Device Initialization
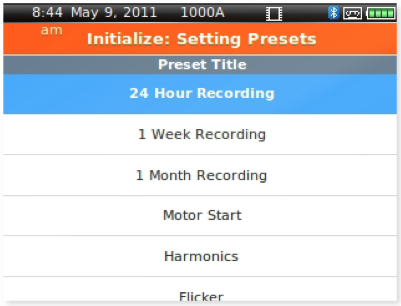
The Vision has six available predefined settings: 24 Hour Recording, 1 Week Recording, 1 Month Recording, Motor Start, Harmonics and Flicker.
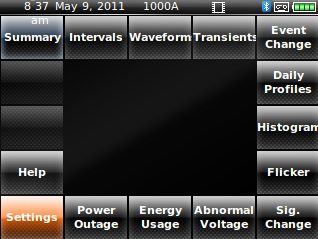
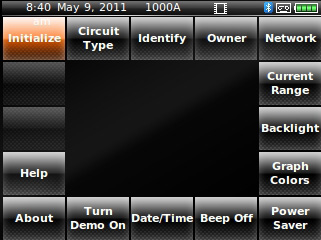
To configure the Vision, go to the data summary / recorded data screen and access the menu. Once in the menu, select the Settings option, as shown in Figure 4. Then select Initialize as shown in Figure 5.
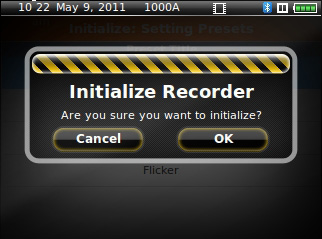
A list of the predefined settings is displayed, as shown in Figure 6. Using the scroll wheel, highlight one of the selections from the list and press OK. A prompt will be displayed that requests confirmation of this selection (Figure 7).
NOTE: Initializing a recorder will erase previously recorded data.
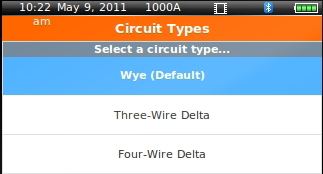
After the settings selection has been confirmed, a prompt will appear asking for the selection of a circuit type for the recording as shown in Figure 8. Select a circuit type from the list and press okay. The settings will be applied to your recorder and the device will then be ready to start your recording (See: Configuring for Recording and Capabilities).
Summary of Predefined Settings
Motor Start
The motor start setting records RMS voltage and current, with a 1 cycle interval setting for the Vision and VisionPro, and a 1 second interval setting for the VisionLite. These time intervals provide greater time resolution for precise measurement of motor start inrush currents and resulting voltage sags.
24 Hour Recording / 1 Week Recording / 1 Month Recording
These settings record nearly all of the available time interval graphs except individual harmonics and IFL flicker.
Harmonics
The Harmonics settings record RMS voltage, RMS current, real power, power factor, displacement power factor, VTHD, ITHD, individual odd harmonics to the 51st, and frequency.
Flicker
The flicker settings record RMS voltage, RMS current, VTHD, ITHD, frequency, IFL flicker, and PST flicker.
Tips for Long-Term Recording
When using the Vision for something other than a quick recording or spot measurement, you may want to configure the device’s Power Saver Settings as shown in Figure 9.
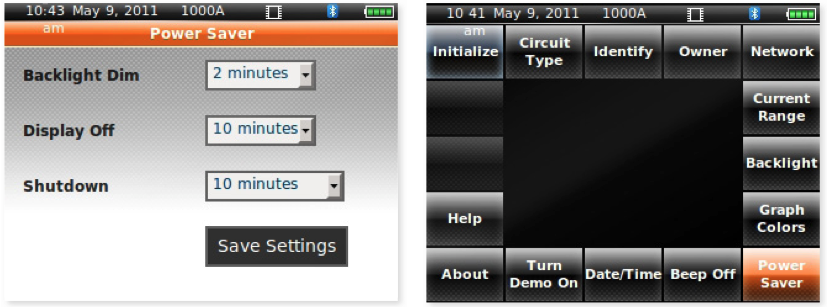
The backlight dim, display off and shutdown timeouts are all customizable. It’s advisable to set the Display Off setting to a low value (such as 1 minute) and setting the Shutdown option to Never Standby. (Note: Vision recorders with a firmware version prior to version 5.60 will only put the display into standby mode – the device will still continue to record voltage data after going into standby. This is not the case, however, with Vision firmware version 5.60 and later. Once the device goes into standby, the entire device actually shuts down and will stop the recording.)
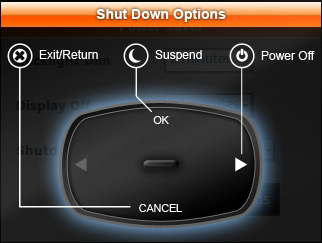
Another option is to manually put the device into standby mode (not shutdown) by quickly pressing the power button. This will suspend the user interface and display module while allowing the Vision to continue its recording as shown in Figure 10.
Viewing Recorded Data
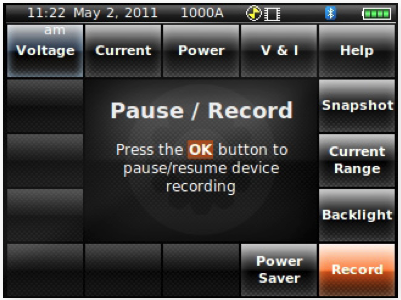
When you’ve finished your recording, you can go back to any of the four live-data screens and select Pause to halt the recording as shown in Figure 11.
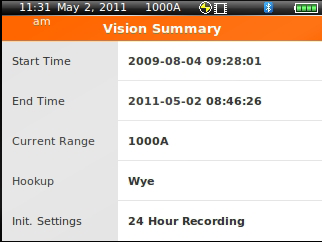
Once the recording has been halted, a summary of the recording data is available by going to the data screen as shown in Figure 12.
The recording can then be downloaded from ProVision, or you can analyze the recorded data directly on the device itself.
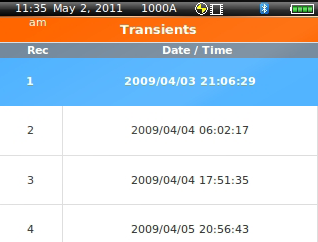
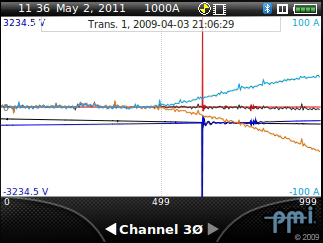
A sample transient capture recording is shown in Figures 13–15.
Summary
Whether it’s a quick spot-measurement, a look at live, real-time readings or a long-term recording analysis, the Vision and its full feature set will help to get the job done.