
Abstract
Data analysis is the key to understanding and solving engineering problems on the distribution system. PMI offers three types of software tools to speed the analysis process, and help manage the wealth of information available from modern power quality recorders and distribution sensors. These software suites and how they are best used are described in this paper.
These software suites are ProVision, Canvass and PQ Canvass. While all three suites can display stripcharts, histograms, and daily profiles, and also show tabular reports, their best uses are different, and they work with different types of equipment.
ProVision
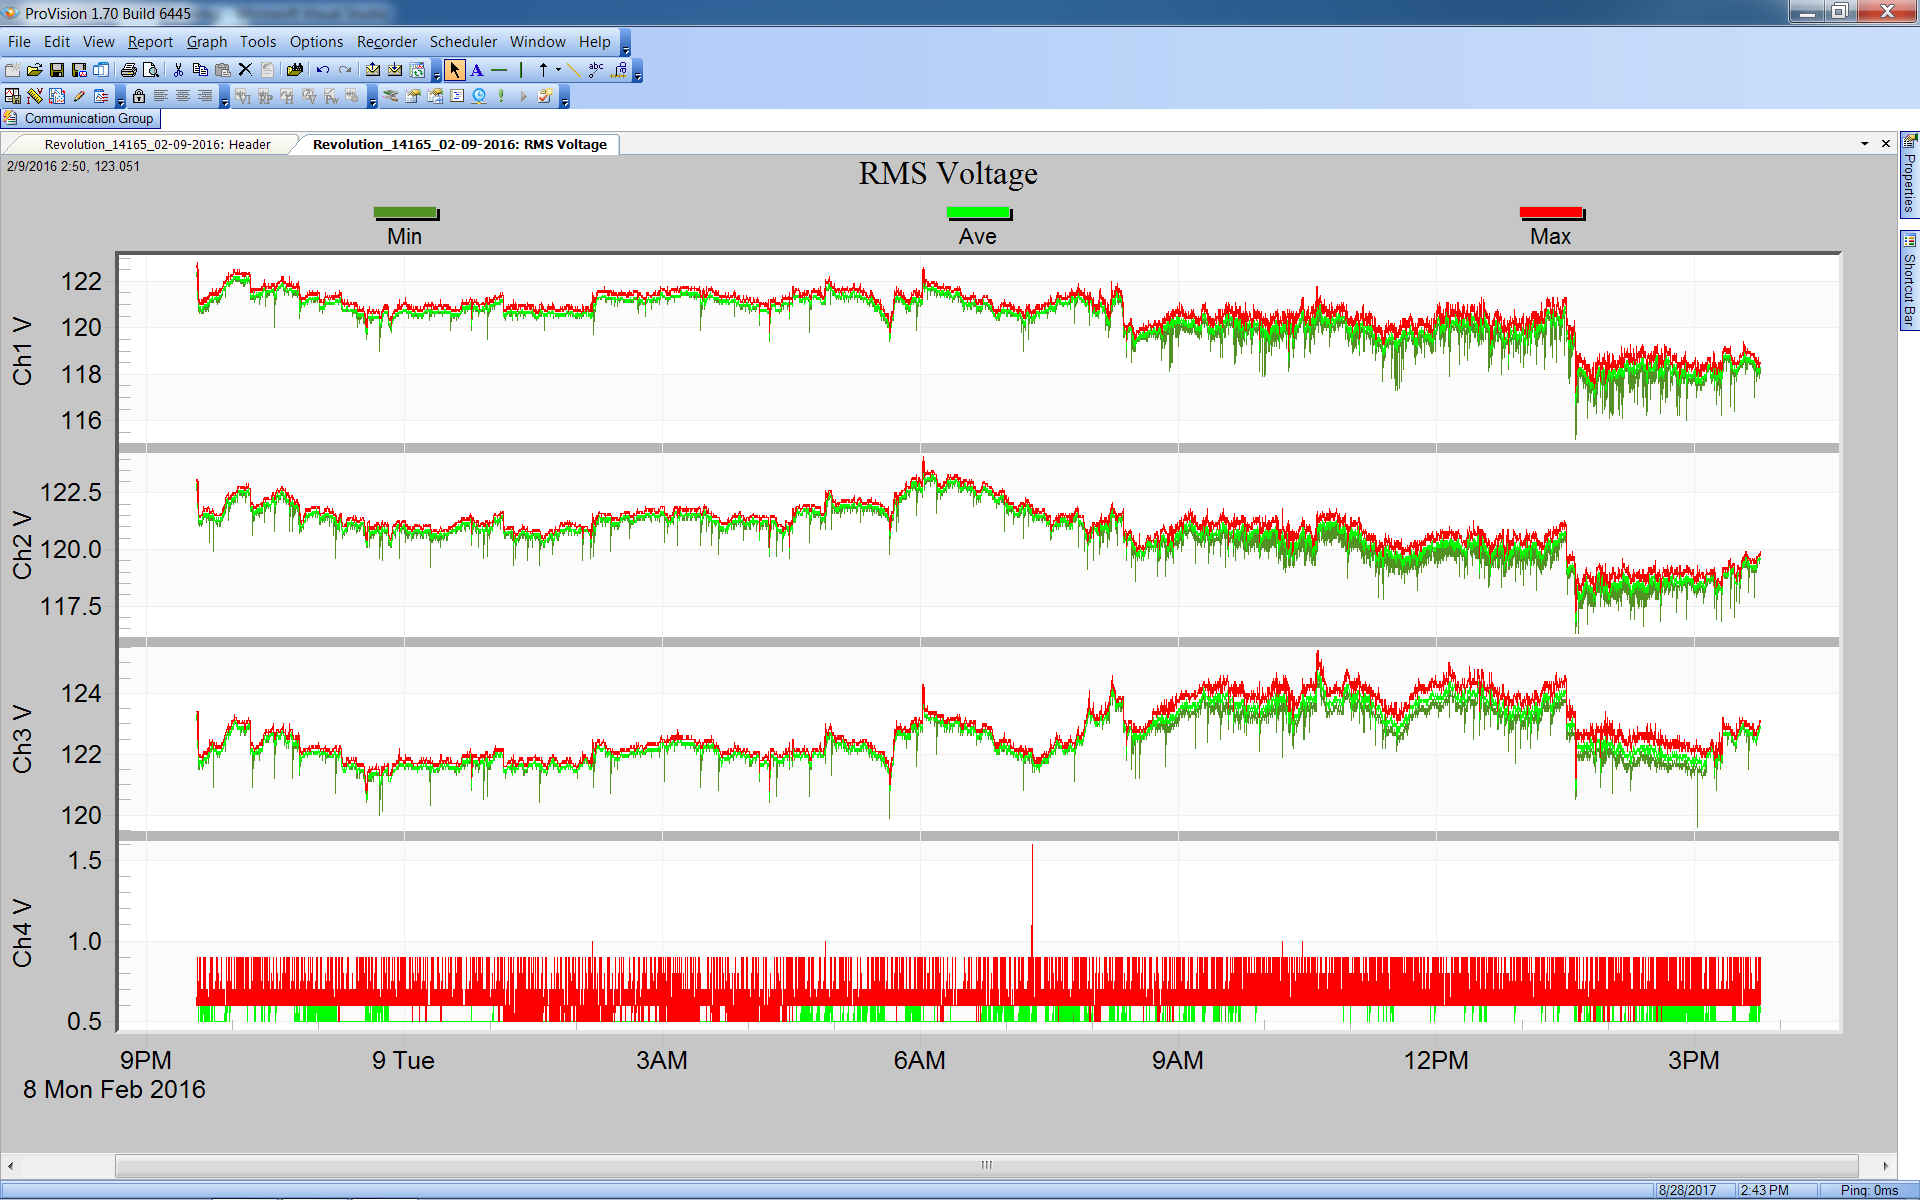
ProVision is PMI’s Windows Desktop Power Quality analysis application. It is the oldest of the three software suites and it has the most capabilities. Figure 1 shows a voltage stripchart in ProVision. ProVision works with recordings downloaded from PMI’s power quality monitoring devices. These recordings are stored on the local desktop computer running ProVision. Custom graphs can be saved with the recording and are available when the recordings are copied to another desktop and opened with another copy of ProVision.
There are many advanced graphing tools in ProVision, including the ability to mix data of different types (e.g. real power and line frequency), as well as from different sources. Graphs may be customized, annotated, and exported for use in PQ investigation reports or documentation. The ProVision file management system helps the user keep track of many recordings from multiple users over time.
ProVision has useful views for managing recordings and devices. Devices may be connected locally to the ProVision PC via USB, Bluetooth, or serial port (for older recorders). When USB devices are connected to the desktop they show up in the device view automatically. Networked devices such as Ethernet Revolution or Cell Revolution or Guardian may be connected manually in ProVision, or set to automatically download via the ProVision scheduler. For scheduled downloads of permanently installed networked recorders, ProVision may be run in “headless” mode as a download server process. A local ProVision instance can connect to the ProVision server to retrieve files and manage schedules.
ProVision works with the widest range of PMI’s devices. It communicates with all PMI’s PQ devices. It does not work with the Boomerang, which is meant for distribution system monitoring, rather than PQ applications. ProVision can be configured to check for software updates and device firmware updates automatically. Use ProVision to keep the firmware on devices up to date.
Canvass
Canvass is PMI’s web-based data storage and analysis system used for analyzing data from Boomerang and cell enabled Revolution devices. Canvass receives continuous one second voltage, current, and power readings from Boomerangs and Revolutions every few minutes. It stores all incoming data, processes alerts for email and SMS distribution, and presents a browser-based graphical interface for analyzing data. This one second data is permanently stored for long term historical views. All data storage and processing is in the cloud, and all graphing, device management, etc. is performed in the user’s web browser. This eliminates the need for any local software, (except for an internet connected web browser), storage requirements, or IT involvement.
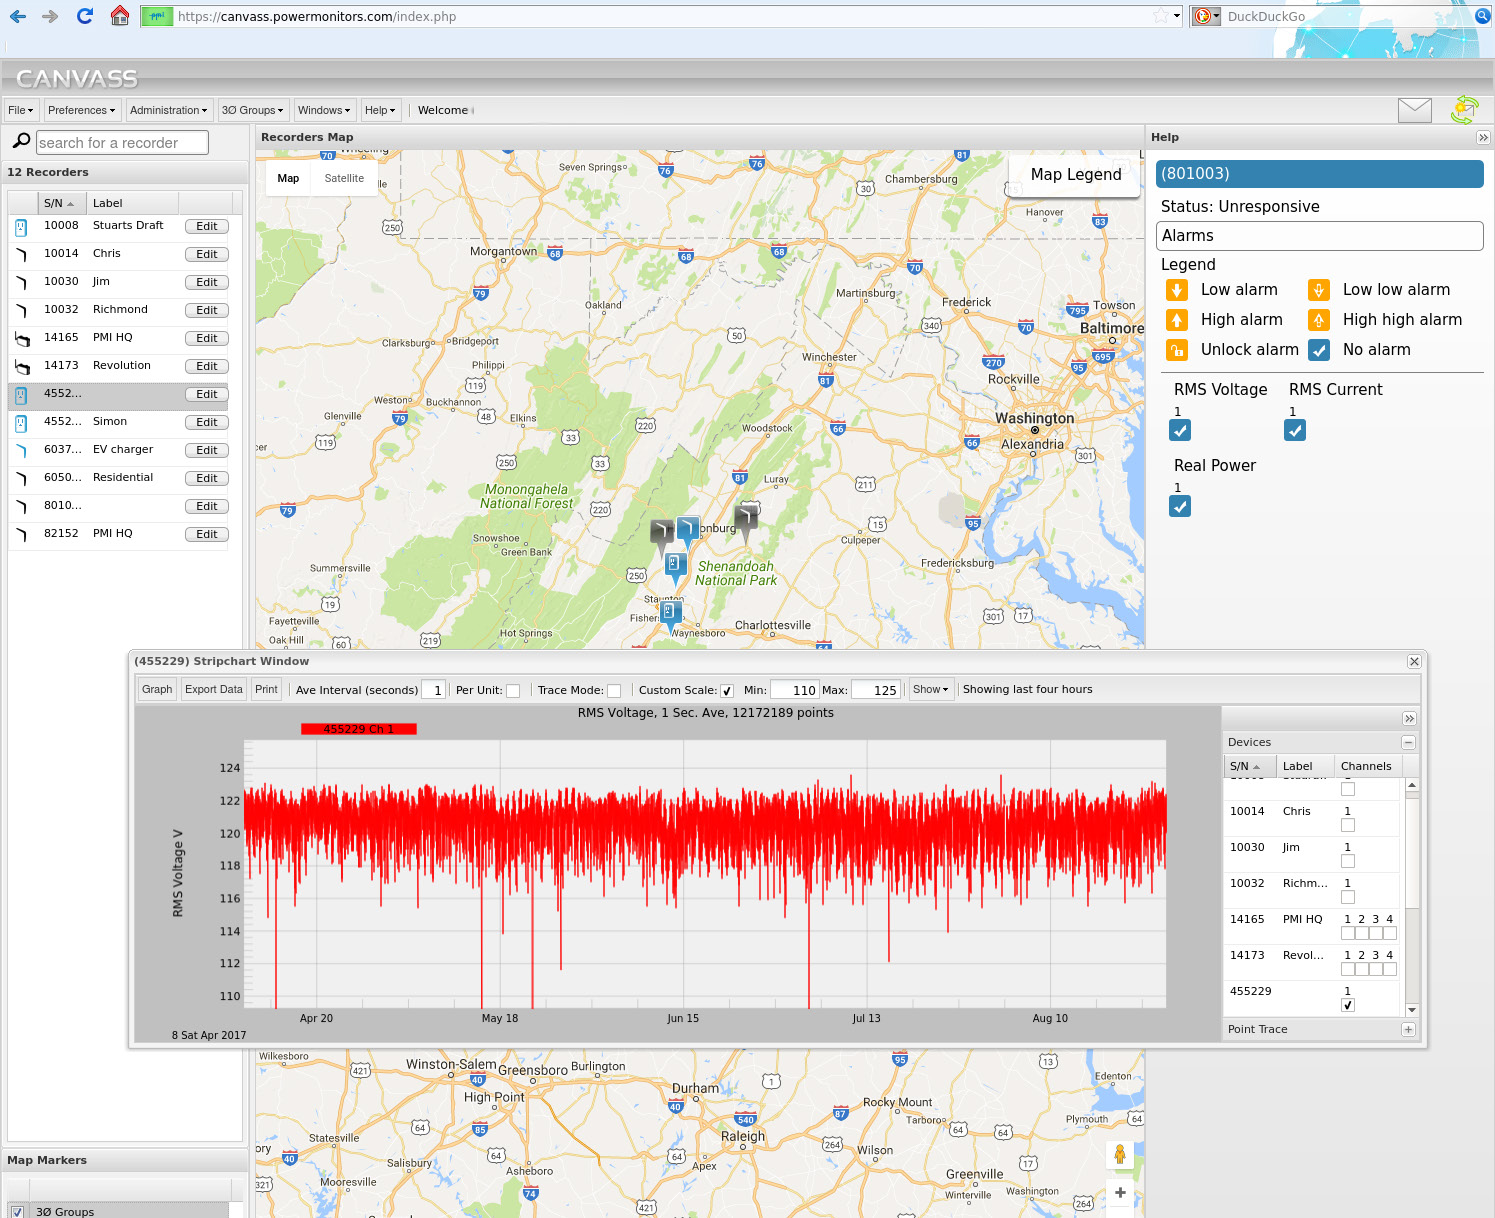
Canvass provides an excellent set of tools for understanding the voltage patterns on a distribution system – typical voltage levels and unbalance, load patterns, voltage regulator operation and load response, etc. Stripchart, histogram, and daily profile graphs show up-to-the-minute incoming data, along with historical data going back years. Figure 2 shows a 5 month voltage stripchart in Canvass. The ability to view multiple locations on a single graph is a powerful method for pinpointing the root cause of a regulation problem or event.
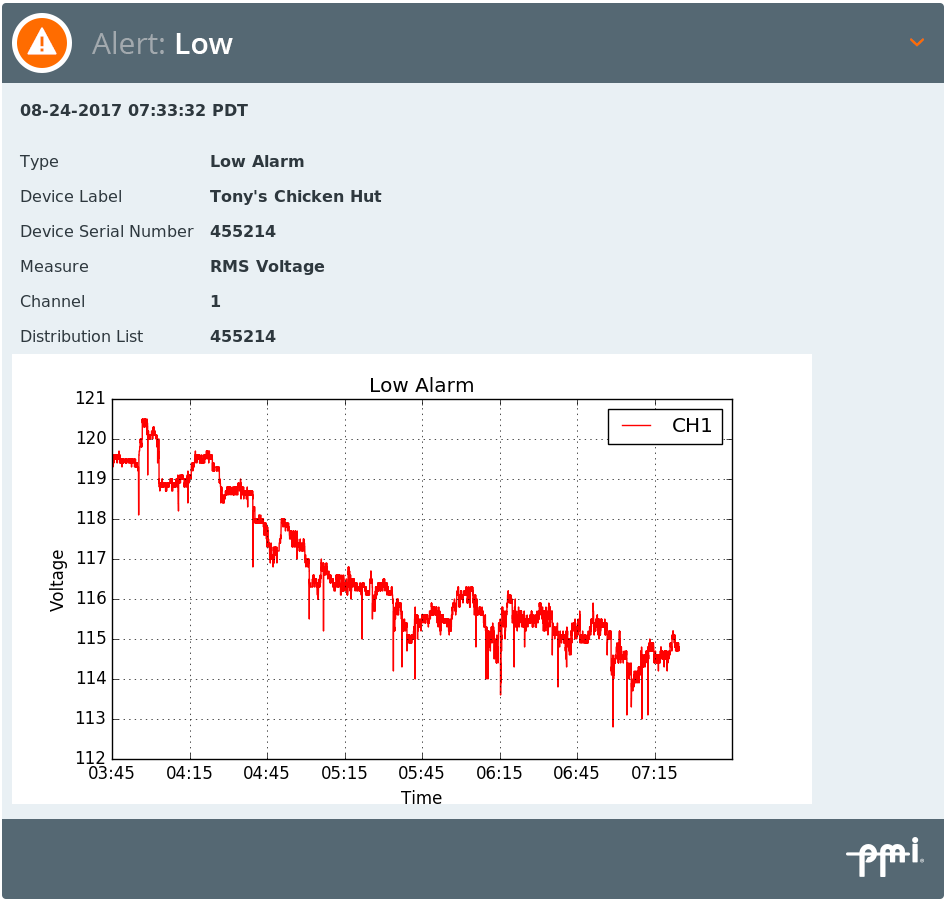
Canvass provides alerting capability. Canvass receives status from Boomerangs, and immediately sends out email and SMS message notifications as programmed, with custom distribution lists programmable for each type of event (low voltage, outage, interruption, etc.), for each Boomerang. Figure 3 shows a Canvass alert email.
Long term reporting involves keeping at least representative periodic voltage readings for the entire voltage reduction period. Baseline voltage values are easy to determine with monthly or yearly stripcharts and histograms. Seasonal patterns are readily apparent with year-long stripcharts.
All Canvass data is stored with a one second interval and by default that is the way it is displayed. Canvass can re-calculate and display larger intervals. Since Canvass is browser based there is no additional software or drivers required. See the whitepaper An Introduction to the Canvass Interface for more information about Canvass.
PQ Canvass
PQ Canvass is PMI’s web-based data storage and analysis system used for analyzing data from Cell Guardian devices. It incorporates the features and convenience of Canvass, many of the power quality analysis and reporting tools of our desktop software, ProVision.
PQ Canvass provides a cloud-based system for power quality data analysis, storage, and real-time display to recorders in the field. PQ Canvass is browser based there is no additional software or drivers required.
Recorders, such as the Cell Guardian, that support PQ Canvass stream recorded data as it’s gathered during the recording session – no need to wait until the “end” of the recording session and download the entire recorder memory.
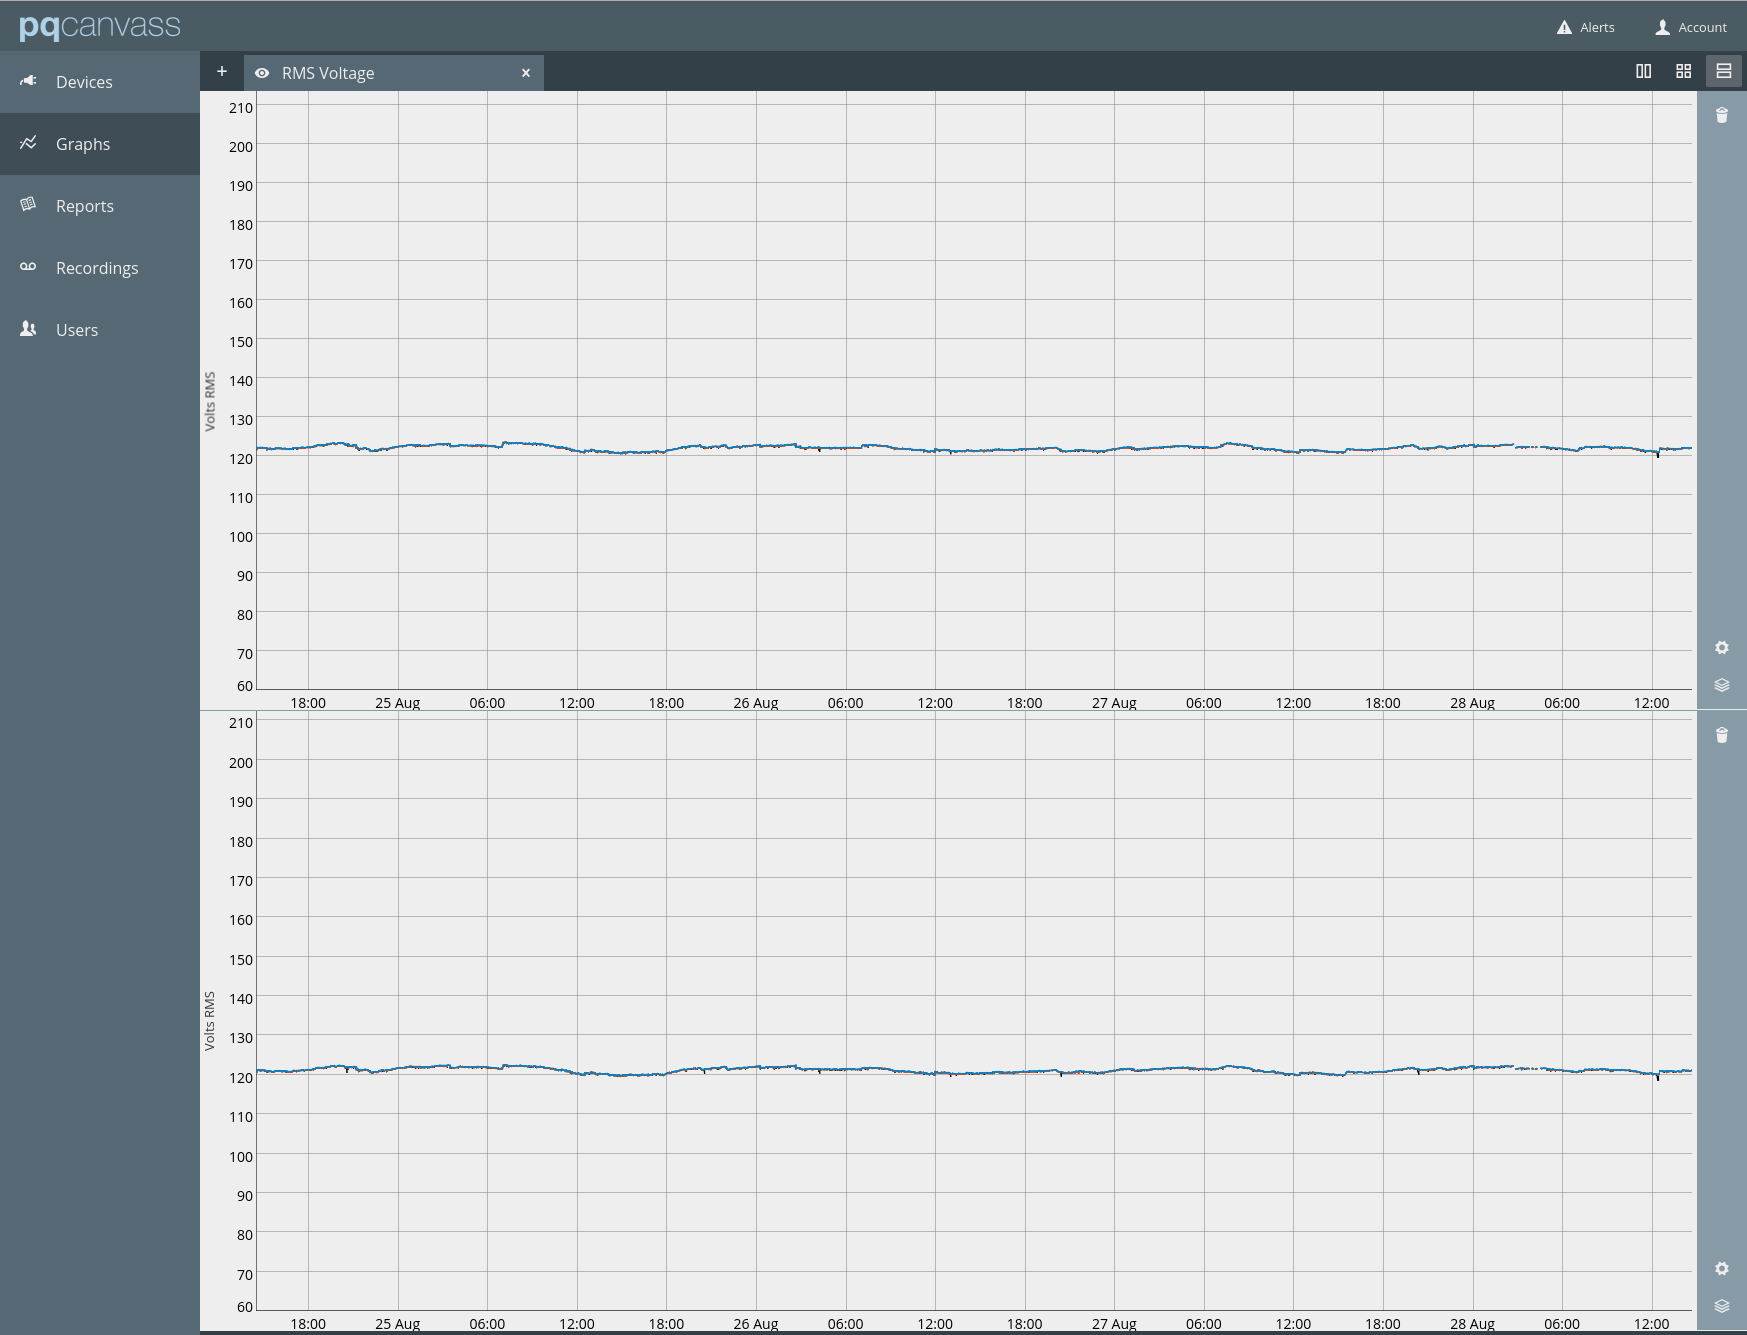
PQ Canvass allows viewing all data gathered up to the present time. Live waveforms and meter displays are also available for real-time information from any PQ Canvass device. SMS and email alerts are also available for immediate notification on PQ events (Figure 4 shows a voltage stripchart in PQ Canvass).
Canvass can also be configured for email alerts. These alerts can be used to determine when to download recordings. This combination of tools can be a powerful technique for solving problems.
| Platform | Uses | Devices |
|---|---|---|
| ProVision – PC Based | Detailed PQ investigations, complex data analysis | All PMI PQ recorders |
| Canvass – Cloud Based | Distribution systems analysis, voltage regulation, unbalanced, load profiling (non-PQ data) | Boomerangs, cell Revolutions |
| PQ Canvass – Cloud Based | PQ investigations, instant alerting for PQ problems | Cell Guardians |
The combination of always-connected recorders and PQ Canvass makes gathering and analyzing power quality data easier and faster. See the white paper Introduction to PQ Canvass for more information about PQ Canvass.
Additional Information
Canvass and ProVision can be used together to isolate intermittent problems. Cell Revolutions and Guardians can report to Canvass/PQ Canvass and also have recordings pulled from ProVision. Some information, such as transient and waveform captures, and interharmonics are not reported to Canvass. Canvass can be used to watch for events of interest and when they occur, ProVision can be used to download a recording from the Revolution for further analysis.