Abstract
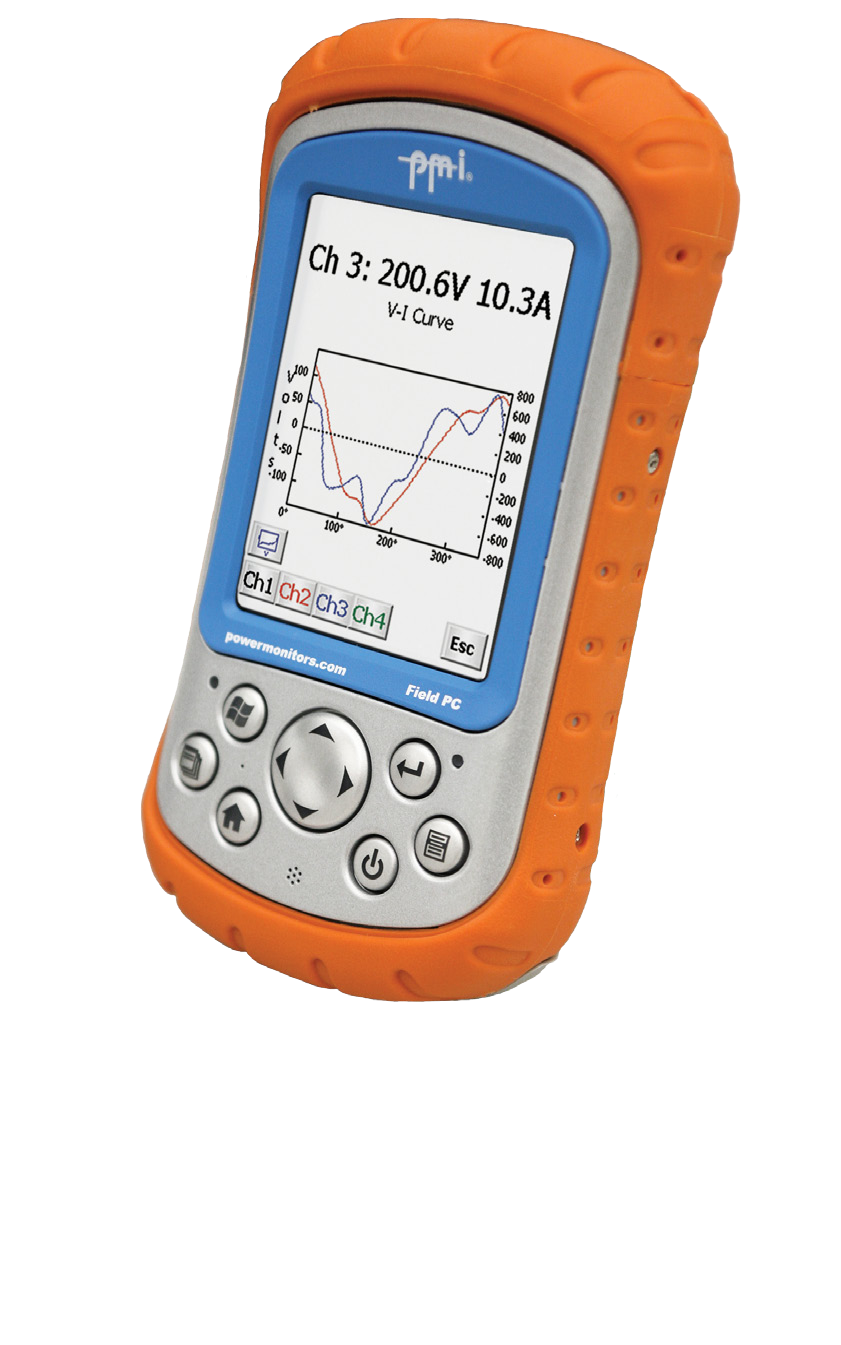
The Field PC comes preloaded with ProVision Mobile, the portable version of our communication software. ProVision Mobile offers a wide array of features. This white paper serves as an introduction to ProVision Mobile by demonstrating how, much like its desktop counterpart, it can be used to view real-time waveforms.
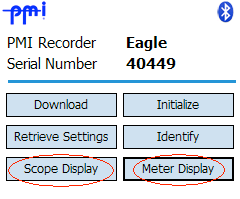
Once the recorder has been connected to the Field PC and ProVision Mobile has established a link to it, the main menu is displayed. The Main Menu displays information such as which model PMI recorder is attached, and its serial number. Also available are options for interacting with the recorder. This paper covers the Scope and Meter Displays.
Scope and Meter Displays
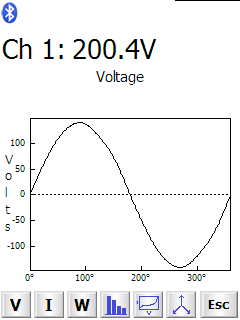
The Scope Display and Meter Display are highlighted in Figure 1. Upon selecting the Scope Display option, ProVision Mobile will change to Scope Display mode, which may take a few moments. The Scope Display menu loads with and displays the waveform for the default setting of voltage on Channel 1.
In the Scope Display menu, the display options can be narrowed by using the options listed across the bottom of the screen (shown in Figure 2). From left to right, these represent: voltage, current, real power, voltage harmonics, voltage and current together, and vector graphs. After selecting a waveform type, the options change to reflect the channels that can be selected for viewing from the maximum the connected recorder is capable of supporting, as well as three-phase. Channel 1 is the default selection.
For voltage harmonics, the option to toggle first harmonics is also available. In vector graphs, the options are to display either voltage, current, or both simultaneously.
Selecting “Esc” returns to the Scope Display menu, where the most recently selected graph and channel are still available. Selecting “Esc” from within the Scope Display menu closes Scope Display mode, revealing the ProVision Mobile main screen.
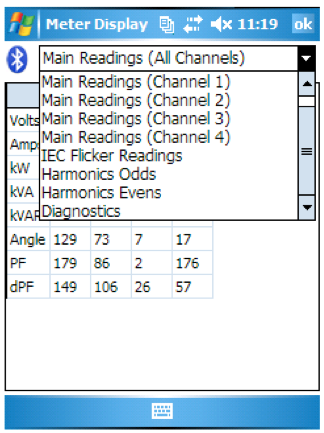
Selecting Meter Display will change ProVision Mobile to Meter Display mode, which may take a few moments as well. A drop-down box (Figure 3) allows for selection of specific data. Main readings for all channels simultaneously or detailed information for each one, flicker, and harmonics are available. To see specific details about the currently connected recorder, choose diagnostics. To exit Meter Display Mode, select the small “ok” button at the upper-right of the screen.
Conclusion
The Scope Display and Meter Display modes are both useful for examining real-time power quality information from a PMI recorder, as the mobile nature of the Field PC allows interacting with and displaying real-time data from recorders still connected to the source they are monitoring. Utilizing these tools can be invaluable for scenarios in which retrieving the recording alone is infeasible due to time constraints.