
Abstract
PMI is excited to announce support for Revolution analyzers in Canvass, our cloud-based data analysis software. Utilizing Revolutions with Canvass makes it possible to view graph types that are not offered with single-phase Boomerangs including current and power stripcharts. This paper will examine all the benefits and extra features that come with Revolution support in Canvass.
Recording Details
Like the Boomerang, the Revolution sends one-second samples to Canvass. Stripchart data sent to Canvass from a Revolution is always in 1 second averages, regardless of the recording interval being used by ProVision recordings. The same stripchart types are always sent to Canvass regardless of whether or not those graph types are enabled for recording by ProVision. Canvass data is completely independent of how the Revolution has been configured through ProVision. By the same token, data recording sent to Canvass is a completely separate operation. It’s very much like having a Boomerang inside of the Revolution.
The Revolution only sends data to Canvass while it is in record mode. For instance, if a Revolution is connected to ProVision through a PC in the office for a data download, it will not send data to Canvass. This is to prevent the Revolution from sending irrelevant data to Canvass.
Network Connection
The Revolution requires a network connection to send data to Canvass. This means that a Revolution with a cell modem or ethernet with a network configuration is needed to allow the Revolution to connect with the Canvass cloud-based database.
Extra Graph Types
Revolutions support several graph types not supported by single-phase Boomerangs. The Revolution includes support for four channels of voltage, current, real power, reactive power, apparent power, and power factor. Revolutions also feature voltage unbalance and stripchart graphs.
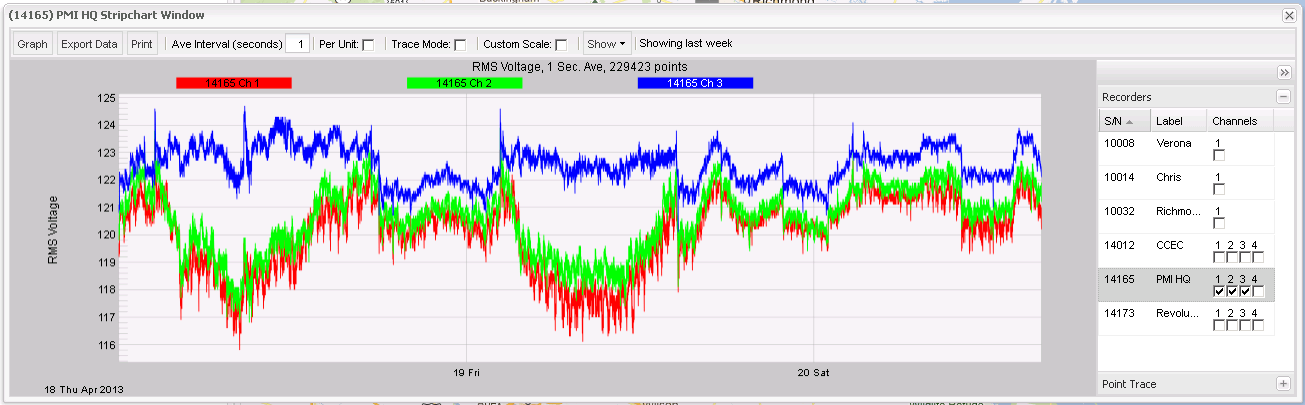
Channels on a Revolution graph can be enabled or disabled. Channel 4 will often have data that is very different from the other channels, and disabling it will make the graph auto scale better. Figure 1 shows a voltage stripchart that has been graphed without channel 4. To disable or enable a channel, open a Revolution menu window and click Stripchart. Next, click Voltage on the menu that appears. This will open a voltage stripchart. On the right hand side of the graph window, click on the appropriate checkbox next to the recorder’s name to select or deselect Channel 1, 2, 3, or 4. To select or deselect multiple channels at once, hold down shift while clicking on channel checkboxes. Release shift to graph the selections. The channel selection feature is handy when you would like to overlay multiple channels on the same graph for comparison, or when it is necessary to analyze just one channel. This also makes it possible to overlay and compare different channels from multiple devices and locations.
Daily Profile Graphs
Canvass Revolution graphs have many differences when compared with Provision graphs, including extra features such as improved capabilities using Daily Profile Graphs. Like ProVision, Canvass daily profile graphs use a 15-minute averaging window, where the x-axis on the daily profile graph is broken up into 15-minute intervals. A handy feature added to daily profile graphs in Canvass is the “weekdays” checkbox (Figure 2). Enabling this will toggle whether or not weekends are included in the graphed data. This is useful because weekend readings are often significantly different than weekday readings. Commercial/industrial loads are often much lower during the weekend, and can skew a daily profile if included.
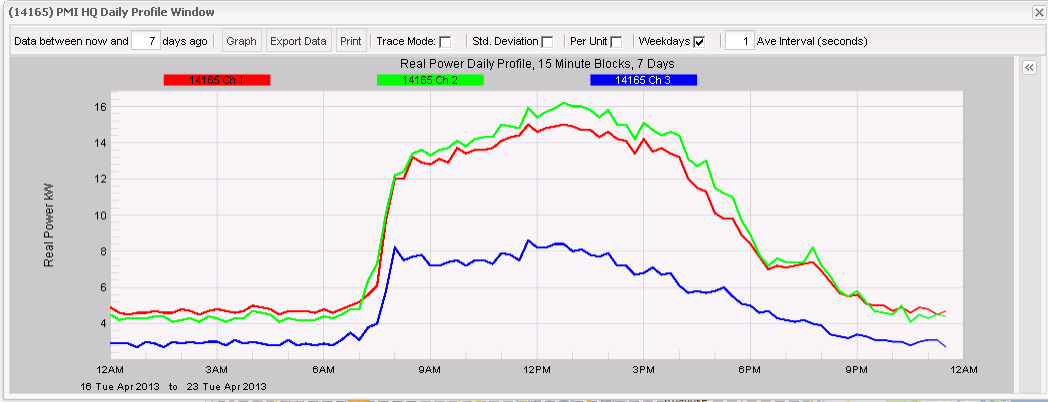
Canvass also makes it possible to graph arbitrary time spans in daily profile graphs, something that can’t be done with a recording file in ProVision. Simply input the number of days to be graphed in the text field next to the “days ago” text. The time span that can be graphed is only limited by how long the Revolution has been recording.
Histogram Graphing
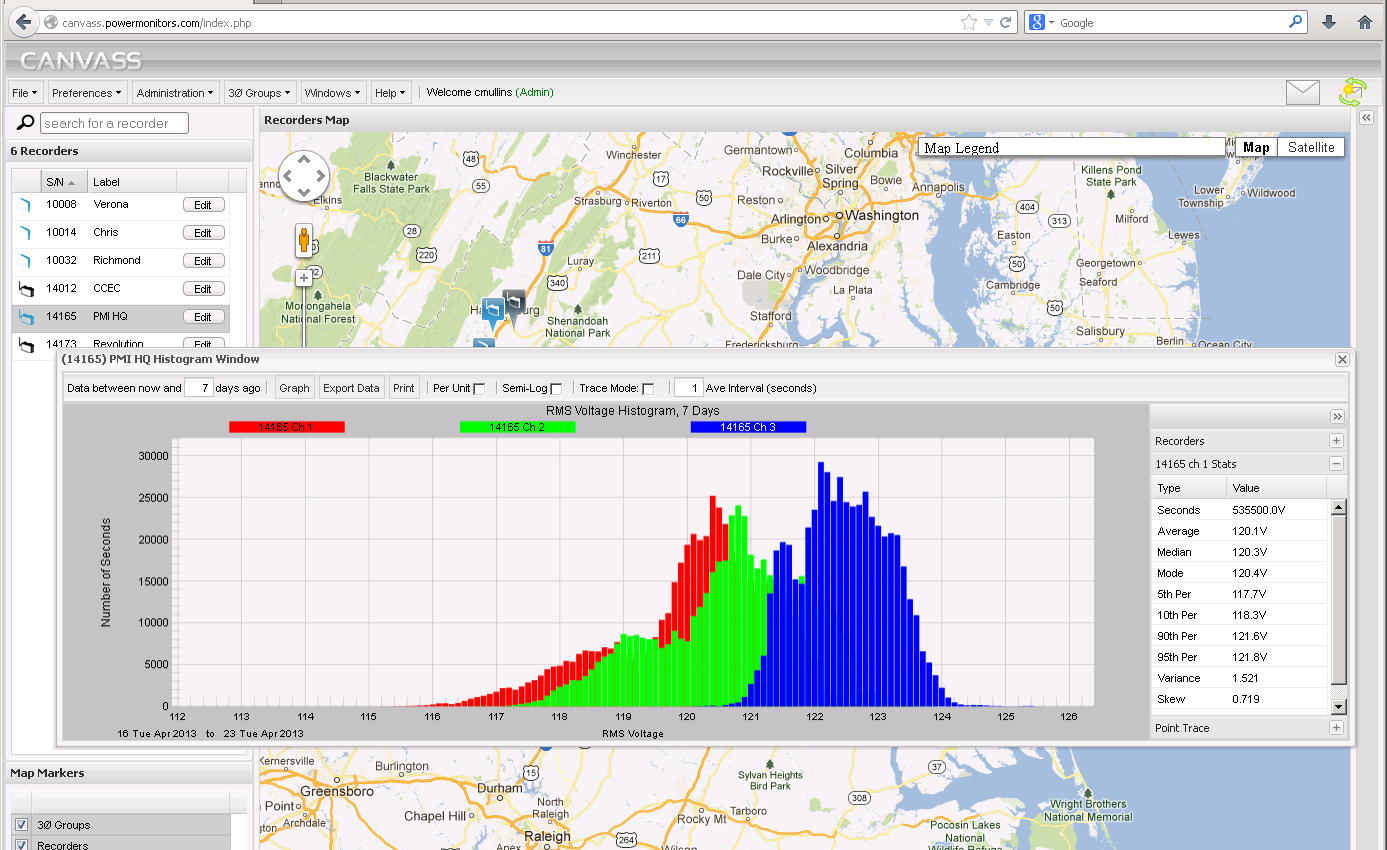
Histogram graphs in Canvass are based on one-second data intervals. There is no direct equivalent in ProVision, as its histogram graphs use either one cycle or one-minute intervals. The averaging interval can also be adjusted, e.g. it’s possible to set the graph to use one-minute averages. Doing this does not affect the resolution; it will always be one-second. Also exclusive to Canvass is the histogram stats panel (Figure 3), which contains useful statistical data. To open the stats panel, click the “+” button next to the panel label on the right hand side of the graph, under the recorder’s selection panel. The information shown in this panel always represents the first channel that has been graphed. For instance, graphing channels 2, 1, and 4 of a Revolution will cause channel 2 statistics to be shown. Averaging windows and statistics are possible in Canvass because a full history of Revolution data is saved in the Canvass database, compared to individual spot recordings with ProVision.
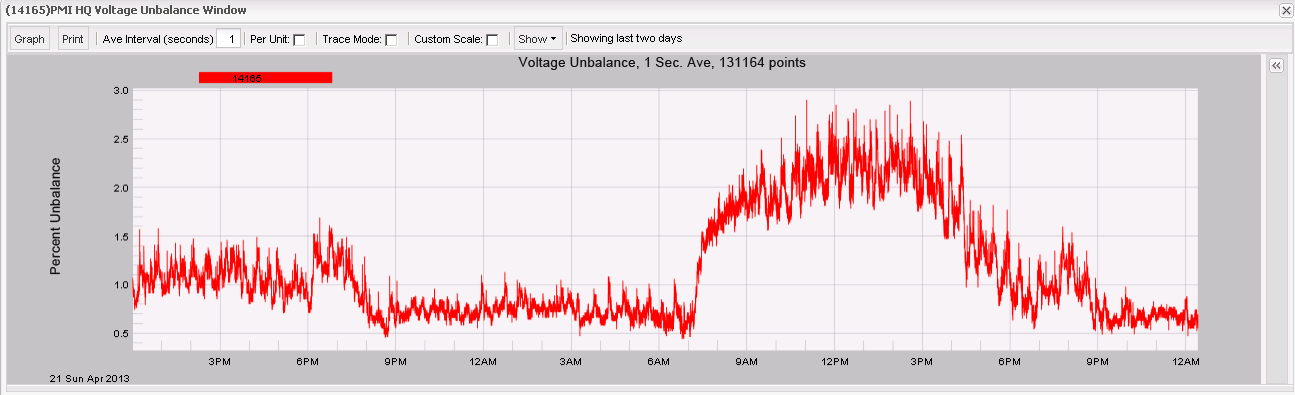
Stripcharts in Canvass do not have one cycle min and max traces; they use one-second averages. There is not a lot of PQ information in these graphs; they are more appropriate for steady state monitoring. For example, the 3 phase voltage unbalance graph in Figure 4 is generated from 1 second average data stored in the Canvass database, rather than from single cycle fluctuations. The recorded data in ProVision is more suited for PQ studies. Canvass also does not collect waveform capture data, transient capture data, etc. All this data can still be found in ProVision.
Support
Canvass subscriptions and support for Revolution must be purchased through PMI. A free firmware upgrade must also be installed to enable network-ready Revolutions to use Canvass.
Conclusion
Canvass support adds a new dimension to data analysis and ease of use with the Revolution. Additional white papers on Canvass are available by clicking HERE. Contact your PMI equipment rep for more information on subscription pricing and the benefits of Revolution support in Canvass.