Abstract
This white paper describes the best recorder setup for investigating a harmonics complaint or evaluating utility and customer compliance to IEEE 519 harmonic distortion limits.
Determining the objectives for a power quality monitoring session prior to installing a recorder can have a direct impact on instrument setup, selection of a monitoring location, and evaluation of recorded data. This is especially true when evaluating PQ issues that require calculations of various power system parameters for comparison to recommended limits in IEEE standards, or evaluation of utility and customer effects on electric system voltage quality. Recorder initialization should therefore include settings that are directly applicable to the specific power quality problem being investigated.
An effective evaluation of customer harmonic current pollution and its effects on system voltage distortion and equipment operation requires specific data collection during the recording session. This necessitates the selection of appropriate harmonic measurements during recorder setup which may not be included in the recorder’s default settings.
Descriptions follow of harmonic related measurements that are selectable during recorder initialization.
VTHD Interval Graph: Voltage Total Harmonic Distortion
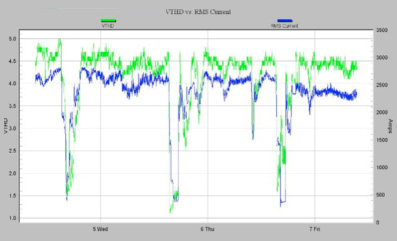
A graph of VTHD (harmonic RMS voltage as a % of fundamental voltage) vs. time/date during the recording session. This can be used for comparison to the IEEE 519 recommended limit of 5% VTHD (≤69kV at PCC), and for correlation with customer load current variations to help identify the source of harmonic voltage distortion.
ITHD Interval Graph: Current Total Harmonic Distortion
A graph of ITHD (harmonic RMS current as a % of fundamental current) vs. time/date during the recording session. This measurement indicates the harmonic distortion of the current waveform during the recording session. Note that since this distortion is expressed as a percentage of fundamental current, this measurement can exceed 100% during light loads.
Harmonic Interval Graphs
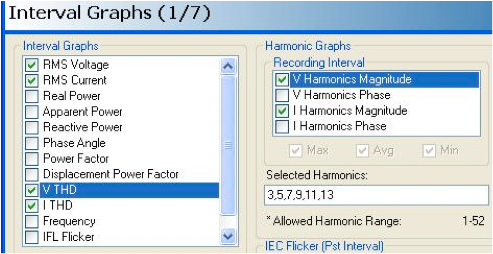
The magnitude and phase of individual voltage and current harmonics can be recorded as time interval graphs. Individual current harmonic magnitudes (amps, not %THD) are required when comparing utility customer harmonic current levels to IEEE 519 limits, which lists allowable harmonic current distortion as a percentage of IL, the average maximum customer demand current. Since IL is a fixed value for an individual customer, harmonic current magnitudes must be measured for computing individual harmonic distortion and total demand distortion (TDD).
Waveform Capture Harmonic Distortion
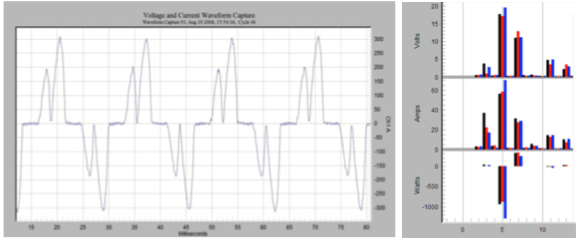
Captured voltage and current waveforms can provide valuable supplemental information for harmonic investigations. The waveshape or signature of captured current waveforms can identify the type of nonlinear loads being measured. VTHD, ITHD, and individual harmonic content of any stored voltage or current waveform can also be evaluated.