
Abstract
Oscillatory transients are caused by switching operations, nearby lightning strikes, or other impulsive noise exciting electrical resonances present on the network. The most common in the distribution system is defined by IEEE 1159 as low frequency (under 5 kHz), and is often caused by capacitor bank switching. The peak magnitude of the voltage can rise to up to twice the normal value.
Despite the high peak voltage, capturing a short-lived transient can be difficult with traditional RMS-based waveform capture triggering. Waveshape triggering is much more suited to capturing these transients.
Waveform data captured using PMI’s Seeker PQ recorders will be used to calculate the ring frequencies of several different types of oscillatory transients. Additionally, these techniques can be applied to resonances formed by other phenomena. The data that is obtained from this process can be used to adjust the electrical characteristics of the circuit to mitigate the effects of ringing.
Oscillatory Transients
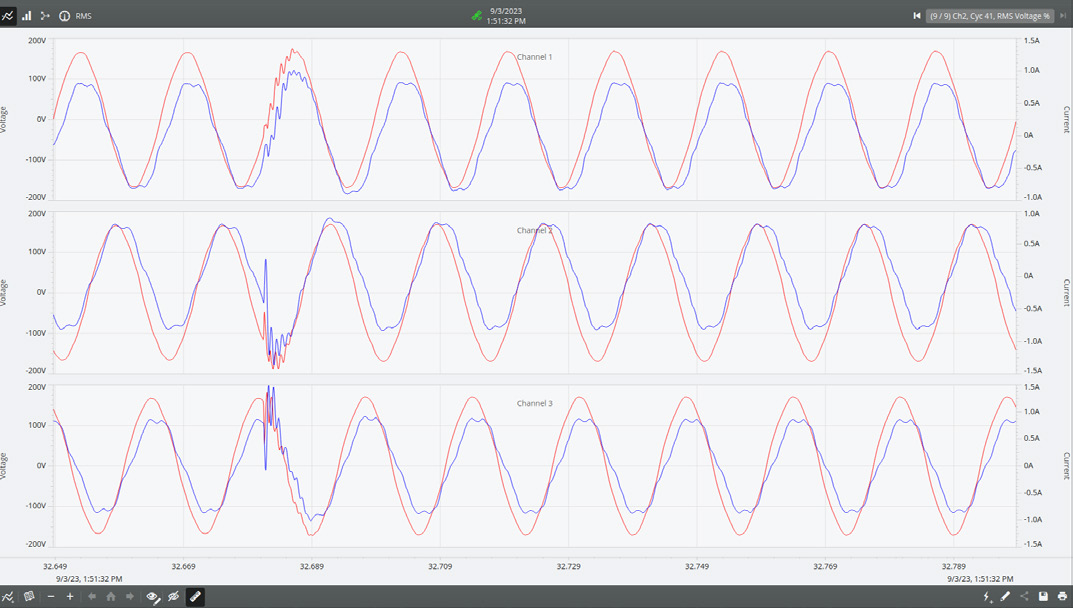
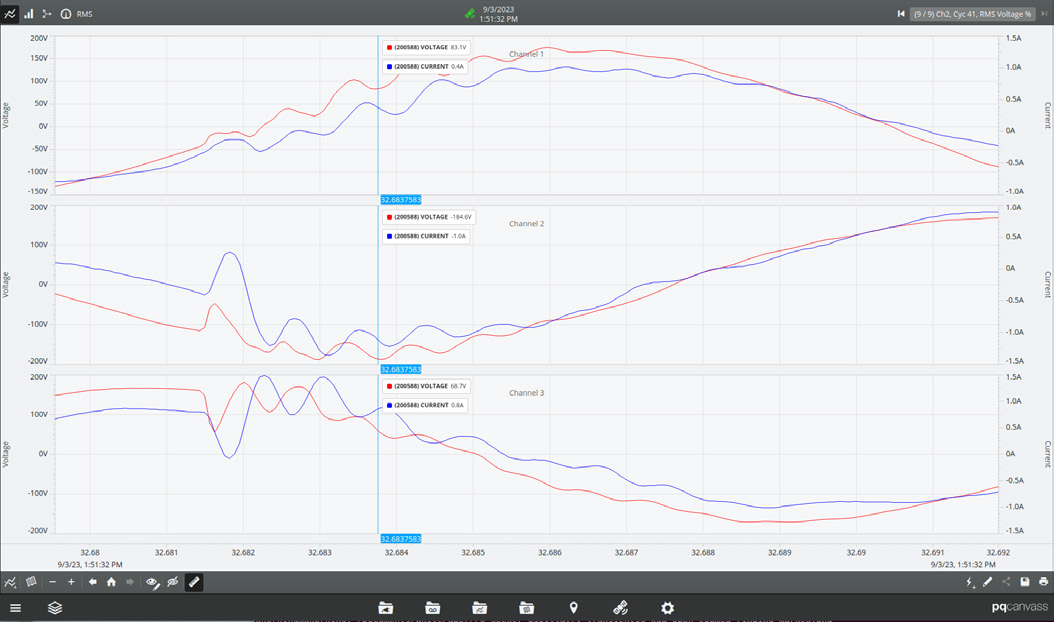
A typical oscillatory transient is shown in Figure 1. Likely a capacitor bank switch upstream has created an impulse that activated a system LC resonance, formed by the capacitor and local inductance from loads and transformers. This resonance causes the voltage to ring at the resonance frequency. This ringing persists for several of its periods, with the exact duration depending on the damping introduced by line and load resistance.
A heavily damped resonance may not last for even a full period, while a very underdamped ringing can last for 10 milliseconds or more.
Waveforms Data Collection
It is necessary to obtain waveform data of the oscillatory transient event in order to estimate the frequencies resonant in a circuit. Waveform capture is a triggered data type; to capture a waveform during an oscillatory transient a trigger condition must be met in the recorder during that time.
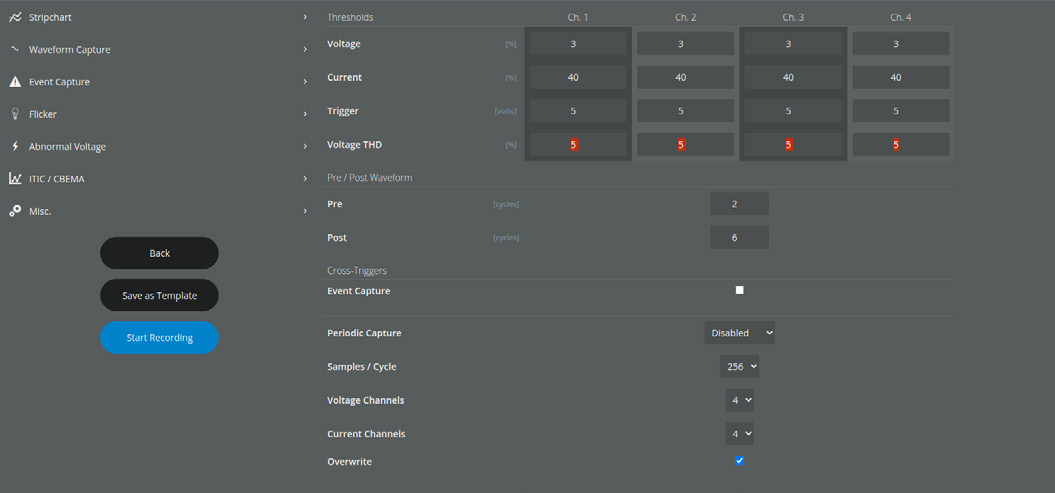
The Seeker supports waveshape triggering, which is based on changes in voltage total harmonic distortion (THD). This is the best method of recording a ringing event, since it is very sensitive to changes in frequency content. To adjust the threshold for this, adjust the “Voltage THD Threshold” values in the waveform capture setup in the new recording window, as shown in Figure 2. This triggering mechanism uses THD to measure voltage waveform variances from one cycle to the next. A threshold can be set that allows changes in the THD to trigger a waveform capture thus concisely recording the desired data. A threshold setting between 2% and 5% should be used for best results.
Finding and Isolating Resonances in Waveform Data
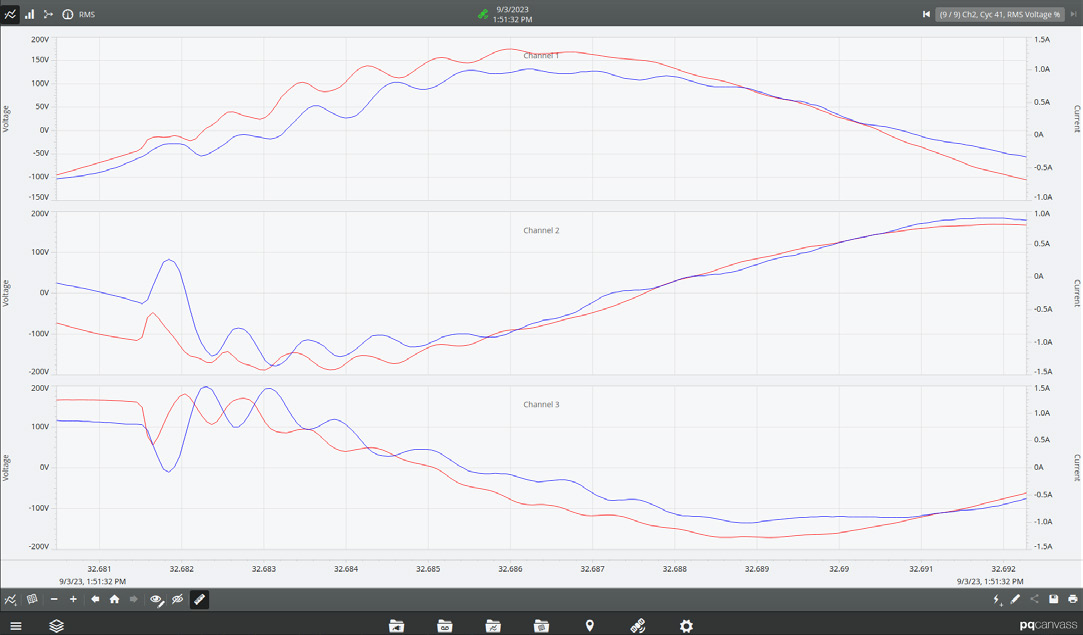
In PQ Canvass select the recording of interest and choose the Waveform Capture button. A list will appear showing all of the waveforms recorded during the session. Select the first waveform and click OK. The entire duration of the captured waveform will be displayed. For a long capture, the level of detail visible may not be enough to immediately see that a disturbance is a ringing event. In this case, click and drag on a section of the waveform to zoom as in Figure 3.
If there are multiple waveforms in the set, use the “Page Down” key to switch to the next waveform capture in the set and visually scan until a resonance is found. Zoom in on the waveform to bring the entire oscillatory transient into view. Make sure the “Show Legends” button is pressed. The individual data points that were collected can now be inspected.
Estimating Ring Frequency
Now that the view is prepared, it is time to collect the data points that will be used for estimating the ring frequency. To calculate this frequency it is easiest to measure the time delta from peak to peak within the selected resonant period. Either the positive or negative peaks may be used, as long as the same direction is used for all measurements.
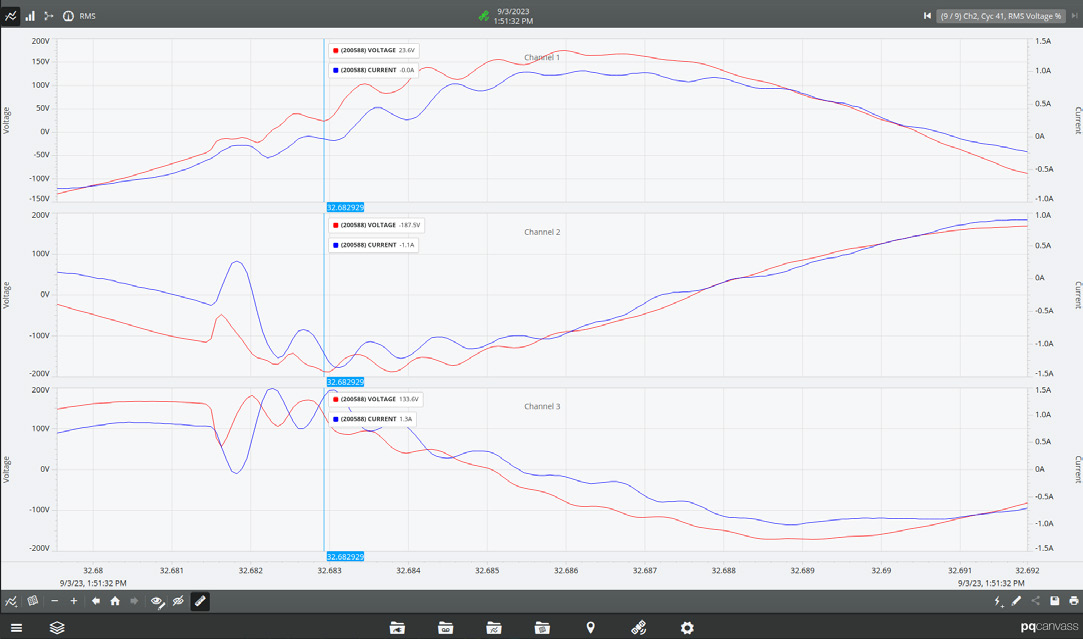
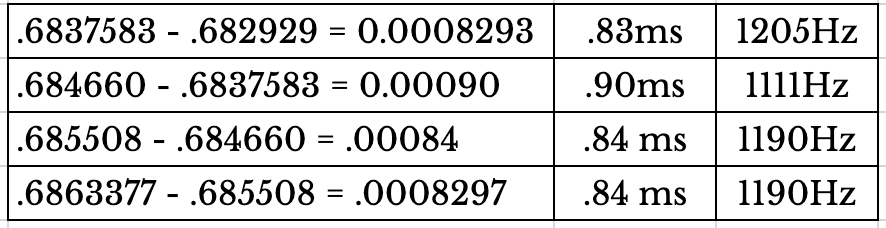
Find the first peak of the resonance and hover the mouse over the point. The legend will show the time value (Figure 4). Once found, write down the time value (in milliseconds) as indicated in the legend. Continue collecting data by recording the times of each subsequent peak of the same polarity (Figure 5). Averaging the times of the peaks we get 0.85ms.
To estimate the ring frequency we can use the equation:
F =
where the period P is measured in milliseconds, and the frequency F is in Hertz. Using the point calculations obtained from the previous step, find the interval between each peak and substitute each for P in the previous equation.
With P = 0.85, from the calculations we can see that the ring frequency is around 1176 Hz. For very high resonance frequencies (over 2 kHz), the quantized time resolution from the sampling process itself may reduce the estimate accuracy. To improve accuracy in this situation, use multiple periods of the ringing, or average multiple individual periods.
Using the Harmonic Magnitude Plot
Press the “Harmonics Graph” button. A “Harmonic Magnitudes” graph will appear.
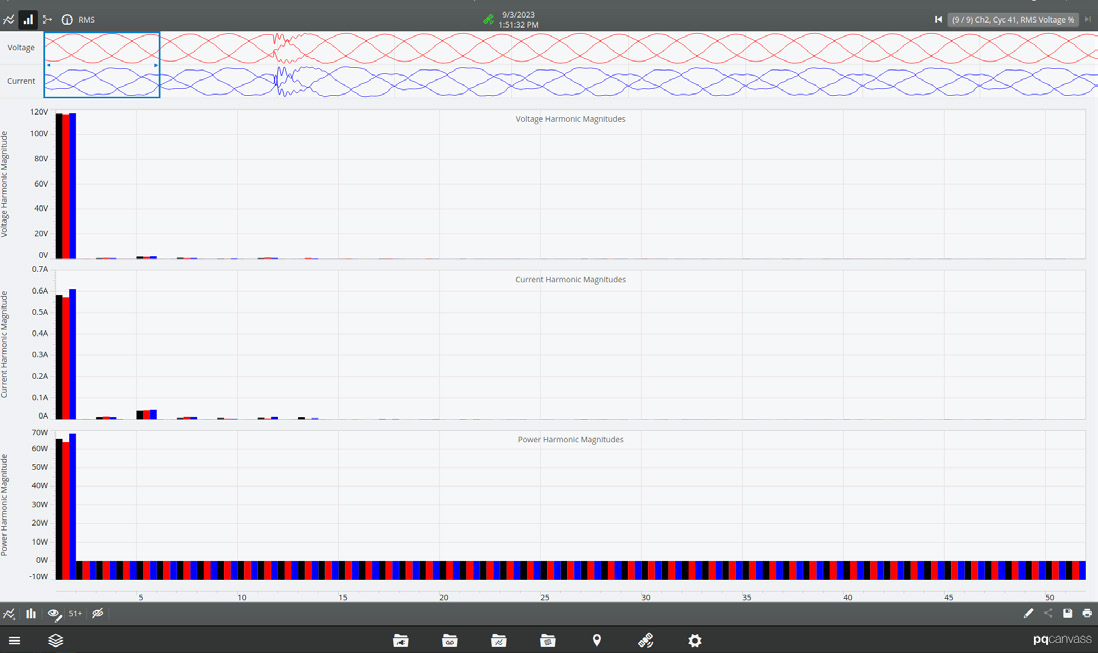
Press the “Hide Fundamental” button or type F to turn off the fundamental as shown in Figure 7. Move the one cycle window selector (blue rectangular box at the top of the Harmonic Magnitudes window) over the section of the waveform that contains the ringing.
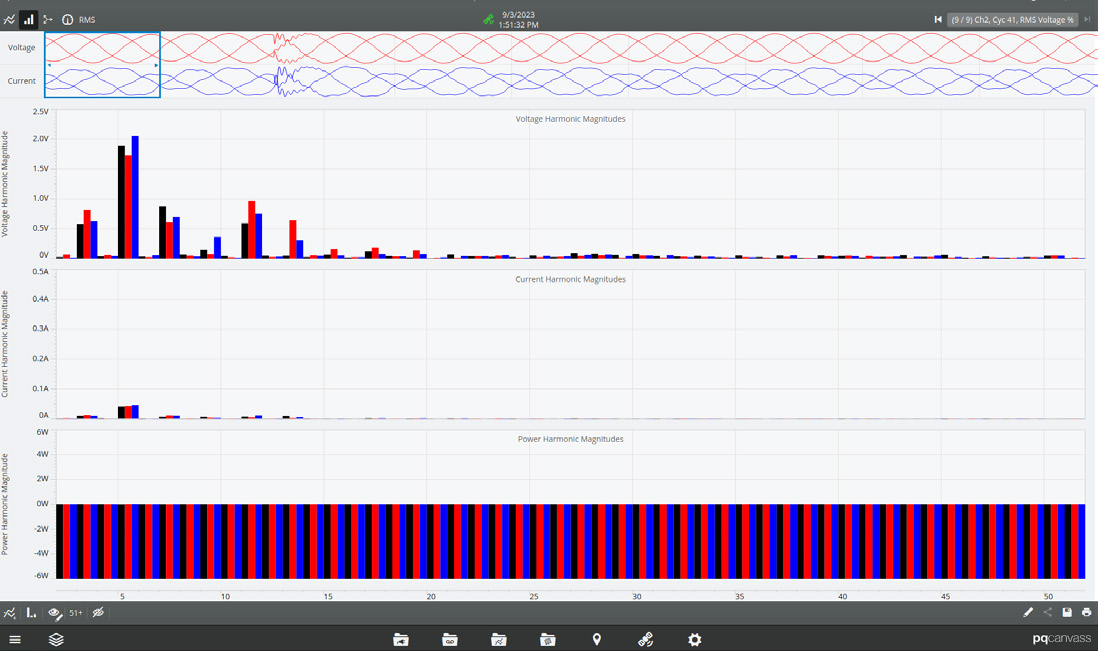
Move the one cycle window selector (blue rectangular box at the top of the Harmonic Magnitudes window) over the section of the waveform that contains the ringing.
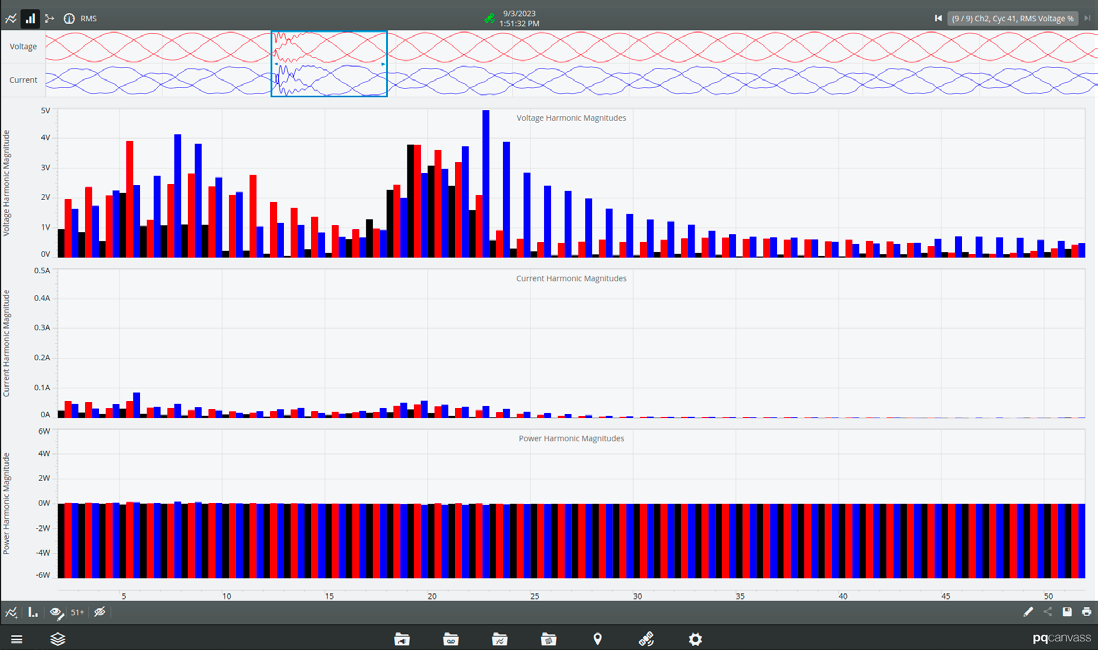
The ring frequencies found in Table 1 can be compared to the plot of the harmonic graph by dividing each frequency found by 60Hz.
1176/60 = 19.6
In the example plot the ring frequency is centered around the 20th harmonic. The 20th harmonic is at 1200Hz. This frequency is a good place to start when designing filters or trying to reduce the effects of the resonances.
Conclusion
The ring frequencies of resonant circuits can be discovered by manual analysis of waveform data using PQCanvass. The Harmonic Magnitude plot can be used to verify our estimate. Resonance frequencies that fall on common current harmonics values, such as 180 Hz or 300 Hz (3rd or 5th harmonic), may give rise to excessive voltage distortion. Knowing the resonance frequency of a circuit is important for heading off or fixing voltage distortion problems.