
Abstract
Reclosers are electrical utility devices used to isolate faults occurring in an electrical grid. In their operation, if a fault is detected, they may disconnect and reconnect power several times. From the utility customer’s point of view they may experience voltage sags and swells during this time. These sags and swells can be easily viewed when these events are plotted on an ITIC curve, also known as a CBEMA curve. The ITIC curve simplifies these events into single points representing duration and magnitude. This whitepaper will explore why these recloser operations produce events that violate the ITIC curve.
ITIC Curves
The ITIC curve evolved from the CBEMA (Computer Business and Equipment Manufacturers Association) curve which was originally created back in the 1970’s. This curve was used as a guideline for computer manufacturers when creating power supplies to ensure they were robust enough to withstand the deviations in incoming power. From the beginning, this curve was created as a guideline for equipment and not a power quality standard for utility companies.
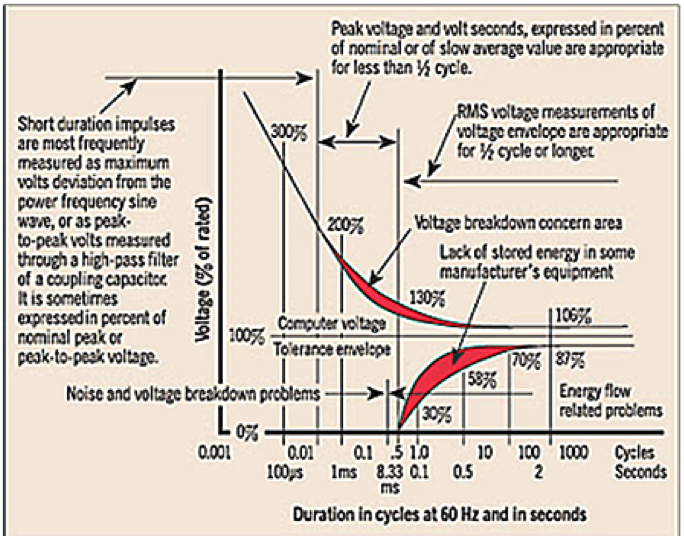
The CBEMA curve shows similar information to the ITIC curve but has regions where there are accepted tolerated voltage swells and sags shown in the red areas of Figure 1. Products operating in these regions, even if they follow CBEMA curve guidelines, could differ greatly in their ability to operate at similar input voltages. This could be shown in their ability to ride through a voltage sag or breakdown and stop working when the voltage spikes or swells. To remove this ambiguity and to develop a more definitive standard, the ITIC curve was created.
The ITIC (Information Technology Industry Council) curve was developed in the 1990’s. This deviation from the original CBEMA curve was created to clear up some of the ambiguity in the power constraints when designing equipment. This curve has clear boundaries around accepted voltage swells and sags removing the vague regions in the CBEMA curve. The ITIC curve has three distinct regions: No Interrupt In Function Region, No Damage Region and the Prohibited Region. These three regions as well as the ITIC curve can be viewed in Figure 2.
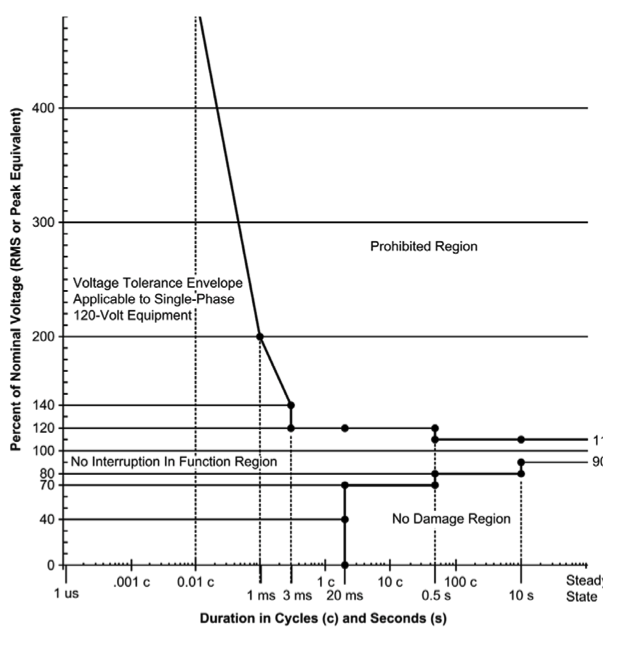
The curve is semi-logarithmic where the x-axis depicts the time scale in units of cycles and seconds in a logarithmic scale. The y-axis shows a percentage from 0% to 500% in an arithmetic scale where 100% is the nominal voltage. As seen in Figure 2, equipment must be able to handle large transient voltage fluctuations and incur no interruption of function. As the time scale increases, voltage fluctuations which are large in magnitude may land in the No Damage Region, or the Prohibited Region. Fluctuations that occur in the No Damage Region, intuitive from its name, should not damage the equipment. Equipment that experiences sags in this region may turn off, or reset, but they will remain operable once the incoming voltage returns to the nominal level. On the other hand, fluctuations occurring in the Prohibited Region may cause irreparable damage to equipment. These swells can overload machinery and electronics to the point where they will not be operable even when the voltage returns to the nominal level.
Recloser
A recloser is a high voltage switch used by utilities to isolate issues in an electrical grid. Ideally, once a fault is detected, the recloser will open which momentarily disconnects power for the utility’s customers. After a short period the power is restored and the fault is cleared. In some cases, the fault is not cleared once power is restored. In this instance, the recloser may activate several more times, and if the fault is still not cleared, the recloser will lockout. The utility will need to send a crew out to correct the cause of the fault and reset the recloser to restore power.
Reclosers can be activated by many different high current fault conditions. Some examples of temporary faults include conductors touching each other in windy conditions, lightning surges, animals and tree branches. In these scenarios there will either be a short between energized lines, or to a grounded point. Often, when any of the above conditions happen, the line will be able to clear the hazard, or it will clear on its own and resume operation without the need to send a crew out. Other more extreme faults such as a down power line or a tree falling on the line can cause extended power outages which will require the attention of a utility crew.
Recloser Events on ITIC Curve
Whether the fault is temporary or extended, the utility’s customers will observe disruption in the voltage whilst the recloser is operating. These disruptions can range from a total loss of power when the recloser is open, a sag in voltage or even a voltage swell.
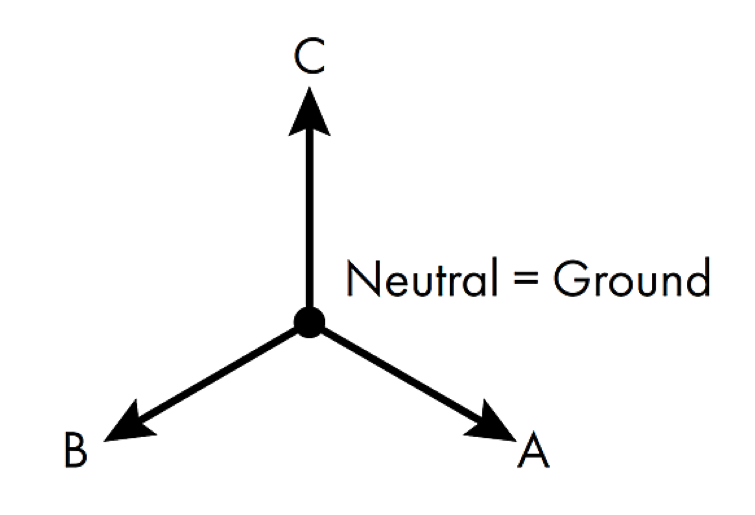
Consider the 3-phase system shown in Figure 3. The neutral has the same potential as ground and phases A, B and C are 120 degrees apart.
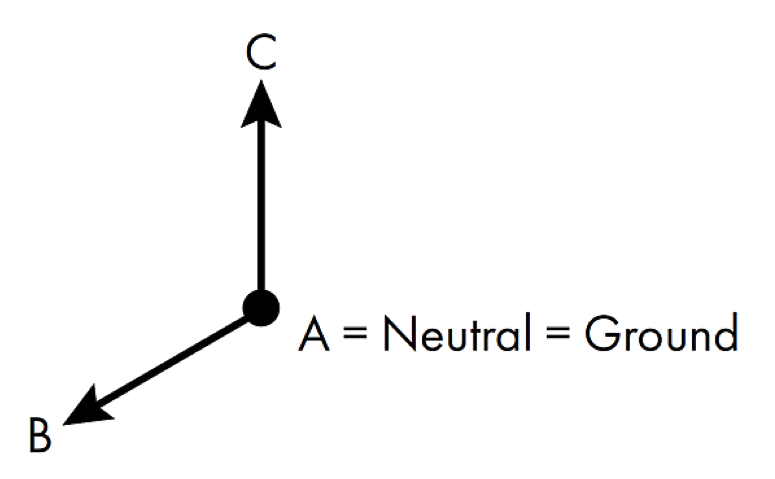
In the ideal situation, if phase A experiences a line to ground fault, phase A will have the same potential as ground and the recloser will open immediately. This will cause all customers on phase A to experience a sag, then an interruption while the customers on phases B and C will experience no disruption in service. This can be seen in Figure 4.
Realistically, the electrical system will be grounded at several points throughout the system. So, if a line to ground fault occurs on phase A, as shown in Figure 5, all customers on phase A will experience a voltage sag. This fault will cause the neutral point of the circuit to shift away from the ground/neutral point of the substation, and closer to phase A. Conversely, this will cause the distance of the other two phases from neutral to increase, thus causing a voltage swell on the other two phases. Once the recloser opens, phase A will be disconnected causing a loss of power for that phase, and the other two phases will return to their nominal voltage.
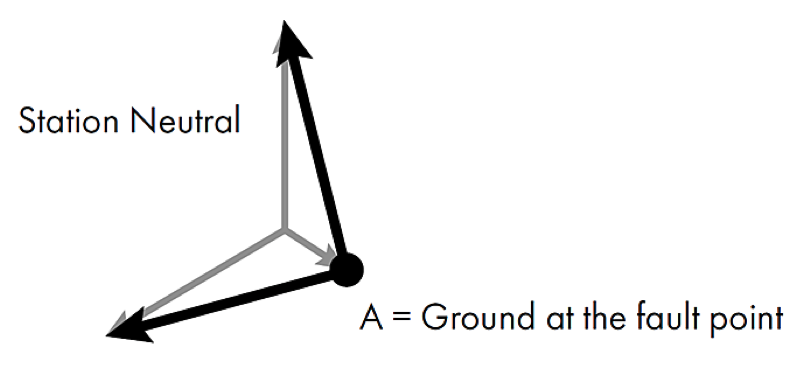
An example of what these sags may look like on an ITIC curve can be seen in Figure 6. There are two voltage sag events located in the No Damage Region which could possibly have caused devices connected to this phase to turn off or reset. This ITIC curve was provided by a recording taken by a Revolution and viewed in PMI’s Provision software.
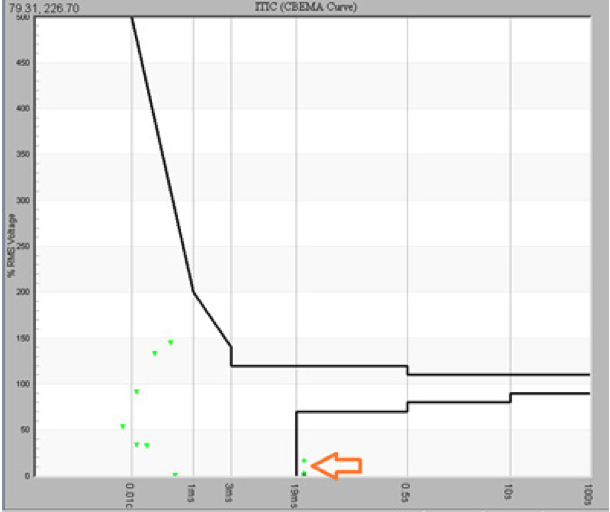
Conversely, from the previous example, if the duration and magnitude of the swells were great enough, they could potentially land in the Prohibited Region, which could cause irreparable damage to devices that aren’t properly protected.
Unfortunately the ITIC curve isn’t compatible with normal recloser operation. Reclosers prevent more serious power quality problems like extended outage for customers, so their operation is important for overall grid performance. If the breakpoint at 70% retained voltage were moved from 20 ms to possibly 120 ms, and the upper voltage range of 110% went to 115%, much greater compatibility would be achieved between delivered voltage and equipment designed to the ITIC minimums.
Conclusion
The ITIC curve is a useful tool to easily convey the duration of voltage sags and swells to the utility and its customers. The recloser is a piece of equipment that utility companies use toprotect their equipment and their customers when faults occur on an electrical system. When a fault occurs, the system will experience voltage sags and swells of various duration and magnitude. The recloser will attempt to clear the fault before completely locking out if it’s found that the fault requires manual intervention. During these recloser attempts the voltage sags and swells will be reintroduced into the electrical system on each attempt. These recloser operations will cause the voltage levels to deviate from their nominal levels which can violate the ITIC curve.