Abstract
The “out-of-the-box” ProVision layout is designed for general use. Fine tuning and customizing the ProVision environment streamlines PQ analysis and maximizes use of the screen workspace. We will explore the many customization features in ProVision, and show a suggested power user environment that illustrates many of the tuning adjustments presented below.
User Interface
ProVision’s user interface is highly customizable. Toolbars may be moved, hidden, and even created from scratch. The various panes such as Devices and Properties may be moved, set to auto-hide, or hidden entirely. In this section, we will cover customizing ProVision for a better user experience.
Pane Management
Panes are subsections of functionality within ProVision, such as the Devices pane, which contains functionality for interacting with recording devices, and the Explorer pane, for managing recordings, views, custom graphs etc. Panes can be “pinned” or made to be always visible, set to “auto-hide” which makes them collapse to a button when not in use, and hidden entirely.
Hide/Show Panes
The first thing to do when customizing a fresh install of ProVision is to hide the “Shortcut Bar”, which you’ll see along the right edge of the window. This feature is no longer needed (See “Adding Custom Toolbars” below).
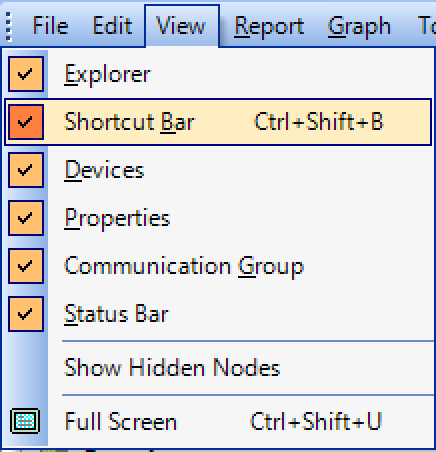
To hide the Shortcut Bar, click “View” at the top of the window. You will notice a list of panes with checkboxes next to them. Those with checkboxes will be visible in the application. Click “Shortcut Bar” to uncheck/hide that pane (See Figure 1). You’ll notice it has disappeared from the right edge of the window.
Pin/Auto-Hide Panes
Panes may be “pinned”, which makes them remain visible. Panes can also be “unpinned” or set to “autohide”, which causes them to collapse into a simple button when not in use. To view an auto-hide pane, hover over its button.
By default, the Explorer pane is pinned, and the Properties and Shortcut Bar panes are set to auto-hide. To pin an auto-hide pane, click the “push pin” icon at the top-right of the pane. To make a pane autohide, simply click the same push pin icon again (See figures 2 and 3, respectively).
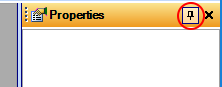
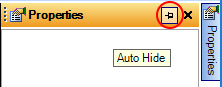
We recommend pinning the Properties pane, which displays the properties of a graph. This will cause the Properties pane to be docked along the right edge of the application window. We also recommend first setting the “Devices” pane to be visible by clicking View / Devices, and then pinning the Devices pane, if not already pinned. This should show up docked along the right edge of the Explorer pane.
Arranging / Grouping Panes
To make a pane into a free-floating window, drag the pane to the center of the application, or off to one side of the application if ProVision is not maximized. To dock a pane to the edge of the application, or to the edge of another pane, drag towards the desired edge until a vertical box outline appears along that edge, then drop the pane to dock it.
In order to maximize screen real estate, it is a good idea to either stack panes or group them together as tabbed panes to save space. In order to move or arrange a pane, it must be “pinned” first. To begin moving a pane, left-click and hold the pane’s title bar icon or text, and begin dragging it.
To stack one pane beneath another pane, drag the pane to the lower half of another pane until a box outline encompasses the lower half of the target pane, then drop. The vertical space previously occupied by the target pane will now be split evenly to accommodate the panes, stacked vertically.
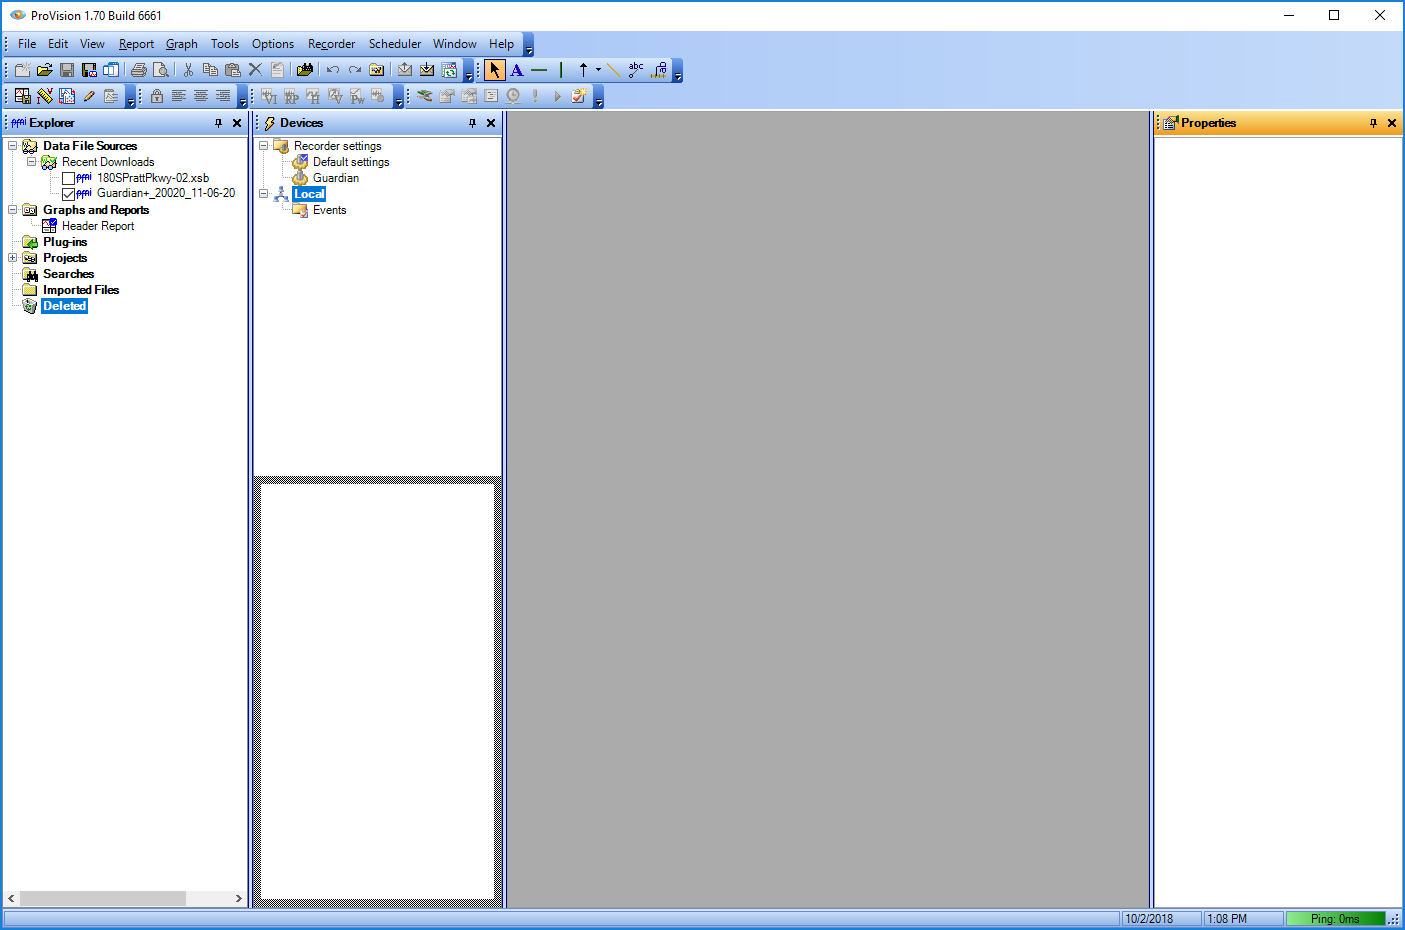
If you want to group panes, where more than one pane occupies an entire vertical space, you can drag one pane to the title bar of another pane. This will create tabs along the bottom of the pane, allowing you to swap between panes. This has the advantage of maximizing the workspace without crowding your panes. When grouped, multiple panes may be dragged and dropped together elsewhere on the user interface. To remove a pane from a group, simply drag and drop its tab off of the group.
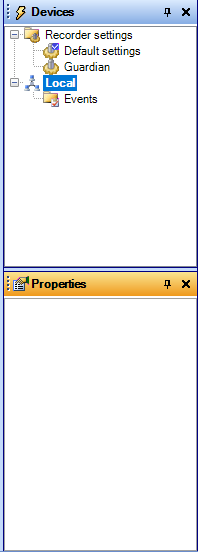
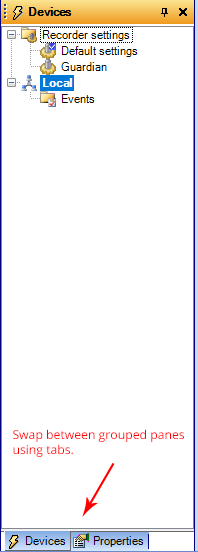
For larger screens, stacking panes may be your best option. Stacking gives you moderate space efficiency without hiding any functionality. Grouping panes are recommended for smaller screens such as on many laptops. In order to maximize screen real estate, all three primary panes (Explorer, Devices, and Properties) can be grouped together (See Figure 20).
Managing Toolbars
ProVision toolbars are extremely flexible. Toolbars can be customized, rearranged, moved, hidden and created from scratch. By default, all toolbars are enabled (visible) in ProVision, however not all of them will be needed by most users.
Hide/Show Toolbars
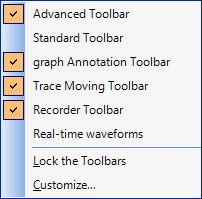
To view a list of toolbars, right-click anywhere in the top toolbar region of ProVision. This will display a menu listing all of the ProVision toolbars. Visible toolbars will have a checkmark to their left, and hidden toolbars will not. To toggle a toolbar’s visibility, simply click it in the menu. The “Standard Toolbar” and “Real-time Waveforms” toolbars are rarely used and can be hidden for most users. Note that the “Menu Bar” toolbar, containing the “File”, “Edit”, “View”, etc. menus cannot be hidden, but is customizable.
Moving/Rearranging Toolbars
When unlocked, toolbars may be dragged and dropped anywhere in the toolbar region at the top of the ProVision application, or may be dragged to left, right, or bottom edge of the ProVision window in order to create a new toolbar region (See Locking / Unlocking Toolbars below). Toolbars within regions at the left and right edge of ProVision will display their buttons aligned on the vertical, the default region at the top edge, and a region along the bottom edge of ProVision will arrange buttons horizontally.

Customizing Toolbars
In addition to hiding and arranging toolbars, you can control exactly which buttons are visible on any visible toolbar. To edit a toolbar, click the toolbar’s menu button (See Figure 9), then click “Add or Remove Buttons.” If customizing the “Menu Bar” toolbar, you will see only the “Menu Bar” option, and “Customize.” To hide/show buttons on the Menu Bar, you would click “Menu Bar”. When customizing any other toolbar, you will see a list of all visible toolbars after clicking “Add or Remove Buttons.” Select the menu you wish to customize, then select the check or uncheck buttons you wish to show or hide, respectively.
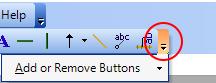
We recommend if you are not using the Scheduler feature in ProVision, removing it from the Menu Bar. In order to remove this from the menu bar, click the context menu button on the Menu Bar, click Add or Remove Buttons, click Menu Bar, then click “Scheduler” to uncheck this option.
Adding Custom Toolbars
You can also create custom toolbars containing any of the available ProVision commands. To create a toolbar, right-click in any toolbar region, and click “Customize…” In the Customize dialog, click the “New…” button.
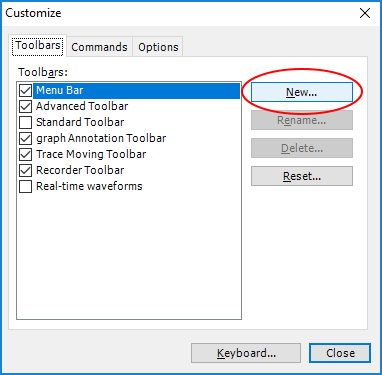
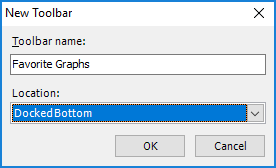
Clicking “New…” will open the “New Toolbar” dialog. Here you will enter a name for your new toolbar, and choose where it will appear in the application window (DockedTop, DockedBottom, etc.). Click “OK” to create your new toolbar. You should see the new, empty toolbar appear in the location specified, and will be returned to the “Customize” dialog. Now we need to add some commands to the new toolbar. Click the “Commands” tab, and you will see a list of all available commands. For this example “Favorite Graphs” toolbar, we’ll add two frequently used graphs to the toolbar. Click “Standard Graphs” in the left “Categories” list, then locate the “RMS Voltage and Current” graph at the right in the “Commands” list (See Figure 12 below).
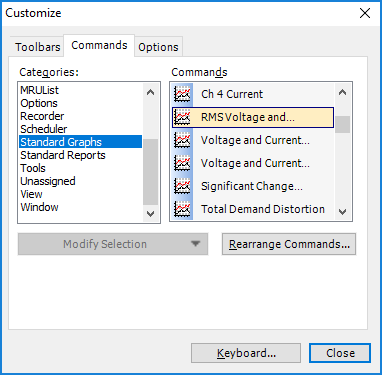
Click and drag the RMS Voltage and Current command to the new toolbar. We’ll also add the Total Power graph to the toolbar. When finished adding commands, click the Close button on the customize dialog.

Locking/Unlocking Toolbars
Once your toolbars are arranged how you like them, and you have created any custom toolbars, you can lock them, so they are never accidentally moved, dragged off the screen, etc. To lock the toolbars, right-click on any toolbar region, and click “Lock the Toolbars.” If toolbars are already locked, you will see a checkbox next to the “Lock the Toolbars” option. If the toolbars are already locked, clicking this option will unlock the toolbars, allowing you to move and make changes to them.
Keyboard Shortcuts
ProVision commands can be mapped to keyboard shortcuts as well. For example, if you frequently use a report, such as Energy Usage, you could drag this command to a custom toolbar for quick access (See Adding Custom Toolbars above), or you could add a keyboard shortcut to open this report (or both).
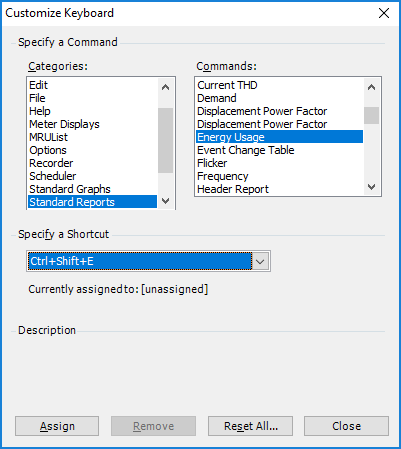
To add a keyboard shortcut, right-click in a toolbar region, and click “Customize…”, and at the bottom of the Customize dialog, click “Keyboard…” This will open the “Customize Keyboard” dialog. Here you can map any command to any key combination. We recommend using CTRL+SHIFT+[key] bindings to avoid conflicts with other built-in, or Windows keyboard shortcuts.
To add the keyboard shortcut CTRL+SHIFT+E for opening the Energy Usage report, click on “Standard Reports” in the Categories list on the left side of the Customize Keyboard dialog, then select “Energy Usage” in the Commands list to the right. Click the “Specify a Shortcut” dropdown, and select CTRL+SHIFT+E from the list. You will find this shortcut located slightly more than halfway down the list when scrolling. Then click the “Assign” button.
If you select one or more recordings, and press CTRL+SHIFT+E, you will get the Energy Usage report for those recordings.
Read more about toolbars and shortcuts in the white paper “Creating Custom Shortcuts in ProVision”.
Tab Groups & Views
ProVision displays all graphs and reports in a single tabbed interface, allowing you to switch between opened items. However, at times it might be useful to compare two items side-by-side, or more than two items if your screen size allows for it.
Splitting the View with Tab Groups
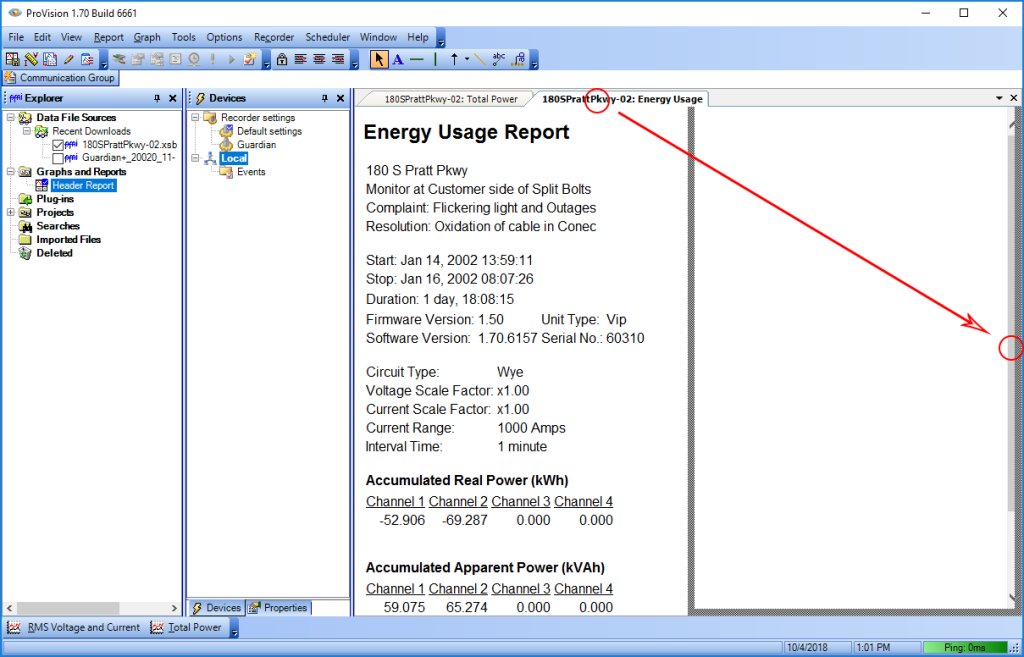
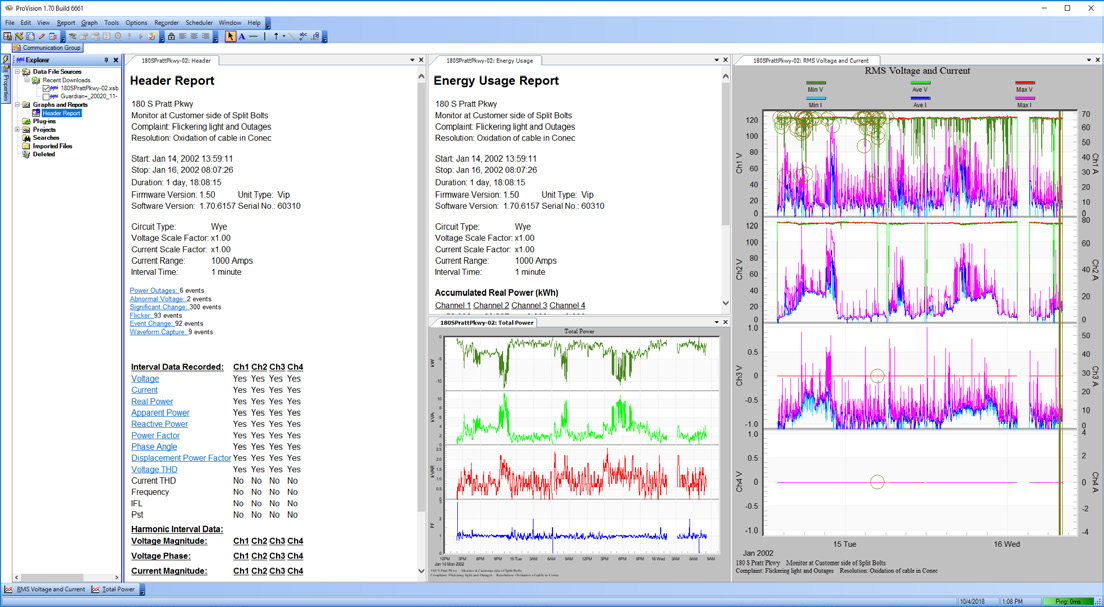
New tab groups can be created easily. When you have two or more tabs in a tab group, simply drag one of the tabs to the edge of the viewing area, or to one of the edges of another existing tab group (See Figure 15). When dragging to the left or right edges of the viewing area or another tab group, you will create a vertical tab group. When dragging to the bottom or top edges of the viewing area or another tab group, you will create a horizontal tab group. By dragging to the edges of another tab group, you can subdivide that group, which gives you virtually endless options for graph and report layouts (See Figure 16).
Saving a Custom View
If you find yourself creating a certain set of tab groups and layout over and over again to troubleshoot a specific type of problem, you should consider saving your layout as a “View.” A View saves a specific layout of tab groups as a reusable template which can be applied to any recording.
In order to save your current tab groups as a view, click “Tools” in the Menu bar, then click “Capture View.” An untitled View will appear in the Explorer pane, under Graphs and Reports. Type the name of your view here.
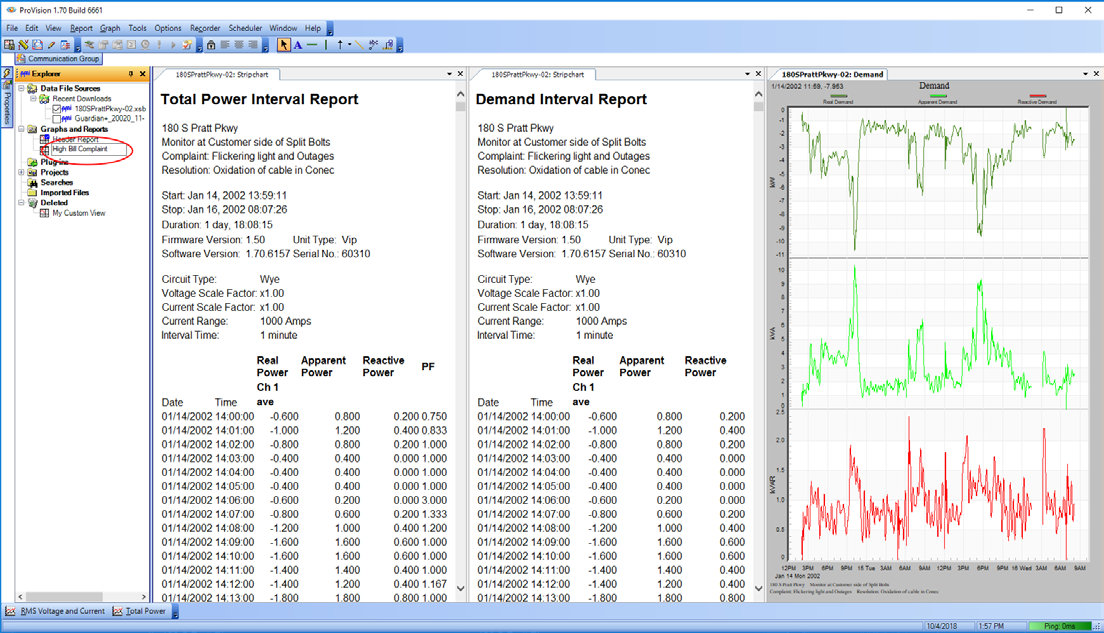
Let’s say you regularly need to investigate high bill complaints. For this, you may wish to create a custom view containing the Total Power Report, Demand Report, and Demand Graph. Select any recording, open and arrange these reports and graph, and capture this view as “High Bill Complaint.” From here on, you need only select a recording, and then double-click “High Bill Complaint” to view all relevant data from that recording.
Setting a Default View
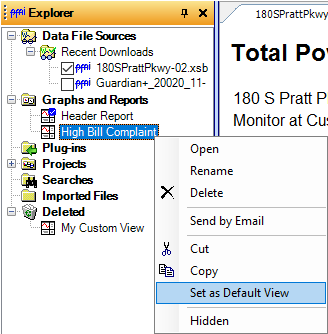
The default View in ProVision contains one report, the Header Report. The default view will be opened for a recording when that recording is opened in ProVision. If, however, you would prefer a different default view when opening recordings, you can set any custom View as the default by right-clicking it in the Explorer pane, and then clicking “Set as Default View.”
To read more about tab groups and views, see the white papers “Tabs and Windows in ProVision” and “Views in ProVision”.
Organizing Custom Graphs into Folders
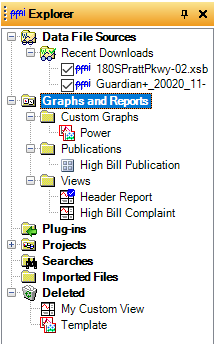
Once you have created or imported a sufficient number of custom graph templates, you will likely find that they are cluttering your Explorer pane. In this case, we recommend creating sub-folders under “Graphs and Reports” to organize your templates. To create a sub-folder, right-click on “Graphs and Reports” and click “Create Folder.” Type the name of the new folder and press ENTER. You can create sub-folders of sub-folders by right-clicking any sub-folder and clicking “Create Folder.” These folders can also be used to organize views and publications.
Conclusion
ProVision’s flexible, highly configurable interface allows you to customize its layout and organize its features in a way that bests suits your needs and workflow. The possibilities of customization are numerous and should make power quality analysis faster and more efficient.
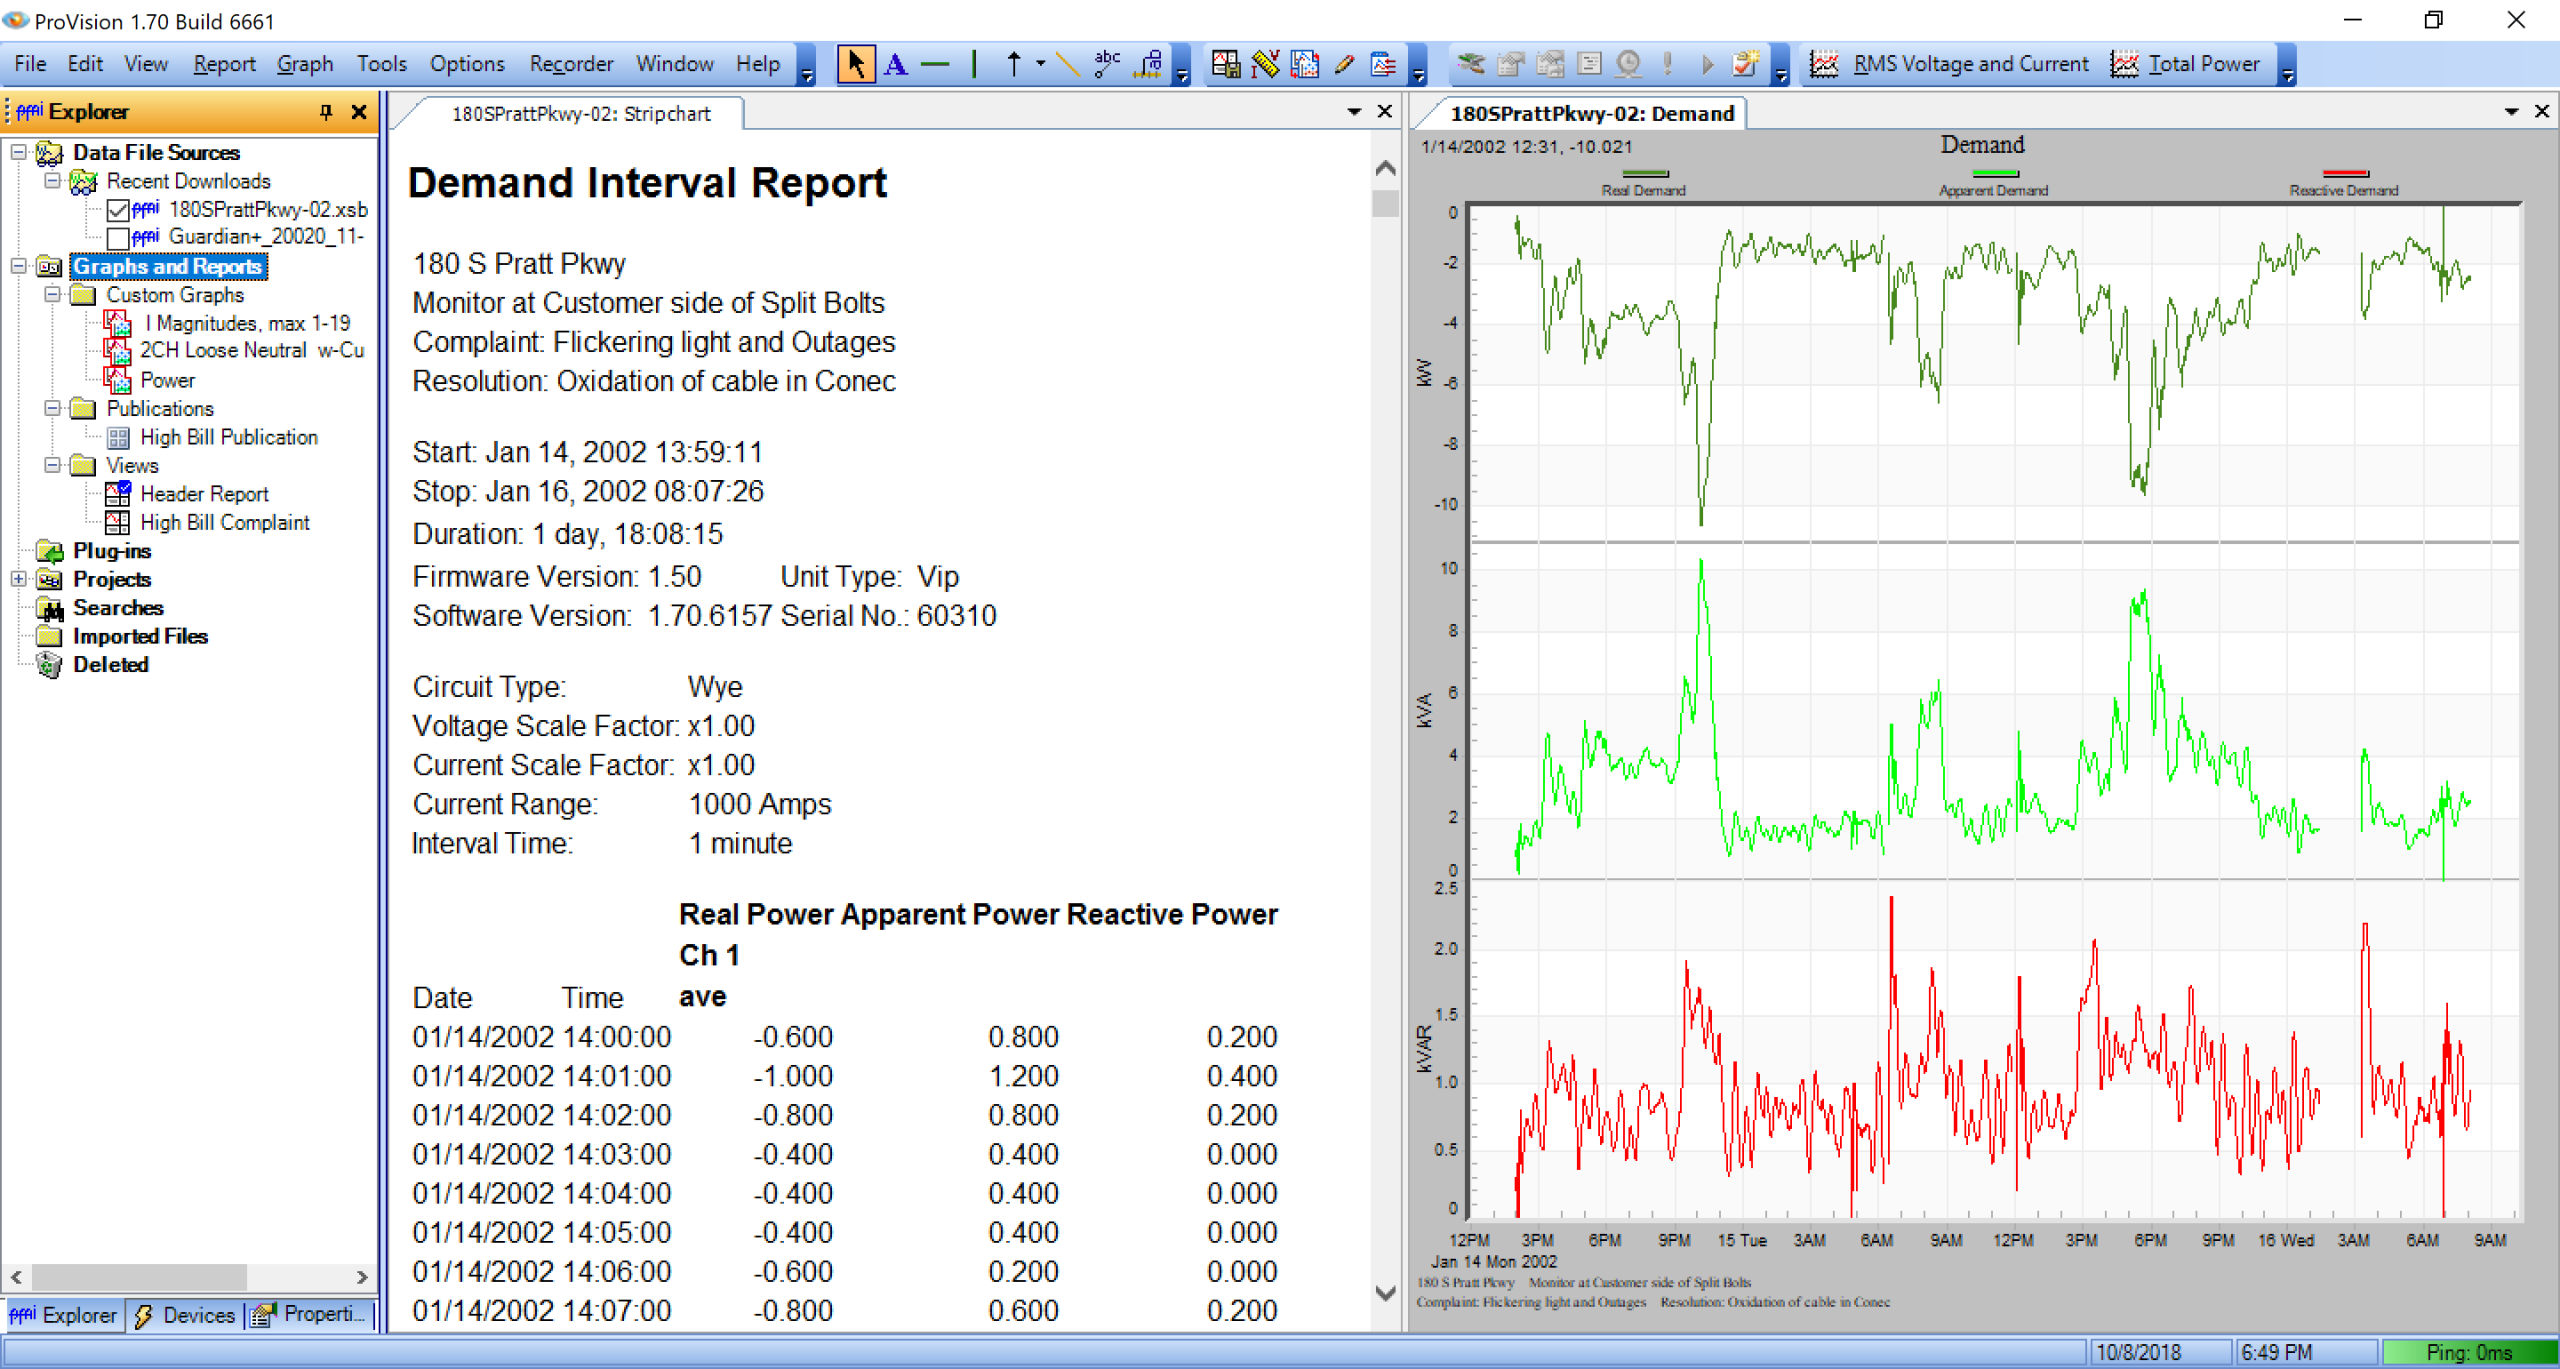
Figure 20 illustrates a fully customized instance of ProVision. Note that the toolbars are arranged into a single horizontal toolbar region at the top of the application. Unused toolbars have been hidden, the “Scheduler” feature has been hidden in the Menu Bar to minimize its space requirements, and the custom graphs toolbar has been placed at the right of this region. All primary panes (Explorer, Devices, and Properties) have been grouped at the left of the application, and have hidden the Communication Group pane. Custom graphs, publications, and views are organized into folders for easy access. This arrangement gives maximum screen real estate for viewing graphs and reports and places most commonly used features to be quickly accessed in the interface. We recommend trying some or all of these customizations on your own instance of ProVision.