Power quality investigations are often intricate, time consuming, and prone to oversight. Faced with a long duration recording, engineers must sort through an enormous volume of events, trends, and waveforms, and the sheer amount of information can make it difficult to decide where to begin or what to prioritize.
To address this challenge, Power Monitors, Inc. developed Merlin™—a Large Language Model–driven analysis tool built specifically for PMI power quality recorders. Merlin™ is designed to review all major elements of a PQ dataset and surface the most relevant issues, helping engineers move quickly from raw data to focused, actionable insight.
This white paper focuses specifically on how Merlin™ analyzes specific power quality focus areas and how those insights help guide a power quality engineer through their overall investigation.
Power Quality Focus Areas
When undertaking a power quality analysis, there are several areas of concern that the investigator needs to review. Merlin™ helps the investigator by providing a detailed, disturbance-focused overview for several of these key areas. These next sections highlight some of these key areas.
Flicker
The flicker focus area evaluates voltage fluctuations that cause perceptible changes in light output or process behavior, especially for lighting and visually sensitive equipment. Its purpose is to quantify the severity and frequency of these fluctuations, compare them against planning or compatibility limits, and relate them to system operating conditions such as load cycling or switching. This helps engineers determine whether flicker is likely to produce customer complaints or process disturbances and where corrective efforts should be prioritized.
Harmonics
The harmonics focus area examines waveform distortion by analyzing the harmonic spectrum and total demand or voltage distortion on the system. Its purpose is to identify when distortion levels may reduce equipment life, increase losses, interfere with protection or communication systems, or violate planning limits at key nodes. By characterizing dominant harmonic orders and their variation with load, this focus area supports targeted mitigation and coordination between utilities and customers with significant nonlinear loads.
Voltage Sags
The voltage sags focus area characterizes short-duration reductions in RMS voltage magnitude, typically driven by faults, motor starting, or large step changes in load. Its purpose is to quantify how deep, how long, and how often sags occur, and to compare those patterns with the sensitivity of connected equipment or industry benchmarks. This enables engineers to link nuisance trips, process upsets, or equipment mis-operation to specific sag performance and to evaluate whether system performance is typical, marginal, or problematic for the application.
Voltage Swells
The voltage swells focus area characterizes short-duration increases in RMS voltage magnitude above nominal, often associated with system faults, switching actions, or sudden load rejection. Its purpose is to measure the magnitude, duration, and incidence of swells and assess their potential to stress insulation, trigger surge protection, or disrupt sensitive loads. By relating swell behavior to system configuration and operating events, this focus area helps identify locations or conditions where over-voltage risk should be reduced or monitored more closely.
How Merlin™ Can Help
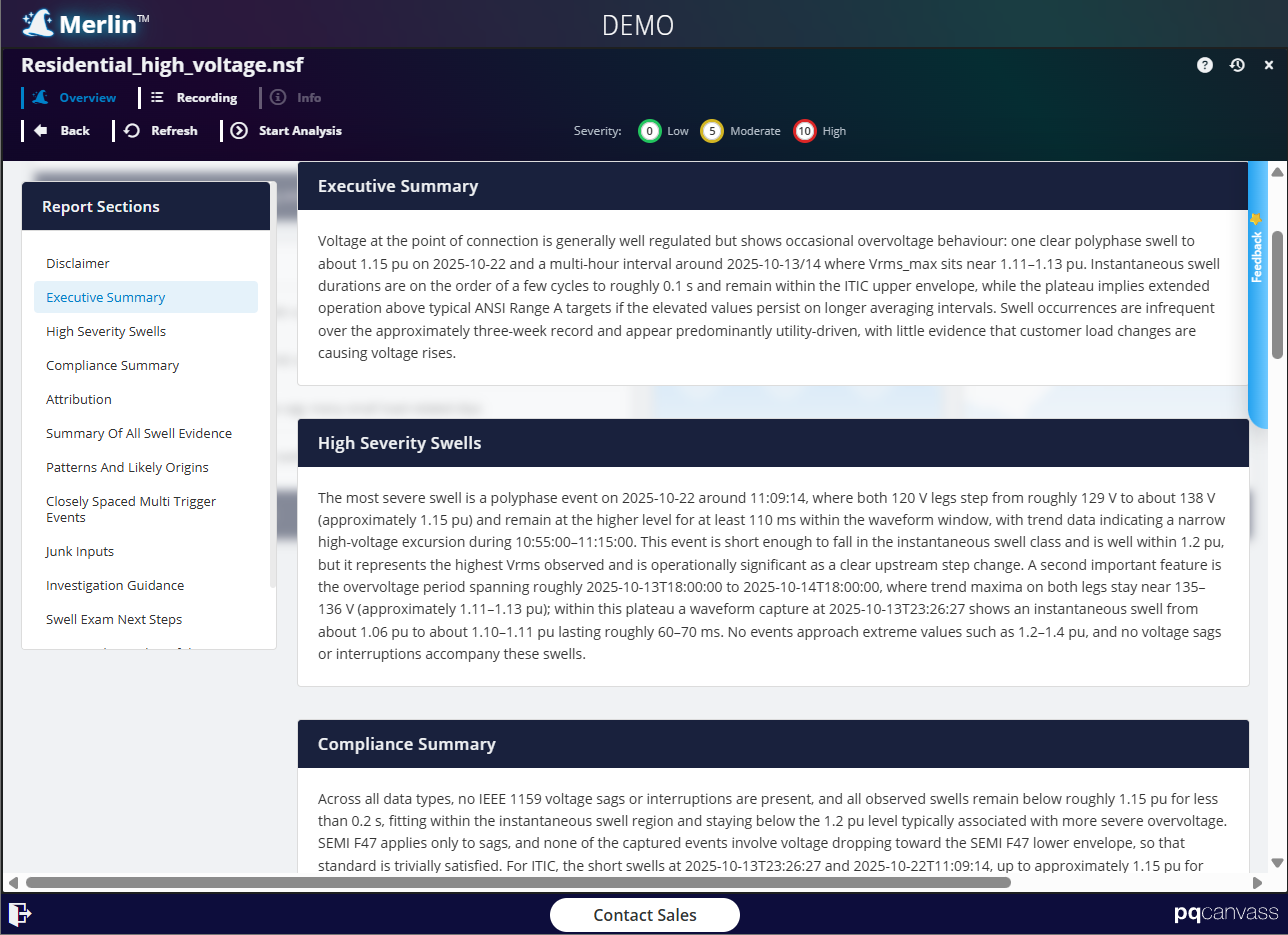
A recording analysis with Merlin™ provides insight for each of these power quality focus areas. Each focus area will have an overall summary and a description of any “High Severity” issues found in the focus area.
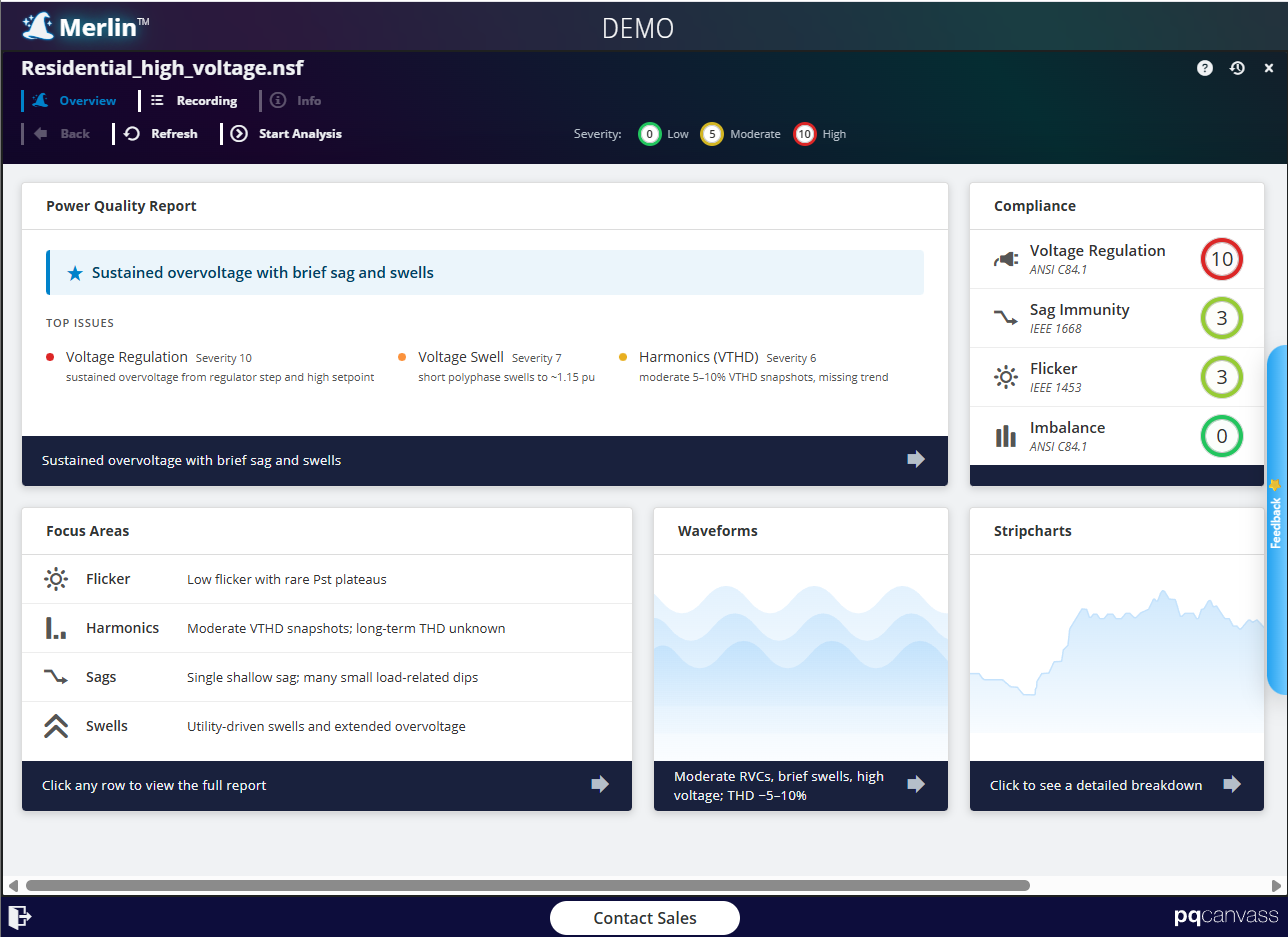
Merlin™’s focus areas consolidate compliance results, stripcharts, waveform snapshots, and event-change data into a single, engineer-ready assessment of issue severity and compliance. It highlights recurring motifs, correlates issues with load current to distinguish likely customer versus utility contribution, and flags high value time intervals and follow-up recording needs so engineers can quickly focus on the most impactful issues.
The following sections describe data points Merlin™ will attempt to provide for each focus area.
Compliance Summary
Each focus area report has one or more compliance standards that were assessed, and reports how compliant the data was in relation to those standards. For example, for the Flicker focus area, IEEE 1453 flicker compliance would be assessed and a determination made for whether the data recorded was in compliance or not.
Sometimes the data needed for compliance assessment might not have been recorded, which will prevent Merlin™ from properly assessing compliance. If that is the case, it will be noted in this section.
While not a definitive list (mostly because this list continues to grow as we add more features and analysis tools to Merlin™), the following compliance standards are covered:
- Flicker
- IEEE 1453
- Harmonics
- IEEE 519
- Voltage Sags
- IEEE 1668
- SEMI F47
- Voltage Swells
- IEEE 1159
- SEMI F47
Customer vs. Utility Attribution
This section evaluates whether observed power quality issues are more consistent with customer-side behavior or utility-side conditions. It compares event timing, phase selectivity, current–voltage relationships, and recurring motifs across the dataset to infer the most likely source of each issue. It also summarizes attribution confidence so engineers understand where responsibility is clear and where additional data or coordination may be needed.
Summary of Focus Area Evidence
This section consolidates the most important measurements, events, and statistical indicators that support the conclusions for the focus area. It highlights representative examples from stripcharts, waveforms, and event logs, along with any relevant compliance metrics, to show how the report moved from raw data to specific findings. The goal is to give engineers a concise but traceable evidence trail they can revisit if deeper review or independent verification is required.
Patterns and Likely Origins
This section describes recurring patterns in the data, such as time-of-day trends, phase-specific behavior, or correlations with load changes and system operations. It uses those patterns to narrow down plausible origins for the power quality issues, pointing to likely equipment classes, locations in the system, or operating conditions that align with the observed signatures. Where multiple explanations remain possible, it notes the leading candidates and the evidence supporting or limiting each one.
Overall Investigation Guidance
This section connects the focus area findings to the broader PQ investigation and highlights how the identified issues relate to reported symptoms and system performance. It directs engineers toward the most relevant time periods, phases, and equipment, and notes where results from different focus areas reinforce or contradict each other.
Next Steps for Focus Area Examination
This section outlines recommended follow-up analysis steps within the same focus area, such as reviewing specific events, zooming into critical time intervals, or comparing behavior across phases and load conditions. It helps engineers prioritize which data segments and correlations to examine in detail to validate findings and refine root-cause hypotheses.
Advice for Follow-up PQ Recordings
This section provides guidance on how future PQ recordings can be configured to strengthen conclusions in the focus area, such as extending monitoring duration, adjusting trigger settings, or adding complementary measurement points. It aims to improve data completeness, attribution confidence, and the ability to track whether any corrective actions have improved power quality over time.
Conclusion
Although Merlin™ is still early in its lifecycle, its capabilities are already substantial. Its power quality focus area analysis is both highly sophisticated and a significant time saver for engineers working through complex recordings. As Power Monitors, Inc. continues to train, refine, and extend Merlin™, its analytical depth and coverage will steadily grow.
Demo
If you would like to see a live demonstration of Merlin™, please CLICK HERE to sign-up.
