
Abstract
Canvass is a web-based power quality portal designed and developed by PMI to allow users to perform power quality analysis from anywhere they have an internet connection and a web browser. An important feature of Canvass is the ability to show data from multiple devices on a single stripchart graph. Due to the diversity of devices that can feed data into Canvass, it’s often the case that different nominal voltage levels are in use, and present on a single graph. In this situation, per-unit scaling is essential for comparing voltage traces graphically. This white paper discusses the usage of the per-unit graphing feature of stripcharts in Canvass.
Definition
A per-unit system is, in simple terms, a method wherein measurements are expressed as a fraction or percentage of a base unit value:
Vpu =
The base value is a reference, or nominal value for that point in the system. Consider a system where the nominal (or “ideal”) voltage is 120.0V. In such a system, no electrical node may actually be at exactly 120.0V, or even have 120.0V set as a specific target voltage, but that value is considered the “normal” or “ideal” value. As an example, a voltage regulator at a substation may be set 5% high, and after the voltage drop through the distribution system, the voltage at the end of the feeder could be 5% low. A “120V” receptacle would read 126V near the substation, and 114V a the end of the line, but “120.0V” would be the base value. In the per-unit system, using 120V as the base, 126V would be 126/120 = 1.05pu, while 114V would be 114/120=0.95pu.
The per-unit concept extends to current and impedance, and is often used to simplify transformer and line impedance calculations. In Canvass, per-unit scaling is only applicable to line voltage. Each device reporting to Canvass may be monitoring at different nominal voltage points For example, a Canvass account may receive data from a collection of 120V plug-in Boomerangs, 240V Form 2S meter socket Boomerangs, 3-phase Boomerang on a 277V wye, or Revolutions on a 208V or 480V delta. A graph that spans from 120V up to 480V will not be able to show much detail relative to the size of the voltage variations, just due to the scaling required. By normalizing each individual voltage trace to a separate base value, each trace ends up with nearly the same “normal” value, that is, 1.00. After this normalization to per-unit values, all these disparate voltage traces are easily compared on the same graph. Canvass determines the base value for each voltage trace automatically; no configuration is needed by the user.
Adavantages to Per-Unit
There are many advantages of using a per-unit system of measurement, the foremost of which is the mixture of several monitors measuring systems on both 120V and 240V. In this specific scenario, when graphing two devices– each measuring at a different nominal voltage– the auto-scaling feature in Canvass would make small variations in voltage readings very difficult to see, because of the large disparity in graphing a value at 120V and a value at 240V (Figure 1).
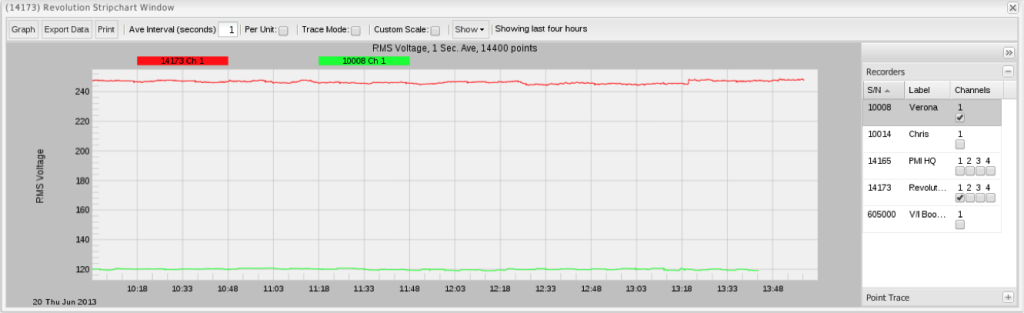
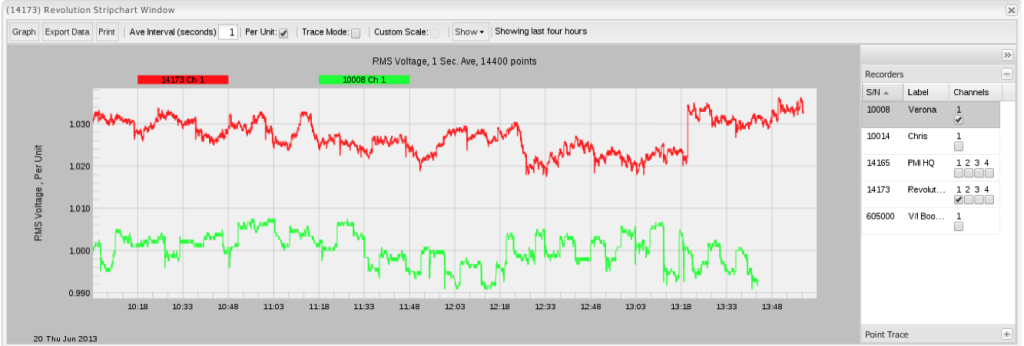
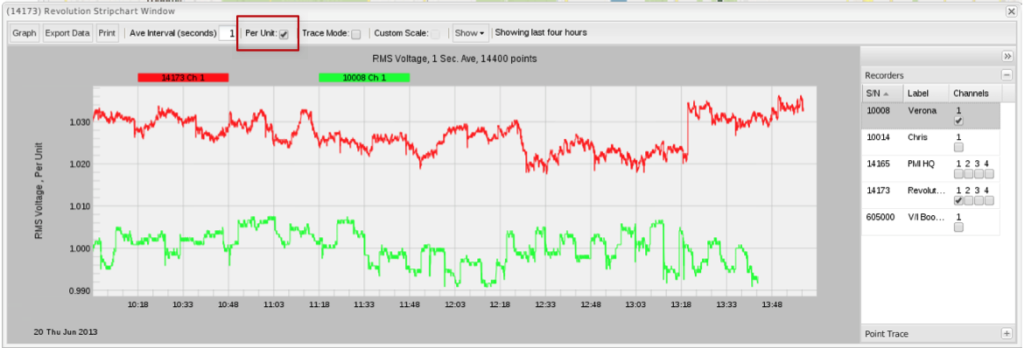
Placing the graph in per-unit mode (see Switching to Per-Unit, below) will place both traces on the same scale and makes the variances from the nominal much easier to spot. (Figure 2) Another advantage of using per-unit is that the scaled values are easily interpreted as percentages of the nominal. A quick glance at the graph and it can be determined how far off of the nominal the graphed values actually lie.In daily profile graphs, the standard deviation is also scaled in per-unit mode. In the figure below, two Boomerangs, one 120V, one 240V, are graphed as daily profiles.
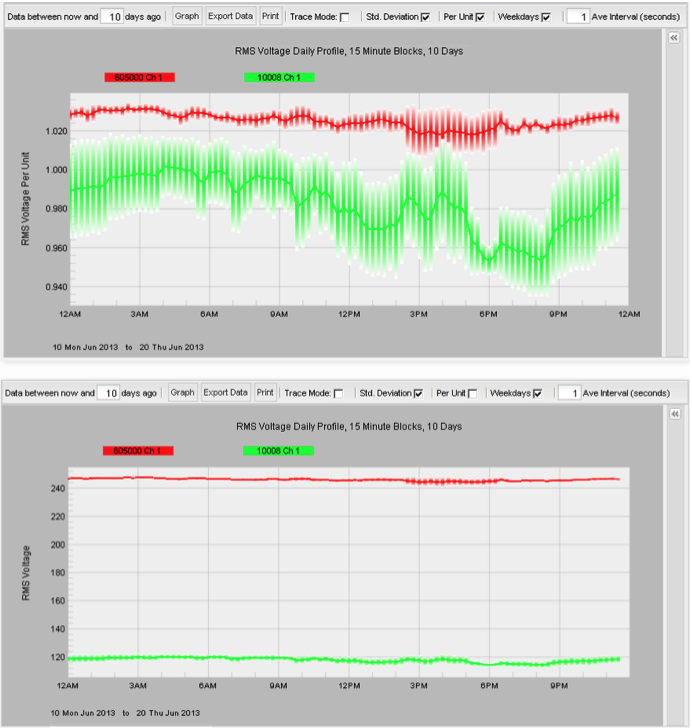
Daily profile graphs are also optionally scaled with per-unit values. In Figure 3, two devices, one at 120V, and one at 240V, are graphed together. In the bottom graph, very little detail is visible, and the red trace (Boomerang 605000) appears to have a larger standard deviation than the other one. It does, in an absolute voltage sense, but relative to its reference voltage, it’s actually smaller. The top graph is the same data, in per-unit mode. Here much more detail is visible, especially on the standard deviation bars (which are also scaled in per-unit). The green trace (Boomerang 10008) has much more fluctuation, and is less tightly regulated.Switching to Per-Unit Mode Switching a graph to per-unit mode in Canvass is pretty simple. There are, however, some limitations as to what can be graphed using a per-unit system in Canvass. Currently, only voltage stripchart, daily profile and histogram graphs support per-unit scaling. For these measurements, Canvass also automatically detects the nominal for each selected plot.
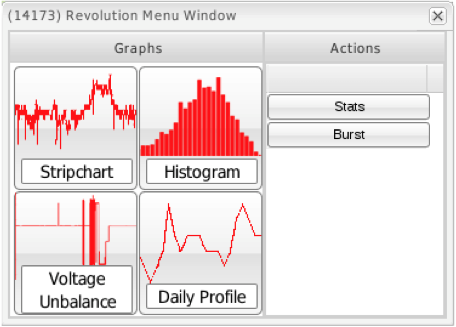
To begin, select a device on the Canvass user interface to bring up the graph menu as shown in Figure 4. Any of the graphs listed above (histogram, daily profile or stripchart) are able to be displayed using the per- unit system (in the example graphic, a stripchart graph has been selected). Once the graph has been drawn, simply select the “Per Unit” check box at the top of the graph as shown in Figure 5.
Conclusion
Per-unit graphing in Canvass is a very useful feature that can be enabled with a single click of the mouse. The power of Canvass is the ability to display data from many devices in different locations in one easy to read graph, and per-unit scaling is an important part of that ability.