Abstract
Voltage flicker is one of the most common power quality complaints reported by utility customers. The term flicker refers to visible changes in lighting intensity caused by rapid fluctuations in supply voltage. While the concept of flicker has been studied for decades, modern electrical systems contain an increasing number of loads capable of producing voltage fluctuations. These include arc furnaces, large motor starts, welders, electronically controlled heating systems, and many types of modern power electronics.
Objective measurement of flicker became possible with the development of the flickermeter defined in IEC 61000-4-15 and adopted by IEEE 1453. Many modern power quality monitors implement this signal processing chain and produce standardized flicker metrics such as Instantaneous Flicker Level (IFL), Short-Term Flicker Severity (Pst), and Long-Term Flicker Severity (Plt).
Modern analysis tools have also evolved. While earlier investigations relied on software such as ProVision to examine flicker recordings, current systems such as PQ Canvass provide cloud-based access to flicker data. In addition, artificial intelligence tools such as Merlin™ can automatically analyze recordings and assist engineers in diagnosing flicker problems.
This paper provides an overview of flicker fundamentals, the operation of the standardized flickermeter, and modern workflows for analyzing flicker using PQ Canvass and Merlin™.
Overview of Flicker
Flicker is defined as the visible change in brightness of a lamp caused by fluctuations in the supply voltage. From a power quality perspective, the root cause is voltage fluctuation, while flicker represents the human perception of that fluctuation.
The human visual system is particularly sensitive to light modulation in the approximate frequency range of 5–15 Hz, with maximum sensitivity near 8.8 Hz. Because of this sensitivity, relatively small voltage changes can produce visible flicker. In some situations, voltage variations of less than 0.5% may be perceptible.
Voltage fluctuations are typically caused by changing load current flowing through system impedance. As load current varies, voltage drops across the distribution system impedance also vary, producing modulation of the supply voltage. The magnitude of the resulting voltage variation depends on:
- Source impedance
- Magnitude of load current change
- Frequency of load variation
- Distance from the load
Typical sources of flicker include:
- Arc furnaces
- Resistance welders
- Large motor starts
- Electric heating systems with rapid switching
- Phase-angle controlled loads
- Non-synchronous power electronics
In residential areas, flicker sources may include HVAC compressors, electric cooking equipment, or electronic heating devices.
Because flicker is a perception-based phenomenon, direct voltage measurements alone are not sufficient to quantify its severity. This led to the development of standardized flicker measurement methods.
Flickermeter Defined
To provide consistent and objective flicker measurements, the IEC developed the flickermeter, defined in IEC 61000-4-15 and adopted by IEEE 1453.
A flickermeter is a signal processing chain designed to simulate the response of a typical incandescent lamp and the human eye-brain system. By modeling these responses, the flickermeter converts voltage fluctuations into a standardized flicker severity measurement.
Modern power quality monitors implement this process digitally in firmware or software. The output of the flickermeter includes several commonly used metrics:
IFL – Instantaneous Flicker Level: A moment-to-moment value representing flicker intensity.
Pst – Short-Term Flicker Severity: Calculated over a 10-minute interval using statistical analysis of the instantaneous flicker signal.
Plt – Long-Term Flicker Severity: Calculated from twelve consecutive Pst values, representing a two-hour period.
These standardized metrics allow flicker measurements from different instruments and manufacturers to be directly compared.
How Does the Flickermeter Work?
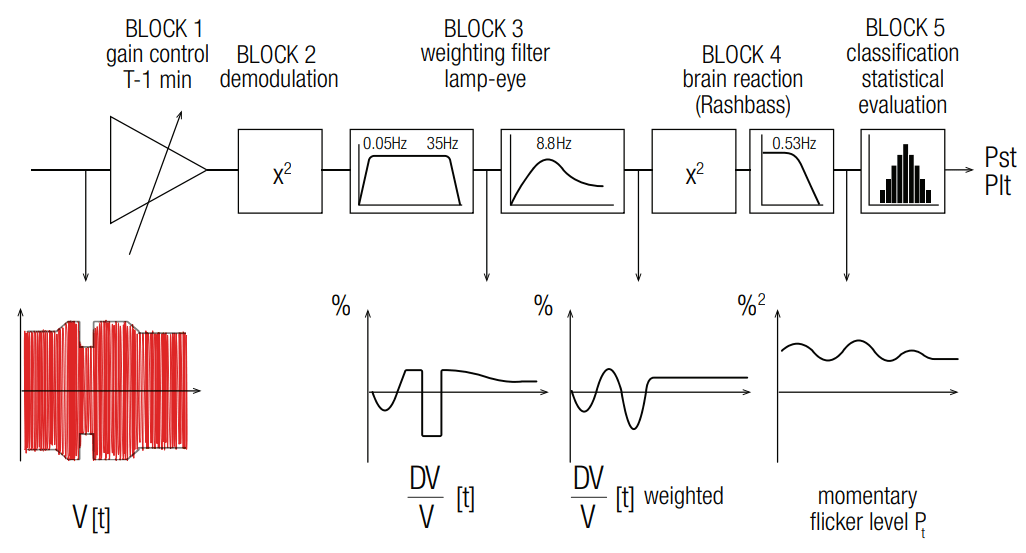
The IEC flickermeter is composed of several processing stages that transform the measured voltage signal into flicker severity values. A flicker signal flow block diagram can be seen below.
Block 1 – Gain Control
The input voltage signal is first normalized to a reference value using automatic gain control. This allows the flickermeter to operate correctly over a range of input voltages.
This stage also produces the quantity ΔV/V, which represents the relative change in voltage magnitude between successive half-cycle measurements.
Block 2 – Demodulation
The demodulation stage extracts voltage amplitude modulation from the 50/60 Hz carrier signal. This process removes the fundamental frequency component and isolates the modulation caused by voltage fluctuations.
Block 3 – Weighting Filters
The extracted modulation signal is passed through a set of filters designed to simulate the response of a typical lamp-eye system. These filters emphasize frequencies where the human eye is most sensitive to flicker.
The highest sensitivity occurs near 8.8 Hz, which corresponds to the maximum weighting applied by the filter.
Block 4 – Eye-Brain Response Simulation
The signal is then processed to simulate the persistence of vision and neurological response of the human visual system. This stage models how flicker is perceived over time.
Block 5 – Statistical Evaluation
Finally, statistical processing is performed on the instantaneous flicker signal. This produces the standardized flicker metrics:
- Instantaneous Flicker Level (IFL)
- Short-Term Flicker Severity (Pst)
- Long-Term Flicker Severity (Plt)
These values allow utilities to objectively quantify flicker severity and determine whether voltage fluctuations are likely to produce customer complaints.
Data Collection and Analysis Using PQ Canvass
Power quality monitors such as the Bolt, Seeker, Tensor, Revolution, or Guardian record flicker measurements as part of their interval data. Historically, these recordings were analyzed using local software tools.
Modern systems now use PQ Canvass, a cloud-based platform for storing and analyzing power quality recordings.
Within PQ Canvass, engineers can examine:
- Pst stripcharts
- IFL time series
- Voltage RMS variation
- Load current correlations
These measurements allow engineers to determine both the severity of flicker and the direction of the source.
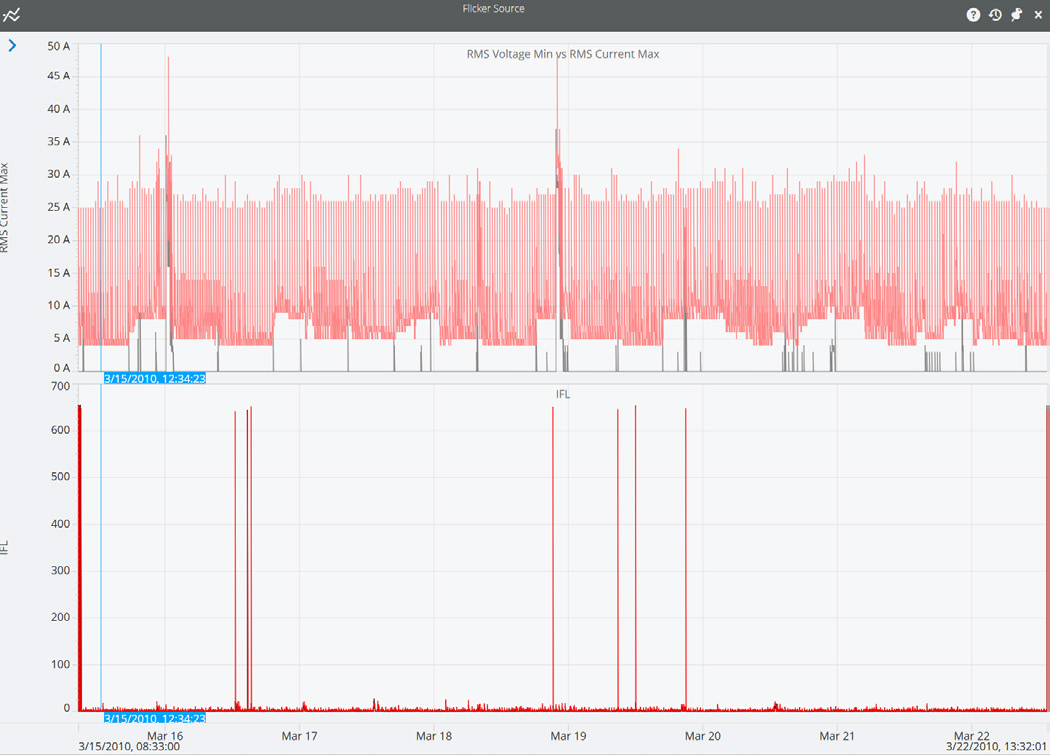
A common investigation technique is to compare IFL values with load current. When spikes in instantaneous flicker correspond with spikes in load current, the flicker source is likely downstream of the monitoring location. Conversely, flicker events without corresponding current changes may indicate an upstream source. Figure 2 shows an example comparison in PQ Canvass between IFL and load current. Based on this view we can assume the flicker source is likely upstream.
By combining flicker metrics with voltage and current measurements, PQ Canvass provides a comprehensive view of system behavior during flicker events.
Flicker Limits
The IEEE flicker standard defines recommended limits intended to minimize customer complaints.
Typical guideline values are:
- Short-Term Flicker Severity: Pst ≤ 1.0
- Long-Term Flicker Severity: Plt ≤ 0.8
These limits are based on studies of human perception. During the development of the standard, test subjects were exposed to controlled flicker conditions. Approximately half of the participants reported visible and irritating flicker when Pst reached 1.0.
Utilities often evaluate compliance using statistical methods, such as ensuring that the limits are exceeded less than a specified percentage of the monitoring period.
Automated Flicker Diagnosis Using Merlin™
Analyzing flicker recordings traditionally required manual inspection of voltage, current, and flicker stripcharts. While this approach is effective, it can be time-consuming when large amounts of data must be reviewed.
To assist engineers in this process, PMI developed Merlin™, an artificial intelligence analysis tool integrated with PQ Canvass.
Merlin™ automatically examines power quality recordings and identifies patterns consistent with known power quality phenomena, including flicker.
The system evaluates relationships between measured parameters such as:
- Voltage fluctuation
- Instantaneous flicker level
- Pst severity
- Load current changes
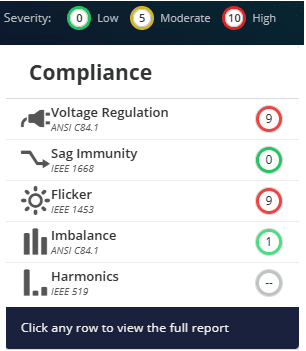
Analyzing a recording using Merlin™ the user can easily spot areas that the network is out of compliance (Figure 3). Using this information, Merlin™ can highlight periods where flicker occurs and provide guidance regarding potential causes.
For example, Merlin™ may identify correlations between:
- Rapid current variation and IFL spikes
- Periodic load behavior and flicker modulation frequency
- Sustained voltage fluctuations consistent with known flicker sources
This automated analysis allows engineers to focus directly on the most relevant portions of a recording rather than manually searching through large data sets.
The user can easily view summary descriptions of the recording which can include: identification of flicker severity, approximate time of events, suspected type of flicker source, and more. After Merlin™ analyzes the recording, engineers can use the results inside PQ Canvass to generate detailed reports of their flicker investigation. This will reduce the time required to prepare documentation for any power quality investigation.
Merlin™ does not replace engineering judgment, but it serves as a powerful assistant that accelerates the diagnostic process and improves the efficiency of flicker investigations.
Conclusion
Flicker remains a common power quality concern because relatively small voltage fluctuations can produce visible lighting disturbances. The standardized flickermeter defined in IEC 61000-4-15 and IEEE 1453 provides an objective method for quantifying flicker severity through measurements such as IFL, Pst, and Plt.
Modern monitoring systems routinely record these metrics, allowing utilities to investigate flicker complaints with greater accuracy. Platforms such as PQ Canvass simplify the process of accessing and analyzing recorded data by providing centralized visualization tools for flicker stripcharts and related measurements.
In addition, emerging technologies such as Merlin™ provide automated analysis capabilities that assist engineers in identifying flicker sources more quickly. By combining standardized measurement techniques with modern analysis tools, utilities can respond more efficiently to flicker complaints and better understand the behavior of complex modern electrical loads.
Additional Resources
To see Merlin™ in action scan the QR below or visit www.powermonitors.com/merlin-in-action