
Abstract
Many PQ investigations end with a follow-up recording to verify a problem has been corrected and to gather a baseline for any further issues. Analyzing the “before” and “after” recordings allows confirmation that a problem has been fixed. ProVision can open multiple files at once, so it is possible to analyze two recordings in one ProVision workspace. That task is now much easier with the file merge feature. ProVision can now merge two or more recordings into a single file, making detailed analysis just as easy as investigating a single recording.
File merge will combine two or more ProVision recordings into a single combined recording. File merging works best when the recordings are from the same device with the same settings. This is intended for files from the same recorder during different time periods, most commonly a “before” and “after” situation. It can also be used to combine multiple files from scheduled periodic downloads.
How to Merge Files in ProVision
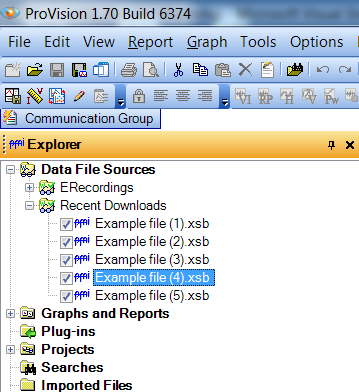
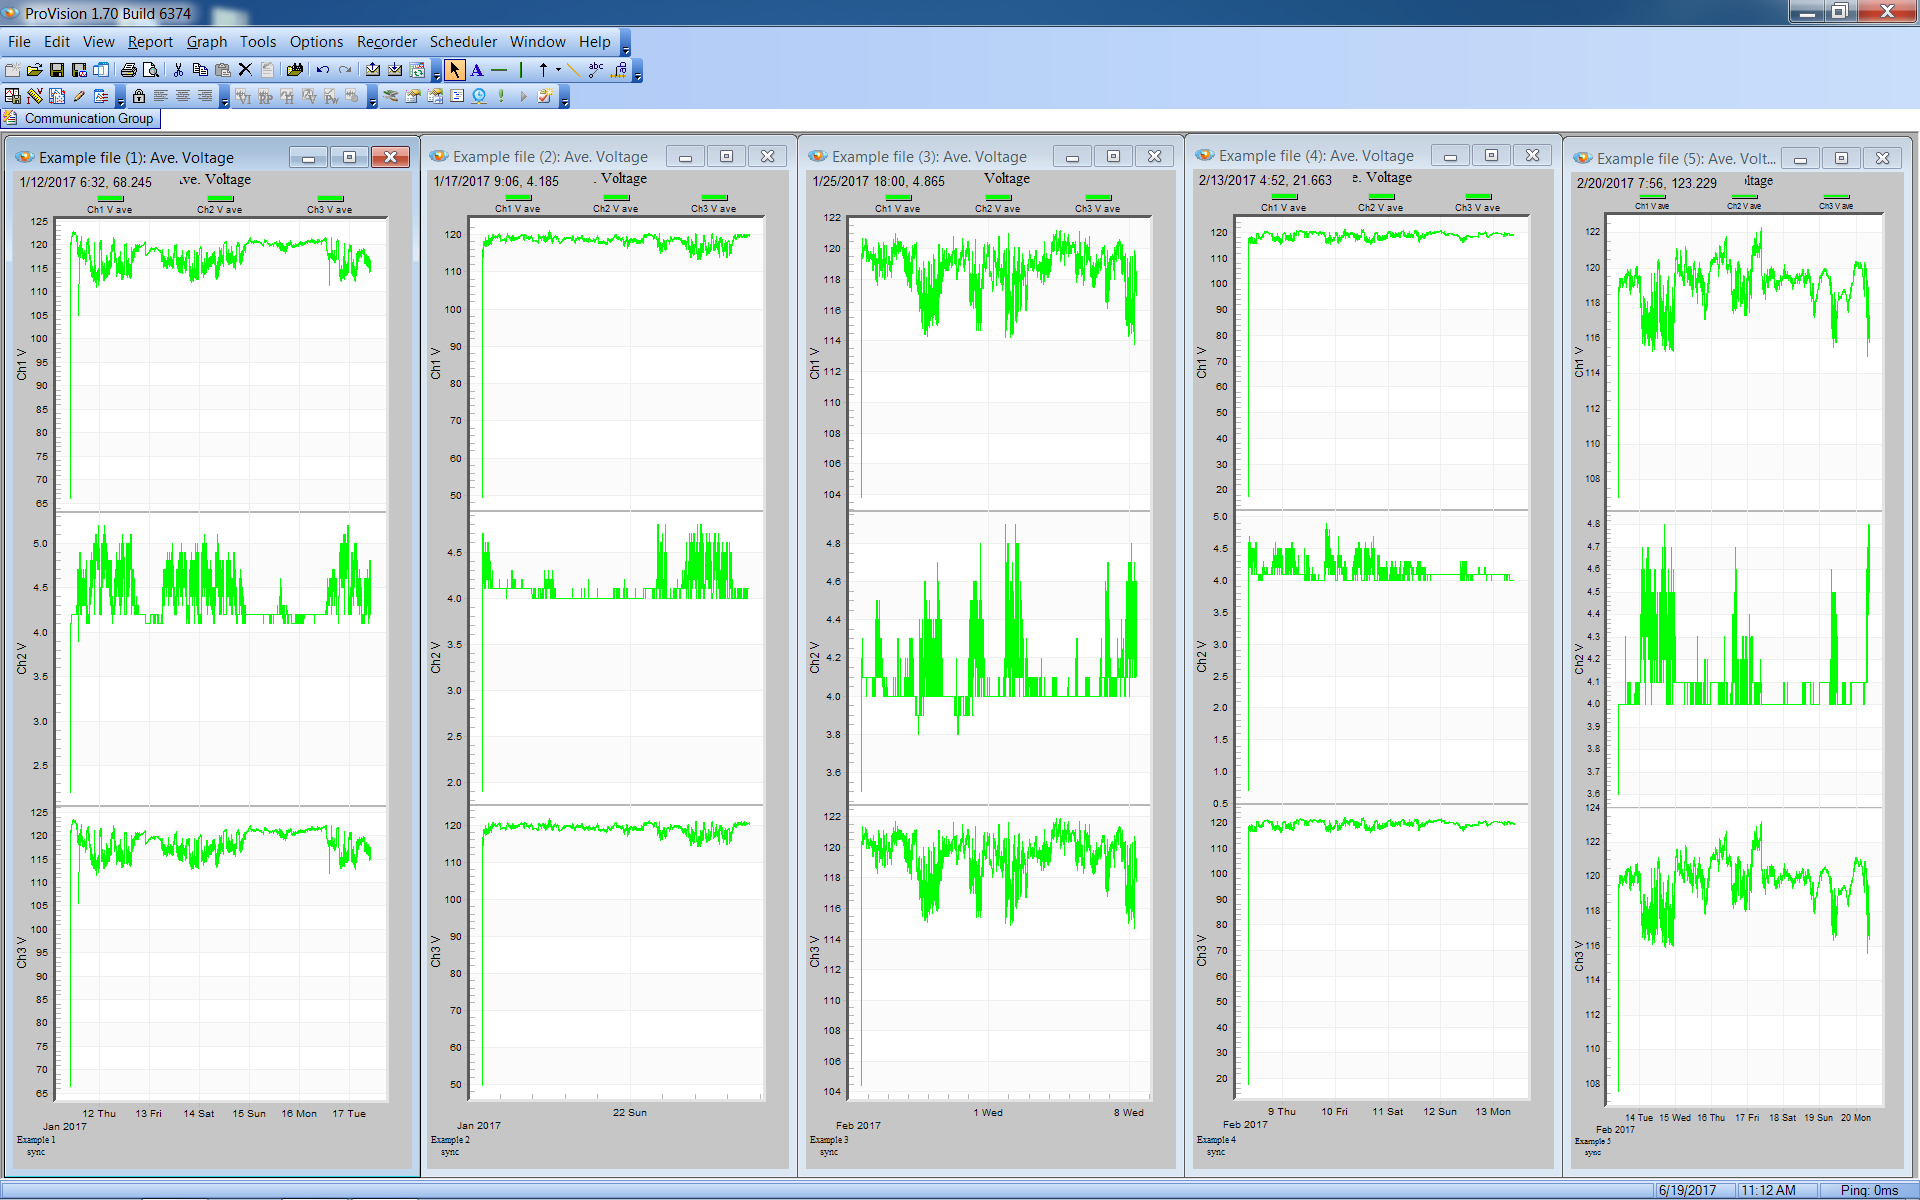
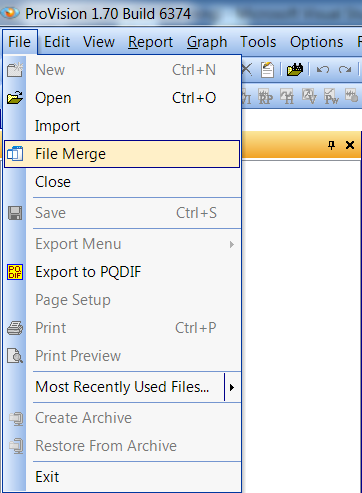
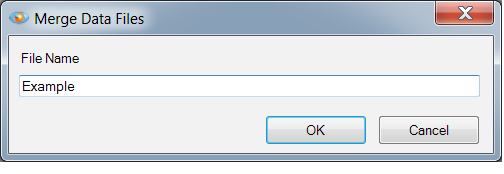
Select the ProVision recordings that you wish to merge. Figure 1 shows Average Voltage graphs for the five selected example recordings. Figure 2 shows the individual output of these five recordings. Next, choose File Merge from the File menu (see Figure 3). File merge next asks for a filename (see Figure 4). This is the filename for the combined recording.
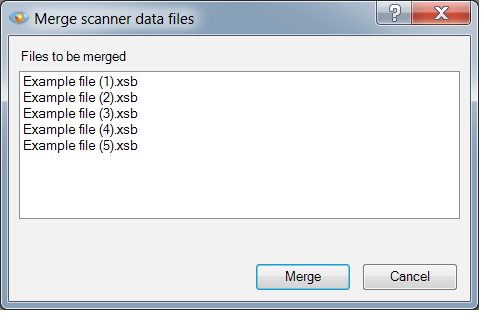
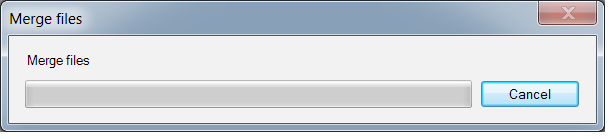
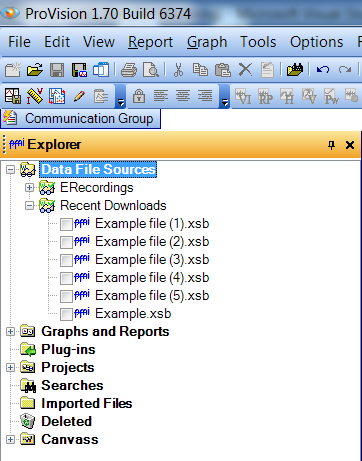
When the OK button is pressed in the File Name Dialog, a confirmation dialog (see Figure 5) is shown displaying the filenames of the recordings that will be merged. When the Merge button is pressed in this dialog, the merge process is started. During the merge process, a File Merge Progress dialog is displayed (see Figure 6). When the merge process has completed, the new recording file will be shown in the ProVision explorer tree (see Figure 7).
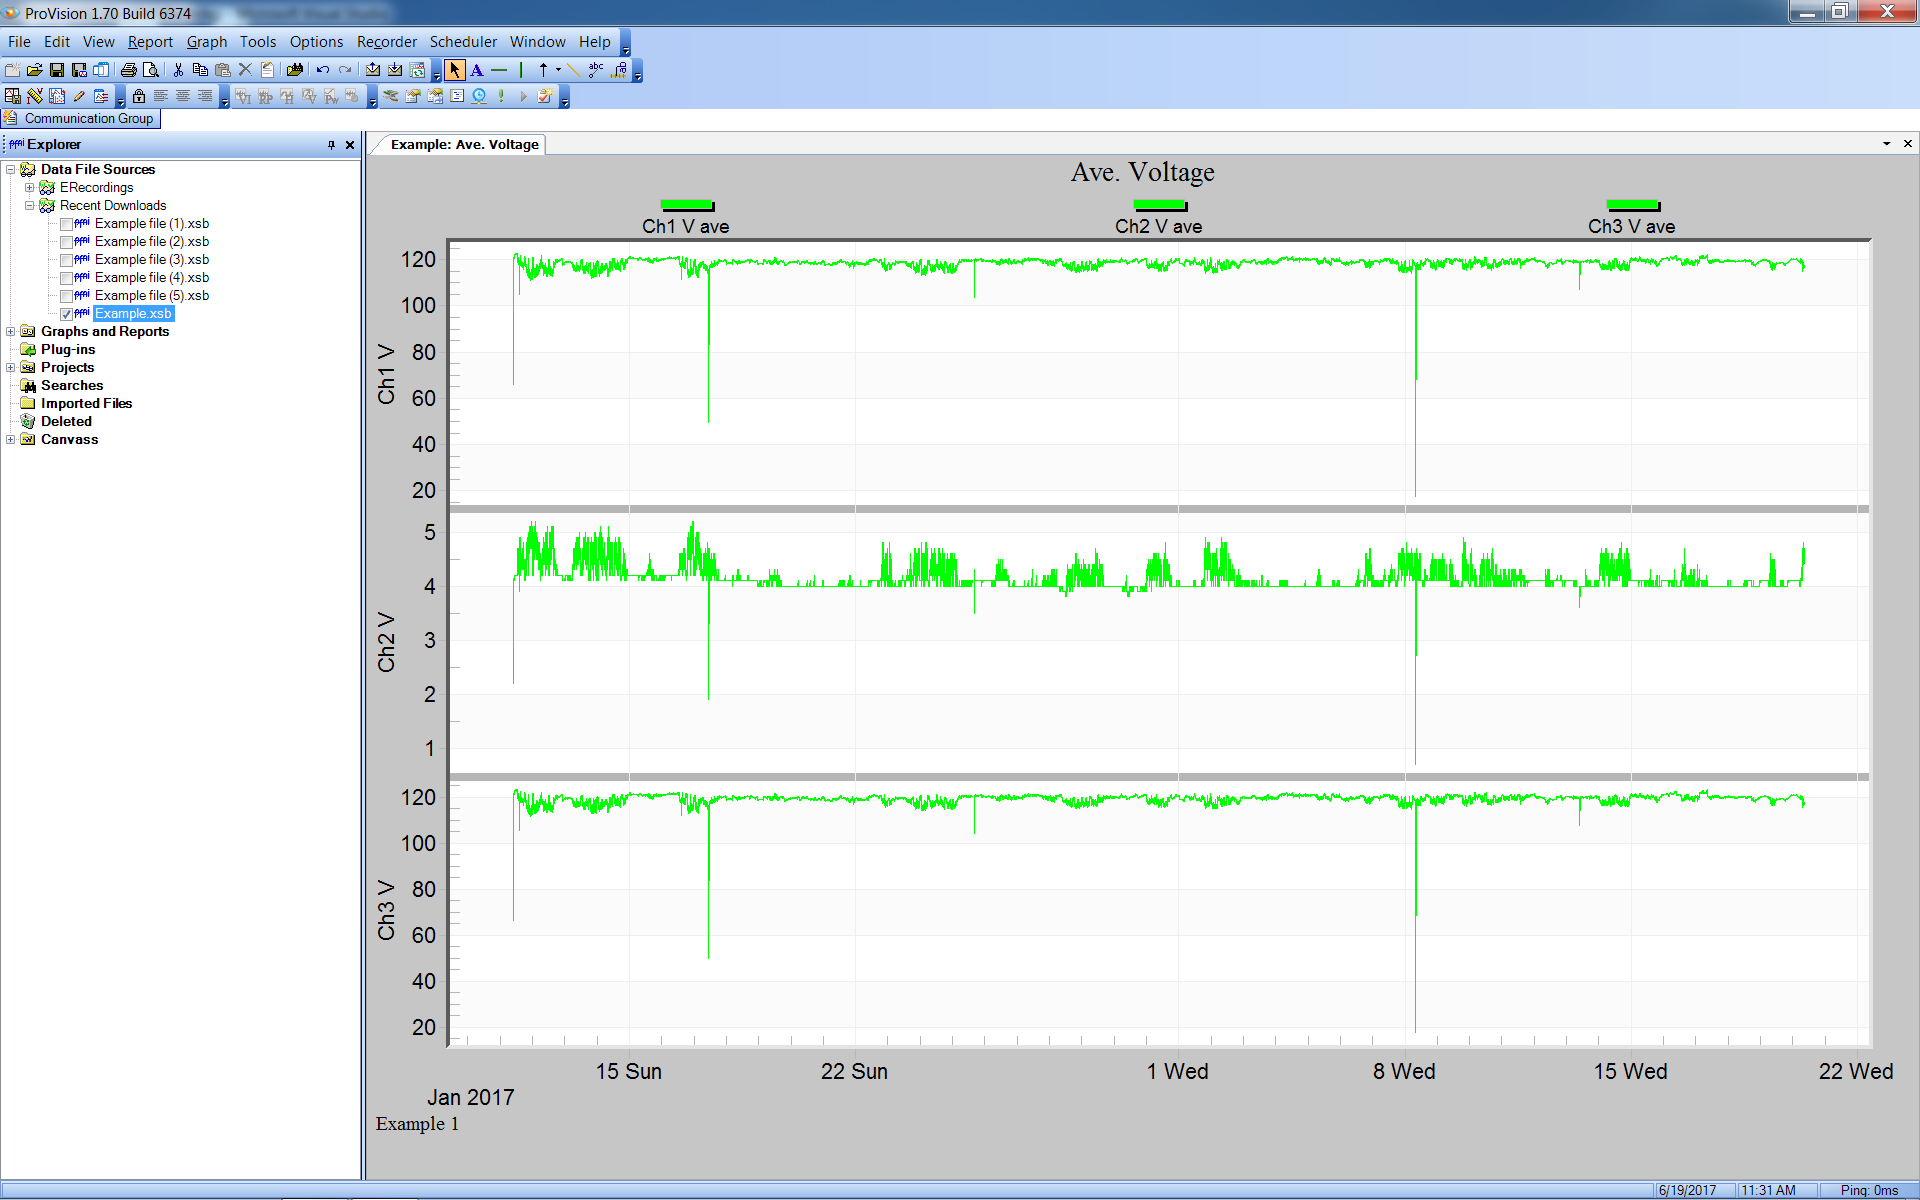
The merged recording is used the same as any other ProVision recording. All of the tools, reports, and graphs work the same with the merged recordings. Figure 8 shows the Average Voltage graph from the newly merged example recording. This recording contains the same data as the five individual graphs shown in Figure 1.
What Is Merged?
The following record types are merged. Everything else is taken from the first recording.
Daily Profiles
The Daily Profile is averaged, created by dividing the 24-hour day into 96 time periods lasting 15 minutes each. During each 15-minute period, the average is computed for various measures (voltage, current, etc.). This 15-minute average is then averaged with all the previous days’ averages of that 15-minute period. The averages are recomputed based on each of the merged files.
Energy Usage
The Energy Usage records contain the accumulated real, reactive, and apparent power measured by the Recorder. The accumulated real power is energy, in kilowatt-hours. The accumulated reactive and apparent powers are kilovar-hours and kilovolt-amp-hours, respectively. These totals are summed from each of the merged recordings.
Event Change
The Event Change records provide detailed cycle-level information about each voltage disturbance. The event change records are included for each merged recording.
Flicker
The Flicker record type is designed to show voltage variations that cause lights to flicker. This flicker data type is based on the older IEEE Standard 141 definition, derived from the original GE flicker curves. Flicker records are included for each merged recording.
Histograms
Histograms provide a count of how many cycles or minutes the voltage was at a particular value. The minute histograms take a one-minute average. These totals are summed for each recording in the merge process.
Power Outages
The power outages are included from each merged recording.
Significant Changes
The Significant Change record type tracks quick (up to single-cycle) fluctuations in the line voltage while ignoring gradual changes. The significant changed records are included for each merged recording.
Start/Stop Times
The recording start time is set to the start time of the earliest recording. The stop time is set to the stop time from the latest recording.
Stripcharts
Stripcharts are included for each merged recording.
Transients
Transient captures are very short duration disturbances in waveforms, typically impulsive transients. Transients records are included for each merged recording.
Waveforms
Waveforms are included for each merged recording.
What Can’t Be Merged
Not all record types can be merged, and in those cases, records from the first recording are used. The first recording is the one shown first in the confirmation dialog, as shown in Figure 5. These “un-mergeable” record types include the report header, serial number, device identification and settings, and scale factors. Merging recordings from different devices or different settings can be problematic if the settings are those that control the overall recording properties, such as the stripchart interval.
When to Use File Merging
File merging is intended for use with multiple files from the same PQ recorder with the same settings. The two most common situations are “before” and “after” recordings, prior to and after a PQ problem has been identified and corrected. The recorder is usually left in place after the problem is found and until the problem is confirmed to be fixed. For consistency, the settings should remain the same between those recordings.
The second common scenario is a permanently installed recorder, especially one accessible via cell modem or Ethernet. A cell or Ethernet Revolution may be downloaded on a scheduled basis, e.g. weekly, automatically by ProVision. These weekly files can be merged into a monthly, quarterly, or even year-long file to examine long-term or seasonal trends more easily.
In both these cases, the same recorder is the source of all files. Assuming the recorder is re-initialized between recordings, there is no overlapping data. If files with overlapping time spans are merged, triggered events are still merged, but time-based trend data such as stripcharts may not behave as expected since there will be multiple datasets for the same time period. For these types of files, the traditional method of multiple file analysis in ProVision should be used (open both files at once and use graph merging).
Conclusion
ProVision software provides many useful tools and features for analyzing recordings downloaded from PMI’s line of power quality devices. The File Merge utility allows separate recordings to be combined into a single recording for easier analysis and file management.