
Abstract
The Revolution is a powerful tool for measuring and recording power quality information. With ProVision, there are a wide variety of ways to display and analyze many different types of data. This whitepaper focuses on using the Revolution and ProVision to measure and analyze power data. It serves as an overview of AC power, how the Revolution gathers data, and as a primer on setting up ProVision and the Revolution to make best use of the graphs and reports about power available.
An Overview of Power
Power flow burden within an AC circuit can be separated into two distinct components: real power, measured in Watts, and reactive power, measured in Volt-Amperes Reactive. The total power in a system is a complex vector, with the real component composed of the real power (W) and the imaginary component composed of the reactive power (VARs).
Real Power
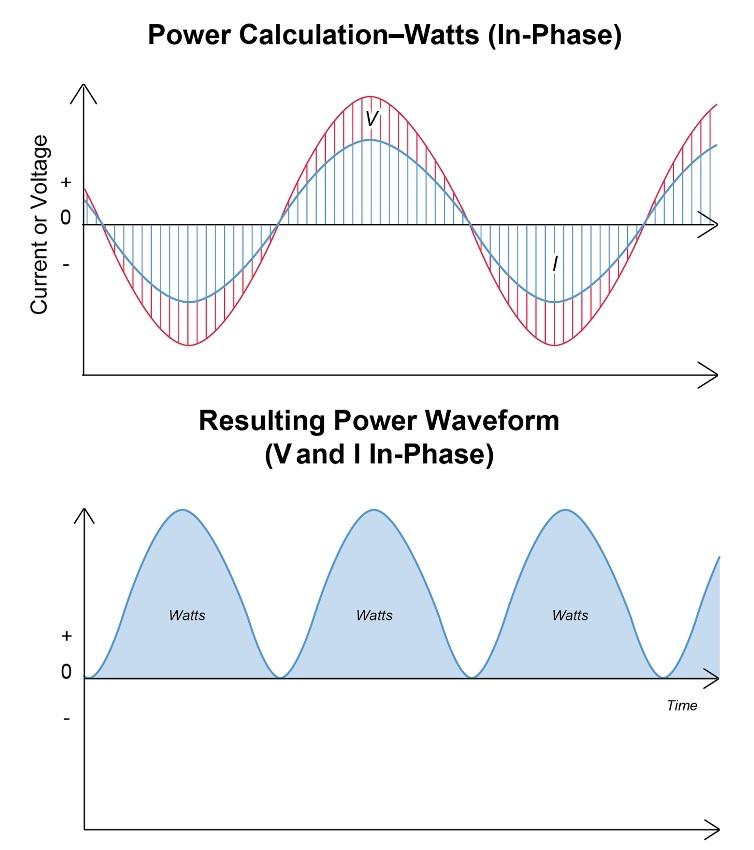
Real power is the energy delivered through the system that is spent doing work. Any motion created, light generated, heat produced, or other “useful” work is due to the real component of the total power. The sign of the real power indicates flow direction – positive power is power consumed, negative power is power generated. If you were to overlay the waveforms of the current and voltage in the system, real power is the area under the curves where the voltage and current have the same sign. Pure real power is consumed when both are perfectly in phase with each other, or in other words, the loads are purely resistive. The two graphs in Figure 1 display in-phase voltage, current, and the resultant power generated.
Reactive Power
Reactive power is energy that oscillates between the capacitive or inductive loads (hereafter “reactive loads”) and the source, doing no work.
In a circuit with only a capacitive load and a voltage source, the moment the voltage cycle begins the capacitor has no charge and thus operates essentially as a short circuit. The current rushes with no resistance to fill the capacitor, and for a short time, no voltage can be established. This causes the current waveform to “lead” ahead of the voltage waveform, out of phase by 90 degrees.
As soon as the voltage cycle begins in a circuit with only an inductive load and a source, a magnetic field is generated in the inductor, storing energy and developing an opposing voltage. This delays current flow for a short time while the field charges. When the voltage cycle changes polarity, the inductor discharges the stored energy back into the circuit, delaying the current from changing direction immediately. These delays cause the current waveform to “lag” behind the voltage waveform of the source, out of phase by 90 degrees. Because this energy is occupied filling and discharging reactive components, it cannot be spent doing useful work.
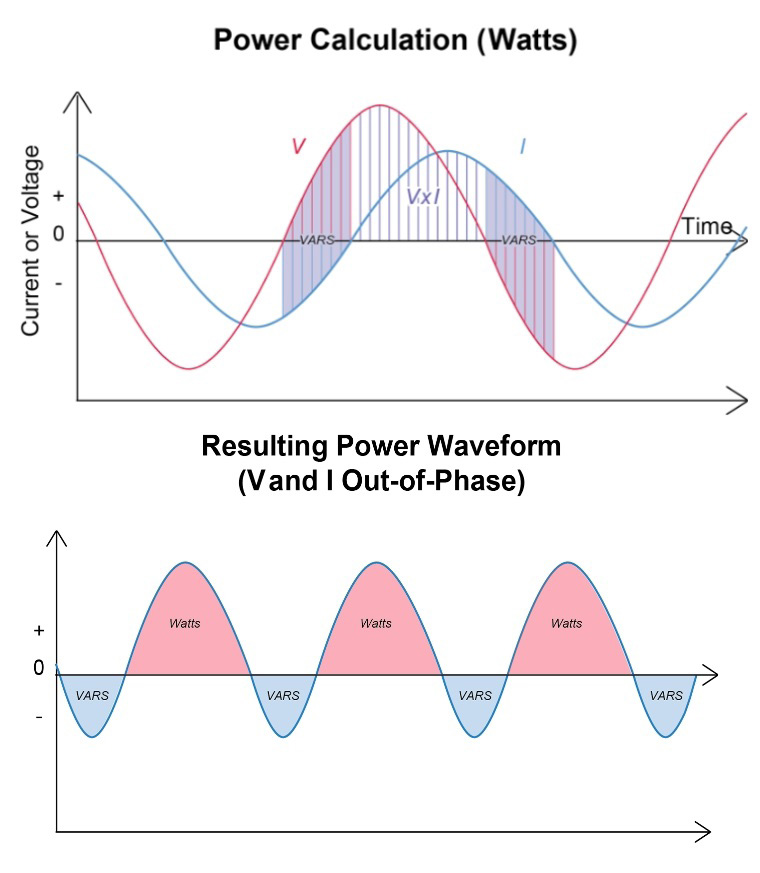
When the waveforms for voltage and current have opposite signs, the area between the curves represents the amount of reactive power in the system. The graphs in Figure 2 show out-of-phase voltage and current, and the mix of power that results.
Apparent Power
The vector sum of the real and reactive power in a system is known as the apparent power. It is computed by multiplying the root mean square (RMS) voltage and the RMS current. The result is a magnitude value with no sign, and units of Volt-Amperes. This is a measure of the total voltage and current flowing through the wires and components, even though the reactive component of the power is effectively unusable. Note that, despite the differing nature of real, reactive, and apparent power, they all use effectively the same units – all are measuring energy in joules per second. The different nomenclature is used to distinguish which is being discussed. The distribution system is burdened by the apparent power, regardless of the fraction that’s useable real power.
Power Factor
The power factor (PF) of a system is the ratio of the real power to the apparent power and is used as a measure of the efficiency. This ratio has no inherent sign or units; however, the convention is to assign a positive sign to a “leading” power factor (current waveform phase is ahead of voltage), and a negative sign to a “lagging” power factor (current waveform phase is behind voltage).
Revolution Power Measurement
A Revolution power quality (PQ) recorder can calculate real, reactive, and apparent power from the measurements of voltage and current in a circuit. This information can be displayed and analyzed in many ways. The Revolution computes all parameters, including real and reactive power, once per cycle. For a 3 phase delta circuit, it can be configured to compute power by either the vector or arithmetic methods.
Note that the placement of the recorder has a significant effect on the data gathered. For monitoring equipment sensitive to PQ disturbances, the recorder should be placed as close to the equipment as is feasible. For monitoring the quality of the supply from a utility, the recorder should be placed at the service entrance. For evaluating the effect of the loads of other customers, the recorder should measure at the point of common coupling.
Configuring the Revolution to Record Power
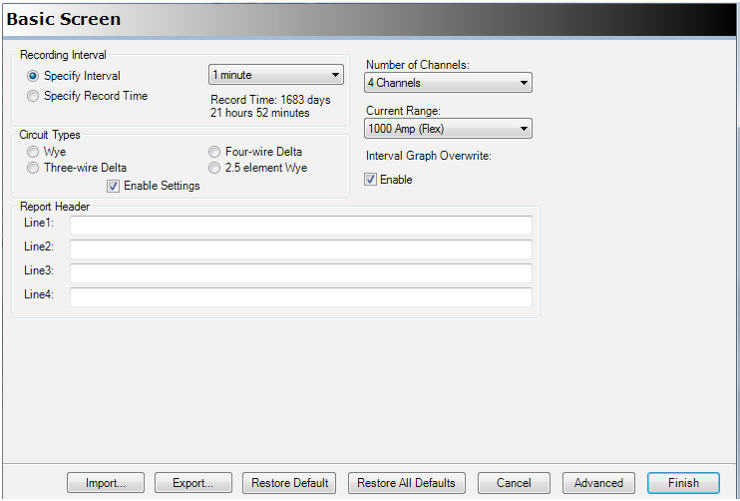
In order to gather the data needed, the Revolution must be configured through ProVision. When the recorder is connected to the PC, the Basic Screen menu (Figure 3) can be used to set the recording interval (or recording time) for strip charts. Also on the Basic screen are the settings for channels in use, current range, interval graph overwrite, report header, and circuit type. The “Circuit Types” setting must match where the Revolution will be hooked up: wye, 2.5 element wye, or three- or four-wire delta.
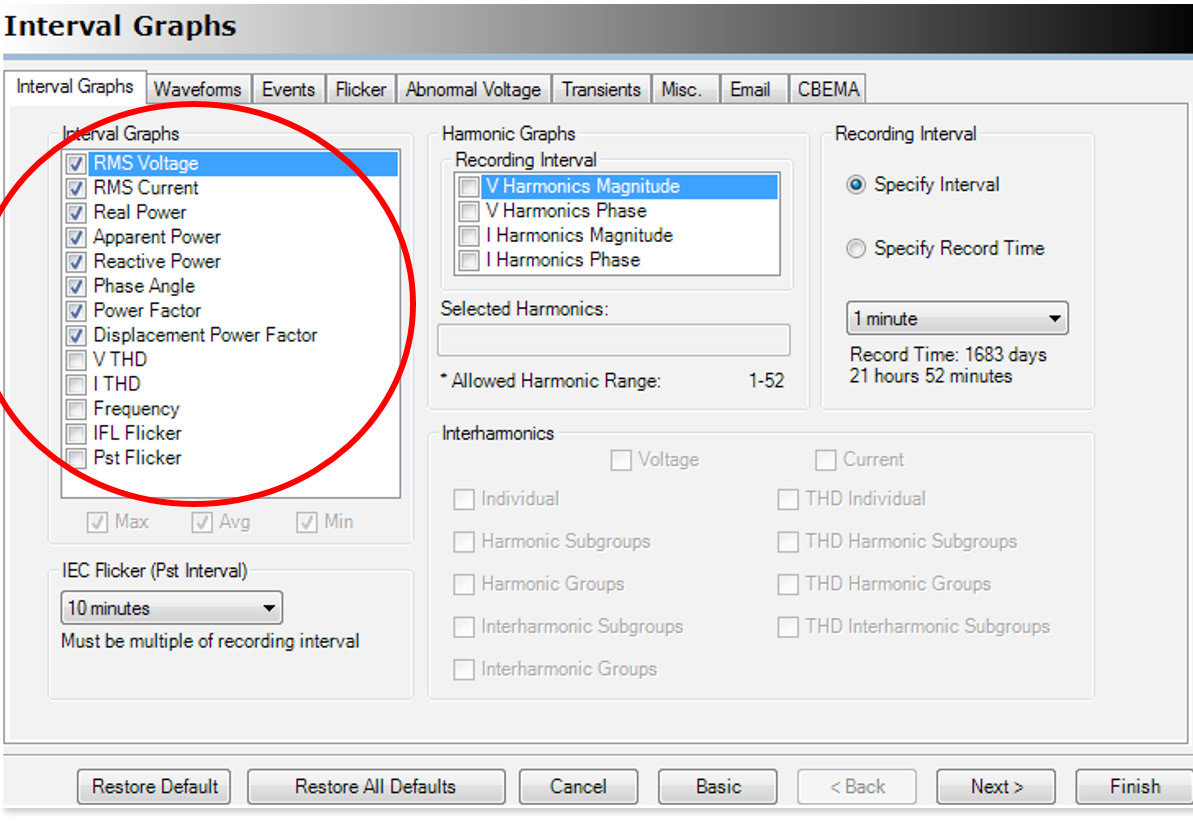
On the Basic Screen, select the Advanced button to access settings for graphs, waveform capture (WFC), Events, Flicker, Abnormal Voltage, Transients, Misc., Email, and CBEMA (shown in Figure 4). The Interval Graph tab is of the most use when setting up to record power. On this tab, there is a list of possible graphs to be recorded. For power recording, it is recommended to select RMS Voltage, RMS Current, Real Power, Apparent Power, Reactive Power, Phase Angle, Power Factor, and Displacement Power Factor. The recording interval should be set to less than the shortest on/off cycle time of any problematic loads; typically, the most useful interval is one minute.
All strip charts share the same memory. When this memory fills, the recorder can be set to do one of two things – stop recording, or wrap around and overwrite the oldest data. This setting is found on the “Basic Screen” of ProVision, under “Interval Graph Overwrite”. If the “Enable” box is checked, the recorder will overwrite the oldest data when the memory is full.
Each data point in the resulting strip chart will be an average of the values measured over the specified interval. Additionally, the minimum and maximum RMS voltage and current for each interval will be recorded.
Viewing Graphs and Reports in ProVision
Opening graphs and reports in ProVision is fairly simple. The path is ProVision→Graph→Power Interval→the graph to be viewed. Figure 5 is an example of a Total Power graph in ProVision. Here the various power graphs can be selected and viewed.
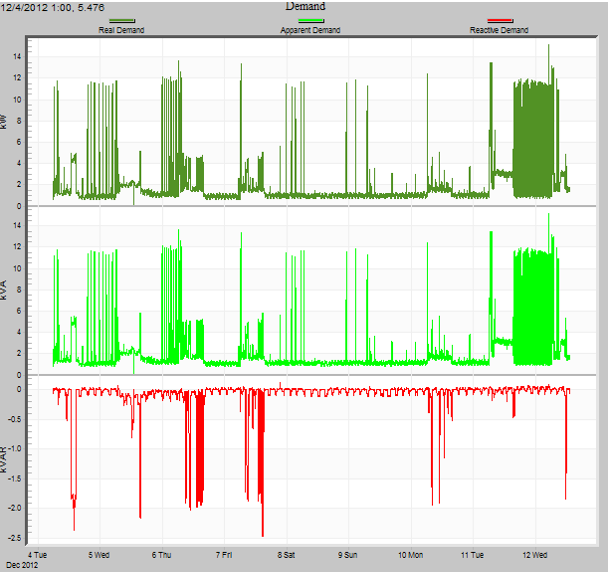
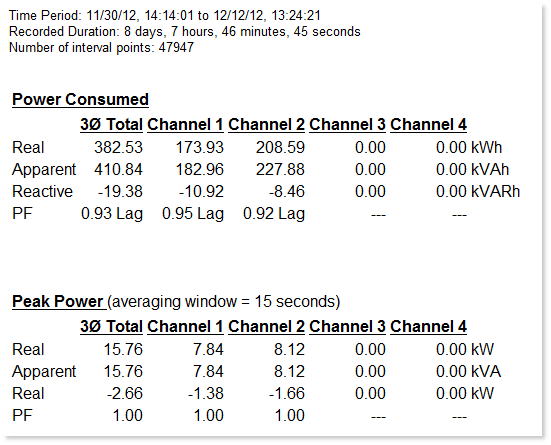
Reports are accessed similarly. The path is ProVision→Report→the desired report. Power Consumption (Figure 6), Energy Usage, Daily Profile, and Demand are useful for an overview of each topic over the recording period.
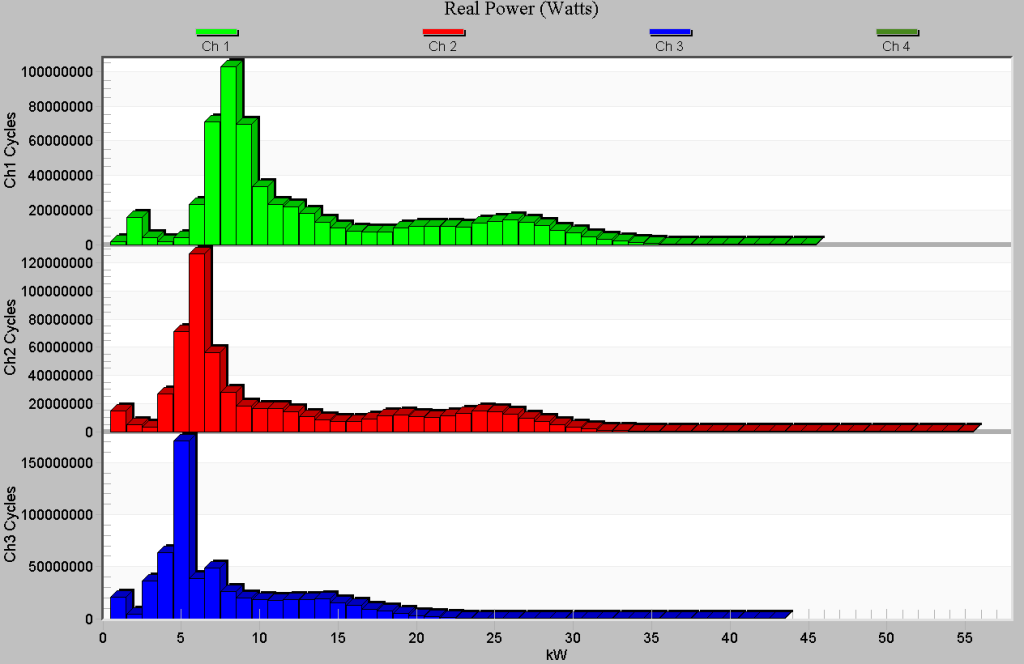
A third way to display the data is through a histogram. Figure 7 depicts an example of a Real Power histogram, which depicts the number of cycles each phase spends at a certain level of real power. Reactive and Apparent power histograms are also available. Histograms can be viewed either as a bar graph or as a report (ProVision→Graph→Histogram→etc., or ProVision→Report→etc.).
Conclusion
ProVision and the Revolution Power Quality Recorder can be powerful tools. A little time spent getting familiar with the various reports and graphs available and the necessary set-up to ensure good data collection for the job is well worth it.