
Abstract
PQ Canvass is the next generation of online power quality analysis tools provided by PMI. This new cloud service offers enhanced graphing, a full suite of PQ analysis tools, recording-based transactions, reports and live waveform analysis for cell-connected PQ recorders, all in standard web browser. This whitepaper discusses live waveforms with PQ Canvass in more detail.
General Overview
Live waveform analysis is a useful tool for identifying steady-state voltage levels, waveform distortion, and verifying a circuit and PQ recorder hook-up. Essentially, they are a “spot measurement” tool. This is not to be confused with triggered waveforms. With triggered waveforms, the device is configured with a set of thresholds – either a percentage +/- of nominal voltage or a total harmonic distortion percentage. These waveform captures are not discussed in this paper.
With PQ canvass, the live waveforms are streamed directly from the PQ monitor to the user’s web browser using a new technology called web sockets. This necessitates the use of a modern browser in order to be able to use PQ Canvass. (The author recommends Google Chrome if available to the user.) Despite the fact that this data is streamed over a cellular network with relatively low bandwidth and some latency, the “frame rate” presented to the user in live waveform capture mode is still relatively high.
PQ Canvass is fully supported in all modern iOS and Android-based mobile browsers. This feature enables live waveforms from an internet-connected smartphone or tablet, with no extra software needed.
How to View a Live Waveform Graph
Begin by logging into your PQ Canvass account at https://pqcanvass.powermonitors.com/.
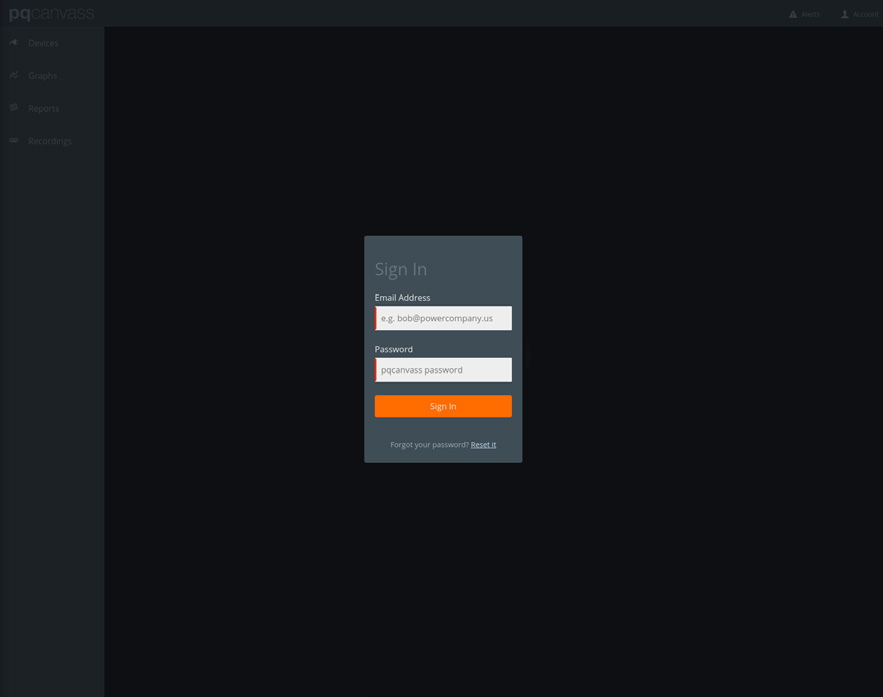
Once you have logged in, you will be dropped into the “Devices” overview. This view presents the user with a list of available devices (on a non-mobile device) and a map with each device in its user-specified location. (On a mobile device, only the map will be visible.)
Note the view selector on the left-hand side of the screen. The user can use this to navigate to different features of the PQ Canvass application: Devices (default view), Graphs, Reports, Recordings and Users.
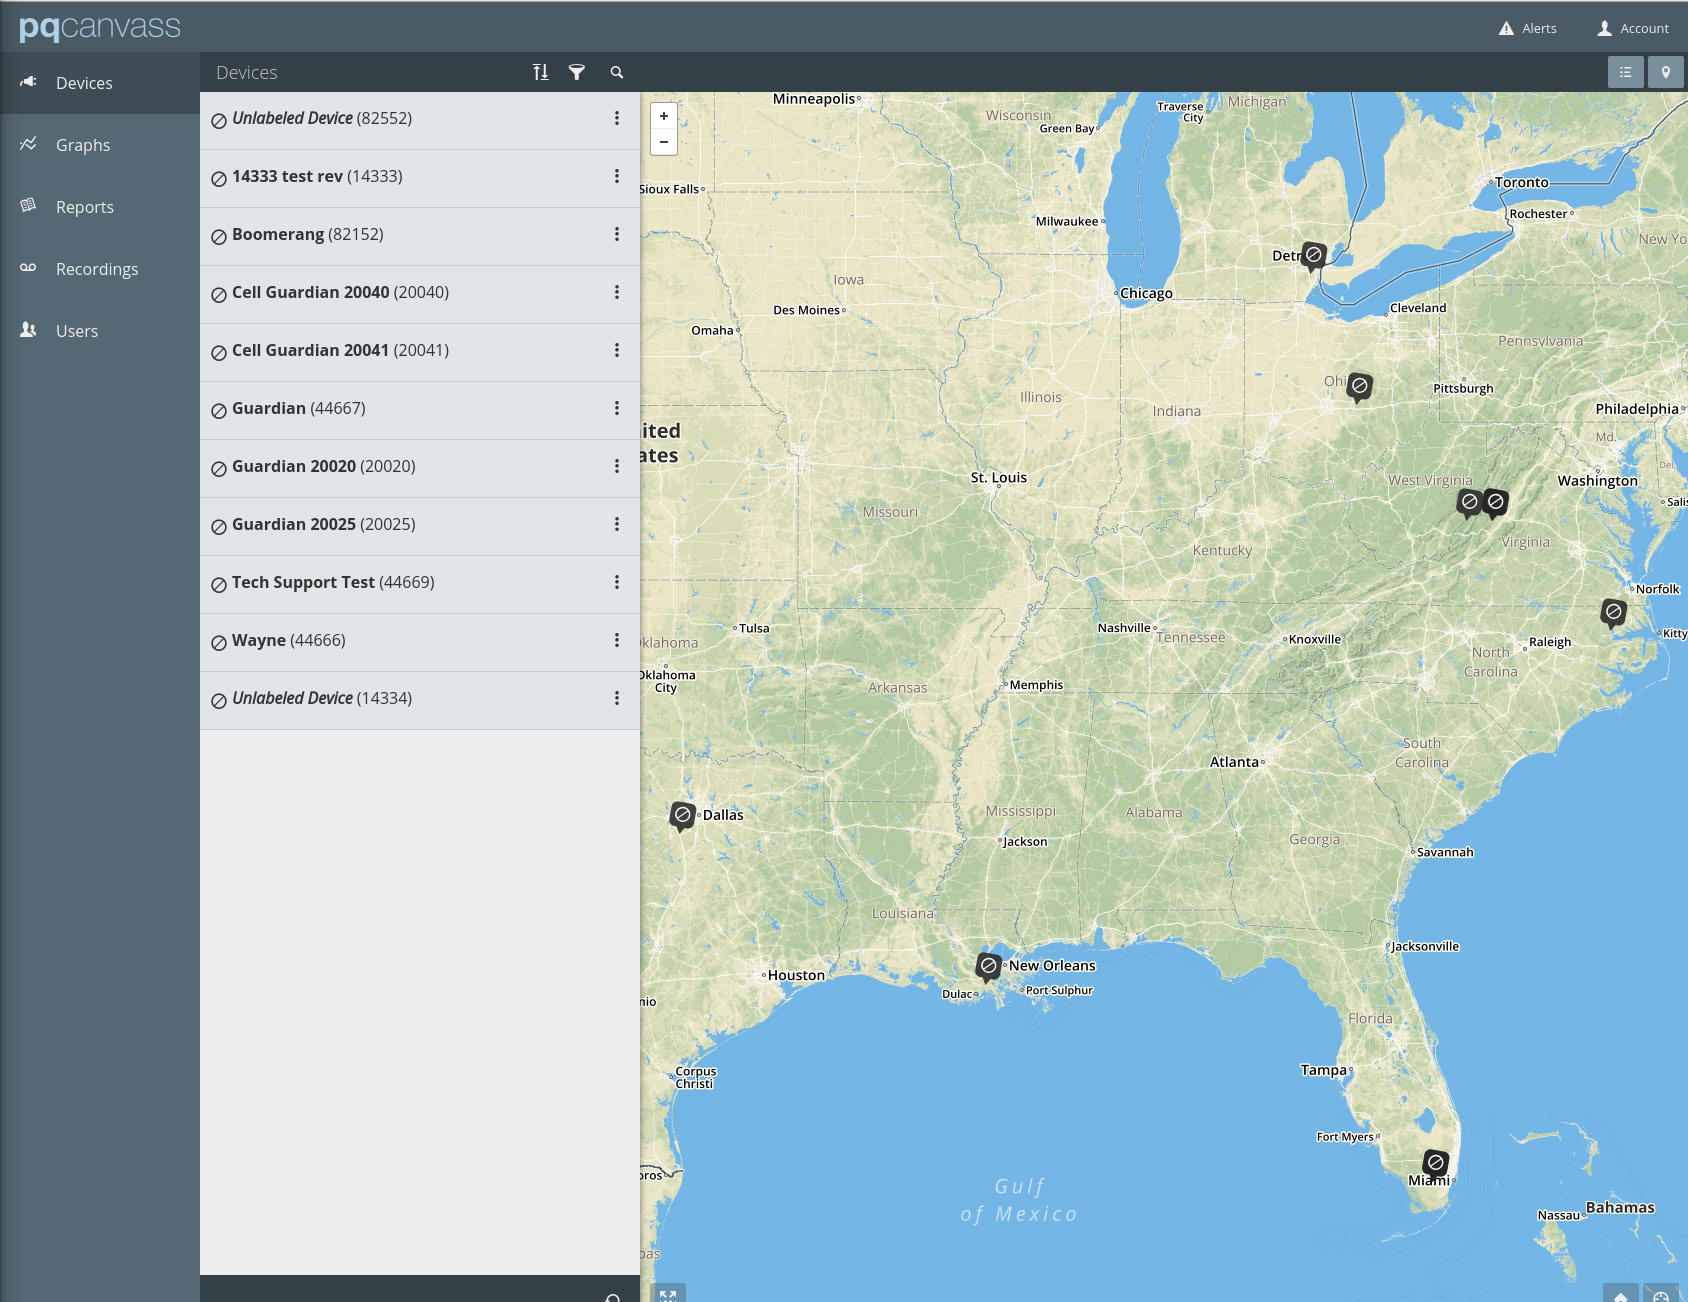
To view live waveforms, one of two options are available: from the Device tab or from the Graph tab.
From the Device Tab
In this view, simply scroll down to the device whose waveforms the user wishes to view. In this case, the author has selected device “Guardian 20020”. Click on the three small dots on the right-hand side of the line containing the selected device. This will expand the “quick select” toolbar.
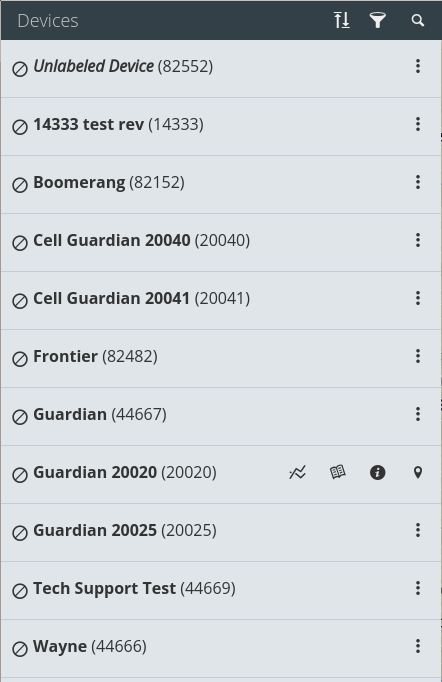
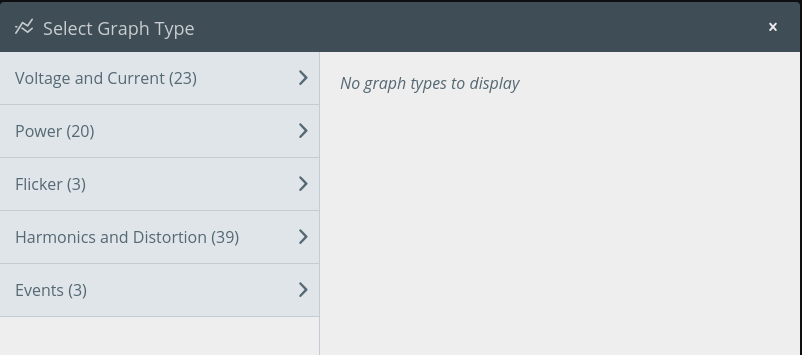
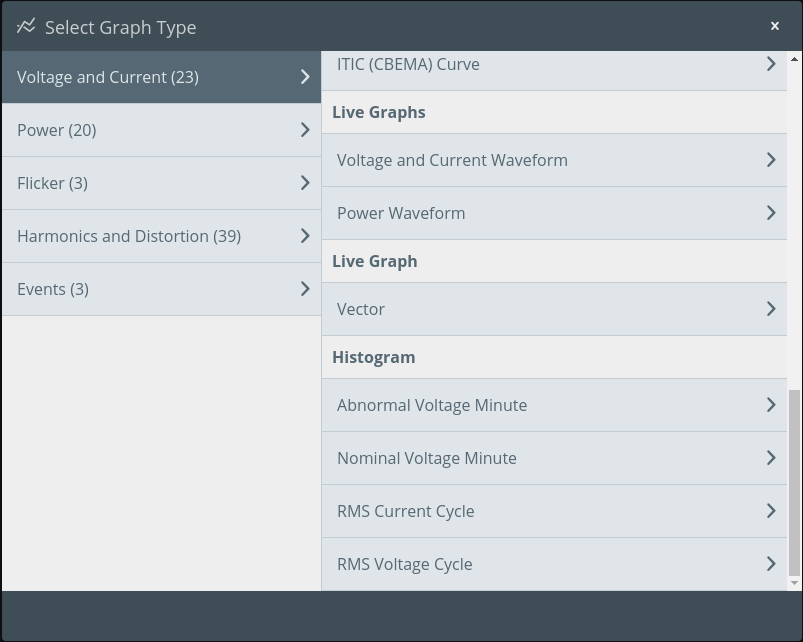
Once the toolbar is visible, select the Graph option. This will present the user with a “Select Graph Type” dialog. Select “Voltage and Current.” Now scroll down to “Live Graphs” and select “Voltage and Current Waveform.”

The screen should display a pair of “waiting” icons until the device can be reached. As soon as the device has been connected to, live waveforms will begin to stream.
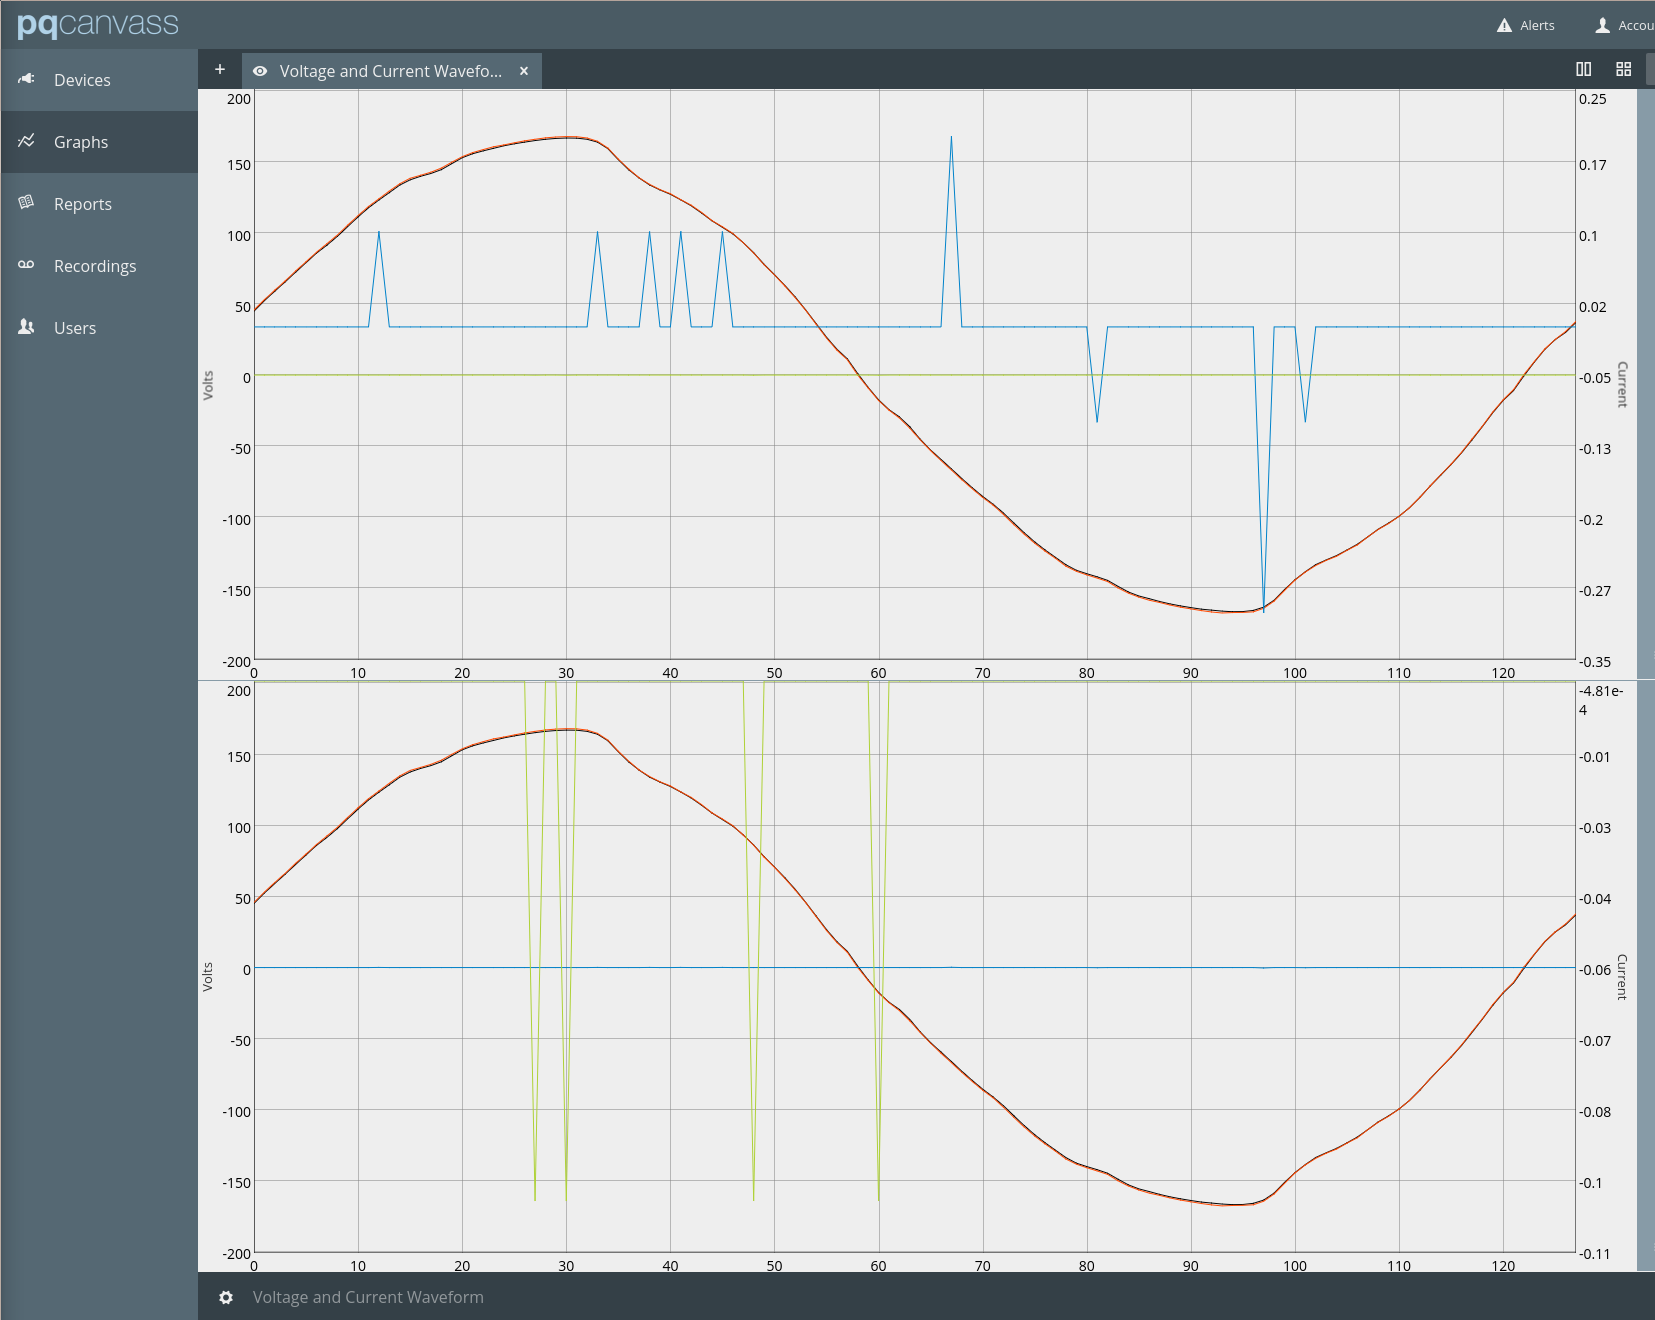
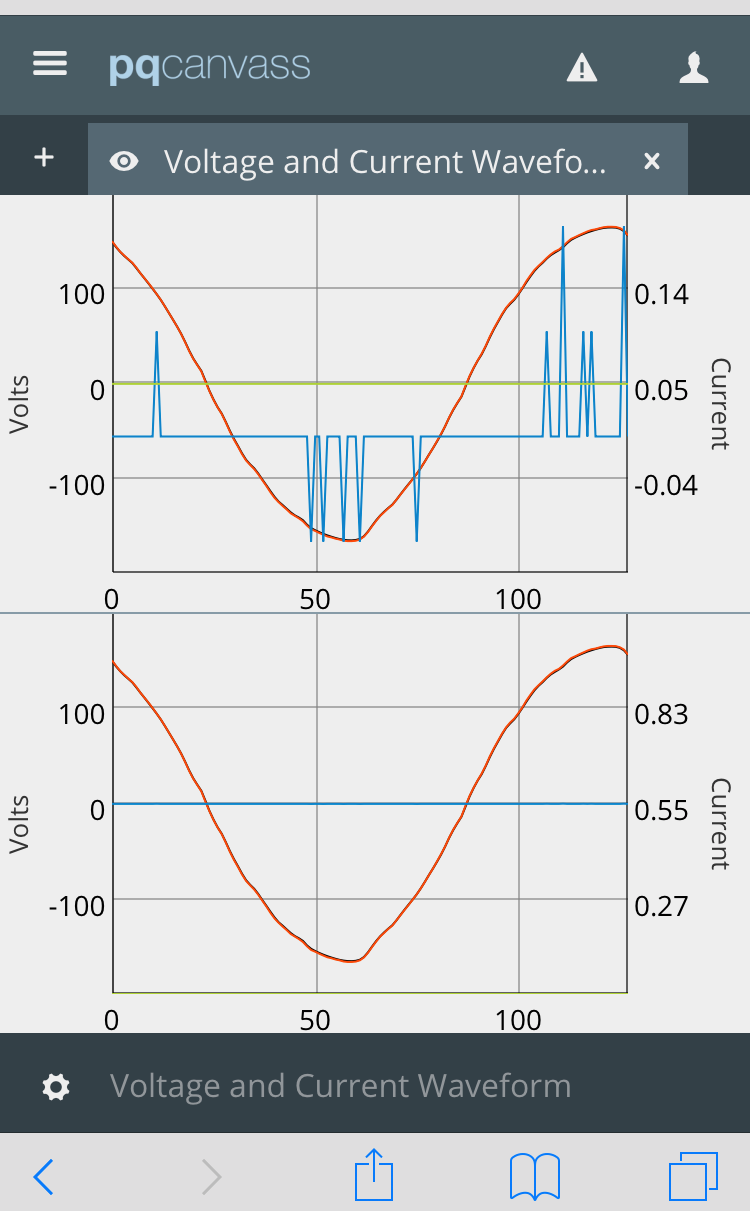
Once the stream of live waveforms has begun, it will continue for up to sixty (60) seconds. If the user desires to initiate another live waveform session, the same steps from above need to be repeated.
From the Graph Tab
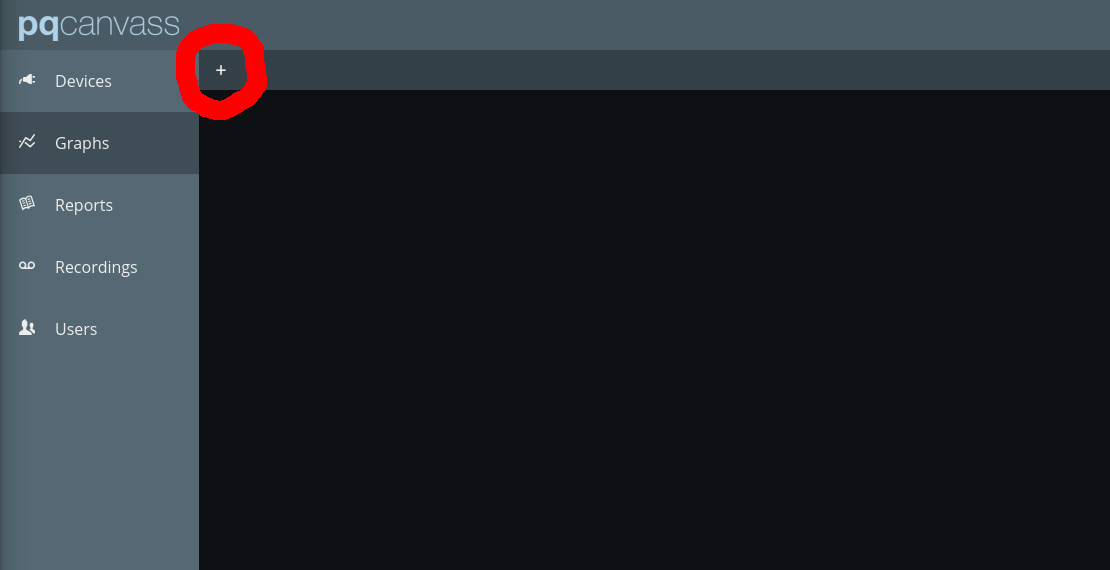
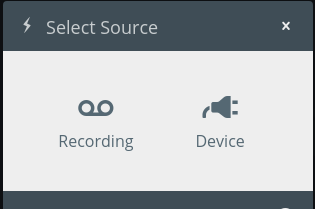
Starting from the Graph Tab, click on the “+” icon at the top of the blank space on the screen. This will bring up the source selector. Select “Device.”
The device selection window should now be visible. Scroll until the desired device is visible and select it.
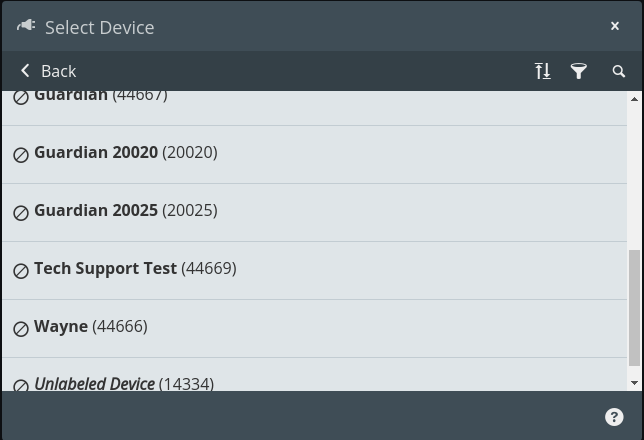
The “Voltage and Current” graph selection should already be highlighted. From this view, scroll down until the “Live Graphs” sub-heading is visible and then select “Voltage and Current Waveform.” The user should now see live waveforms updating on the screen.
Vector Diagrams
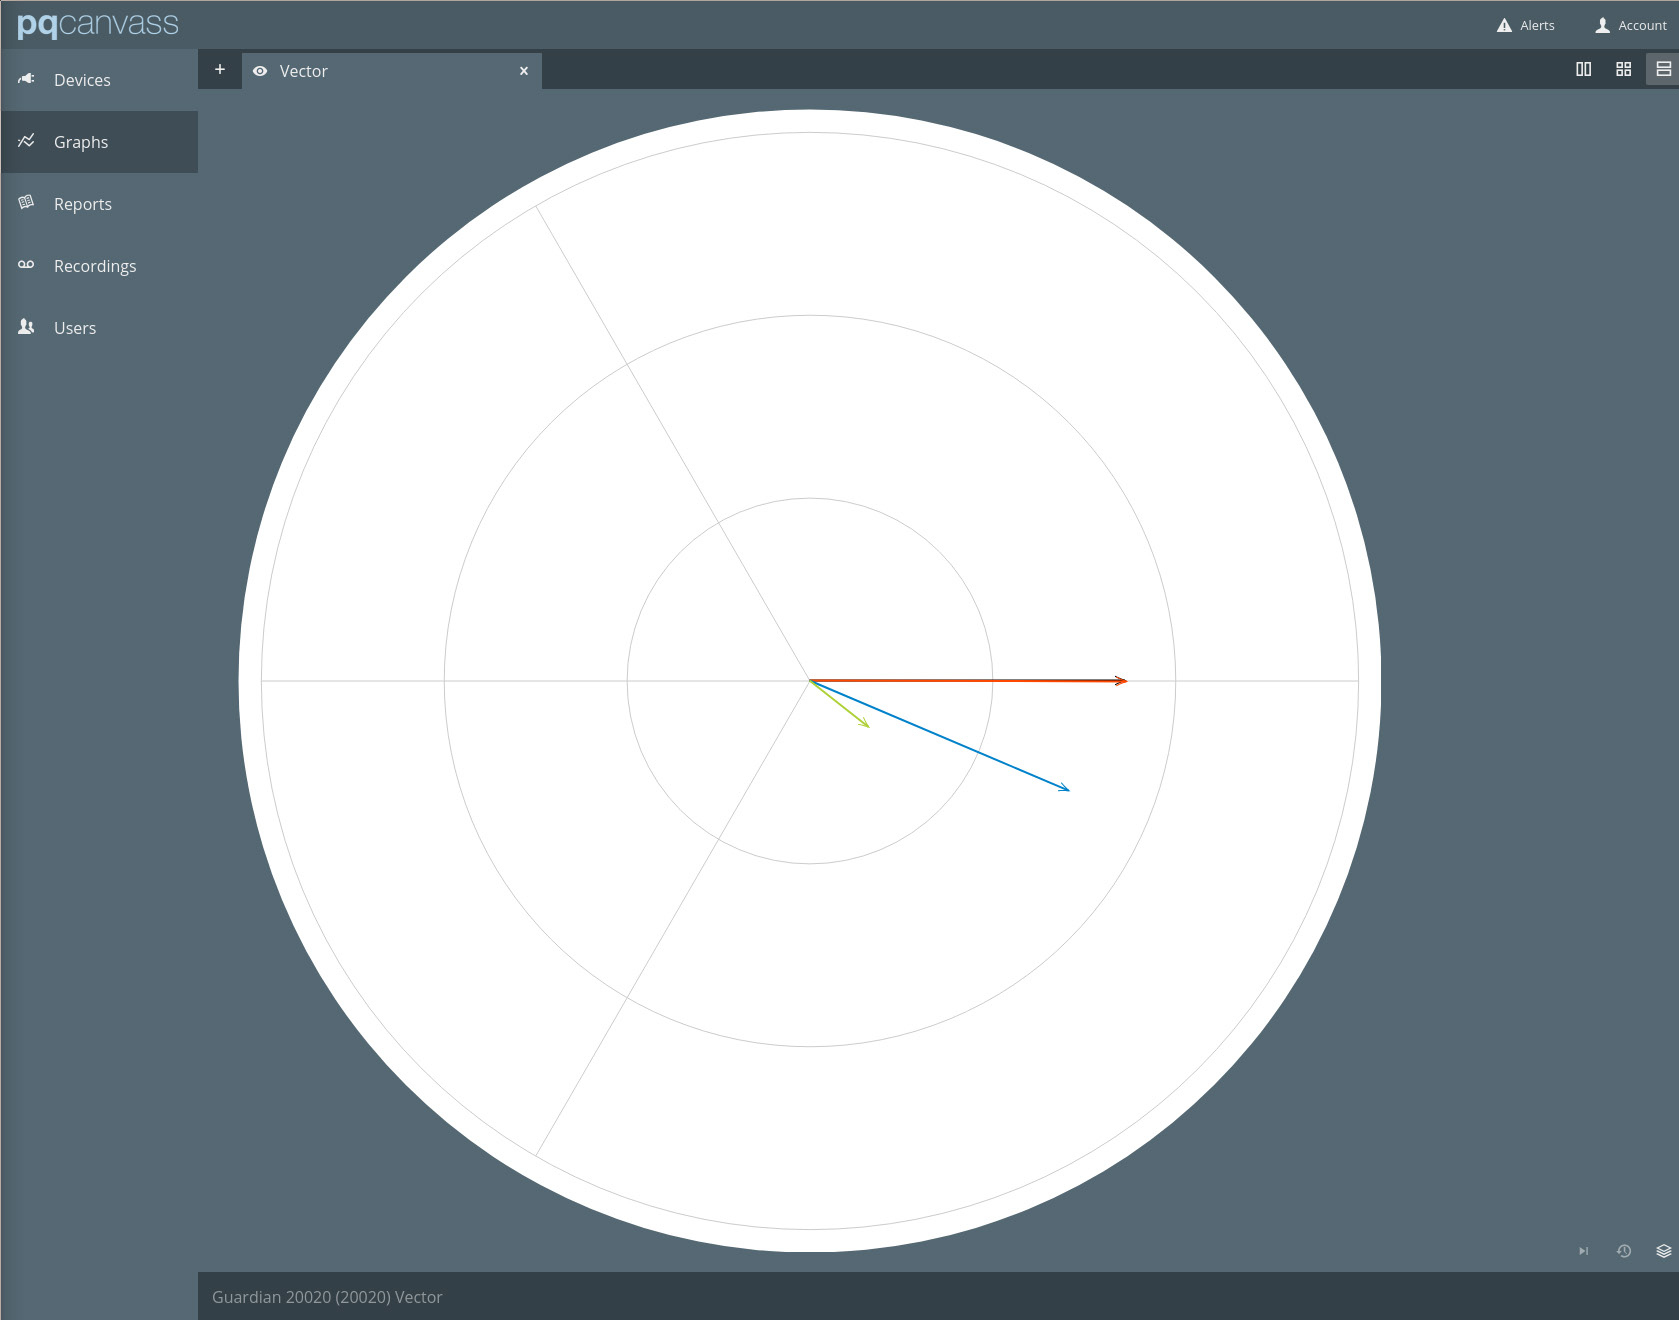
In addition to the waveform line graphs, the user can generate a phasor plot (vector diagram) for live waveform data. This graph has vector (trace) per channel. The length of the vector is representative of the magnitude, and its angle within the circle is indicative of the phase angle (0 degrees or radians at the top of the circle, 180 degrees or pi radians at the bottom of the circle).
This graph is useful for verifying that a recorder is connected correctly, especially with CT phasing and direction.
Useful Information in Waveforms
While the live waveforms are streaming (or even when the stream has completed), the user can mouse over (or on a mobile device tap) any point of the waveform capture to get a legend that can show the instantaneous (non-RMS) value for each channel of displayed voltage and current.
The live waveforms feature can be useful for making spot measurements or trying to capture one-off events – such as motor startups – as they happen. While the refresh rate isn’t blisteringly fast (a limitation of cellular networks with high latency), the event will likely still be captured and presented in the stream.
Other Live Waveform Mechanisms
PQ Canvass is a cloud-based system that only requires an internet-connected web browser, making it a very convenient method for accessing live data. There are other mechanisms for accessing waveforms from a cell-based PQ recorder. ProVision allows a direct connection to any PMI cell recorder and can display live voltage and current waveforms in a manner similar to PQ Canvass. This method may be required if the PQ recorder is in a closed, private network.
Conclusion
Live waveforms are an especially useful tool to spot-check voltage and current levels, check for steady-state harmonic distortion and verify recorder hook-up with a cell PQ recorder. PQ Canvass now allows users to access live data with any internet-connected browser on a PC, smartphone, or tablet.