
Abstract
PQ Canvass now supports viewing RMS Voltage in a virtual Delta hookup (Line-Line) when the device is hooked up to a Wye configuration (Line-Neutral) and initialized as such. This feature is available for any supported device or recording in stripchart, daily-profile, histogram, and waveform graphs. Troubleshooting PQ problems or determining load imbalances across phases instead of just across the neutral is now available with the simple click of a button.
Better Analysis, Faster
Utilizing this feature in the field helps to uncover possible line imbalance issues or assist in PQ problem troubleshooting. Being able to view RMS Voltage values in either configuration on demand aids in analysis, and prevents from having to manually reconnect the device in a Delta configuration with a subsequent recorder re-initialization. This results in real savings of both time and money, as analysis can be performed on the device without having to go to the site, reconfigure the device for a Delta hookup, and possibly having to go out again when that recording is ready to be downloaded (if it is not being streamed).
Most utility metrics (steady state voltage, flicker, harmonics, etc.) are specifically thresholded with phase (line-neutral) measurements. However, customer equipment is connected using (line-line) voltages. Ensuring utility regulatory compliance necessitates one type of measurement, while troubleshooting customer problems is better served with the other measurement. With this update, a single recording allows both types of analysis.
Imbalance Detection with Delta Voltage
While Wye (Line-Neutral) voltage graphs show per-phase conditions, Delta (Line-Line) voltages reflect the real-time relationships across phases—capturing both magnitude and phase-angle differences. Even if all three phase voltages appear stable in Wye view, their combined effect in Delta may show subtle swings, distortions, or long-term imbalance patterns. Neutral problems generally affect line-neutral readings but not line-line values.
In a balanced system, the Delta voltages should track closely together with minimal spread. If one line-to-line pair consistently drops or diverges during certain load conditions or times of day, it may indicate unbalanced three-phase loading, a single-phased cap bank, or phase interaction issues. By graphing Delta voltage over time, users can uncover patterns and timing of imbalances that aren’t obvious in phase-to-neutral data—allowing for more targeted analysis and faster resolution of power quality issues.
Using This Feature
Guardians, Seekers, and Bolts with the latest firmware (version 1.74 or higher) support this feature in PQ Canvass streaming data format and recordings uploaded to PQ Canvass using our PMI View application for Windows™ (version 1.1.6.0 or higher) or iOS® (available 2Q 2025). No additional initialization parameters are needed to utilize this new feature; simply update to the newest firmware version and re-initialize your recorder.
The Guardian is a single-phase recorder. With this new feature, the Guardian now simultaneously measures and records both 120V legs (as before), and the 240V full transformer output. All three voltages are available in the stripcharts, waveforms, and other data types.
Strip Charts
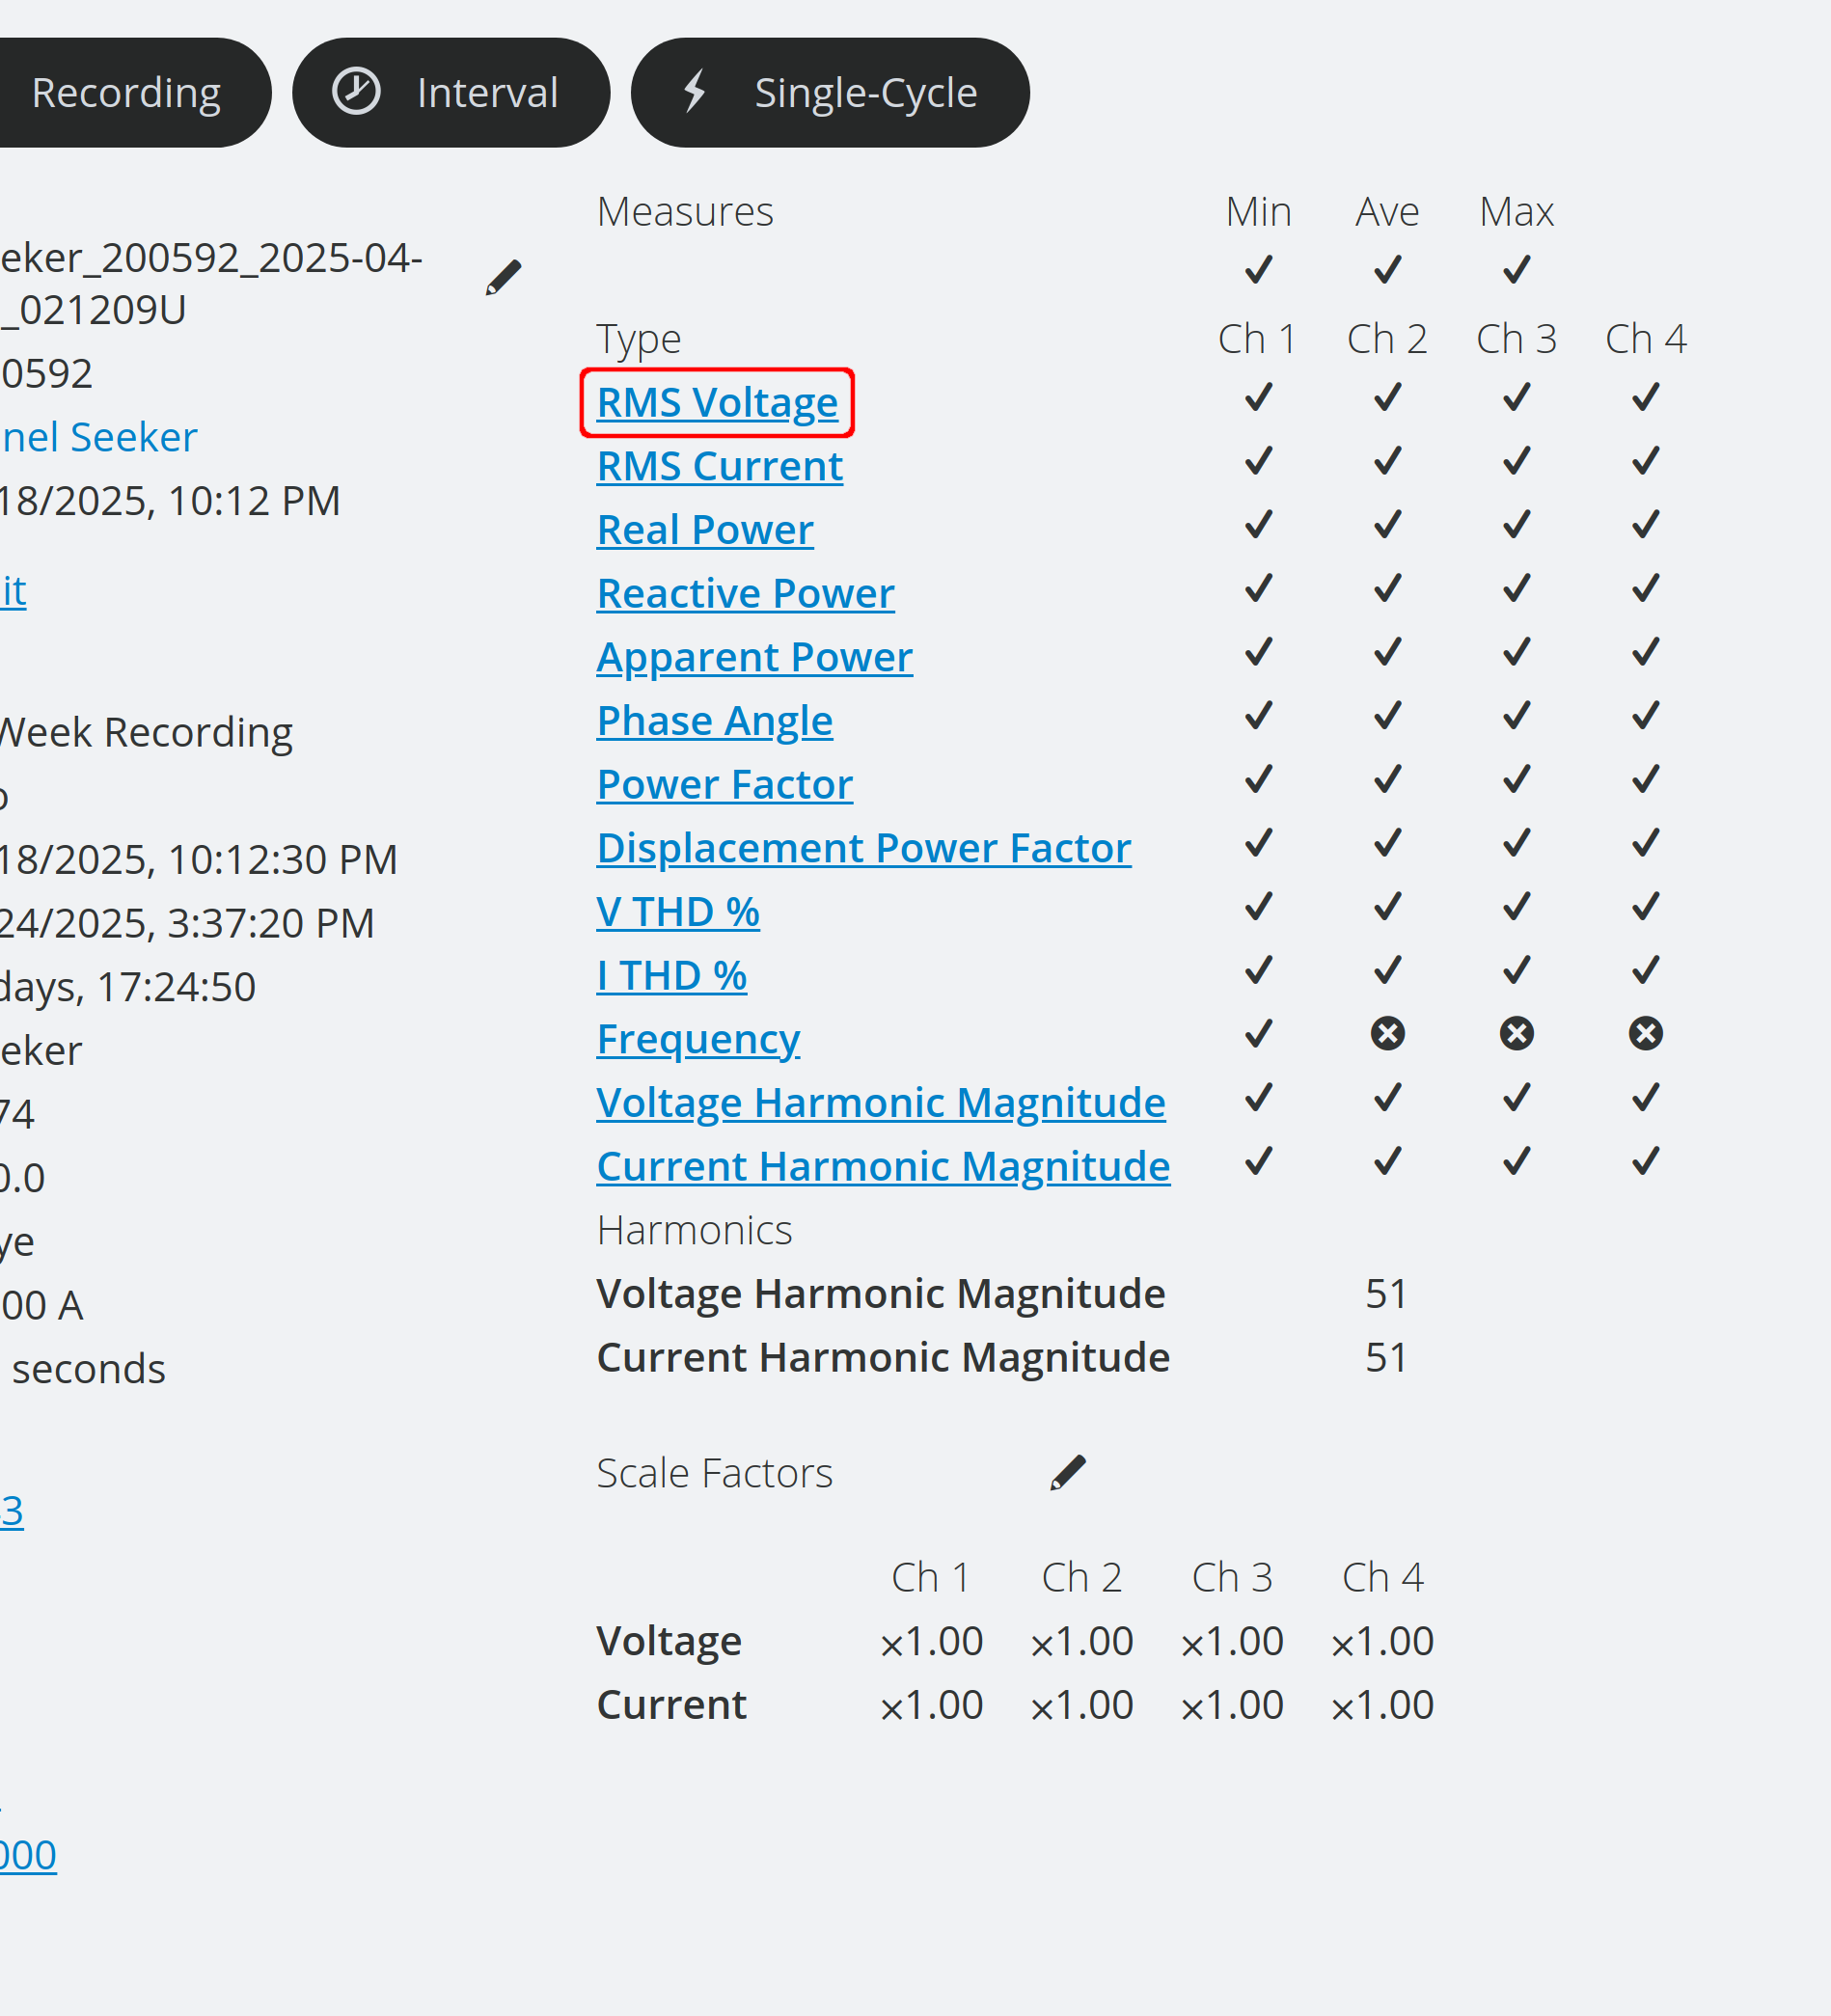
To view Delta (Line) RMS Voltage in PQ Canvass, navigate to the recording of a supported device and select either the RMS Voltage link under the measures section or click on the Interval graph template selector.
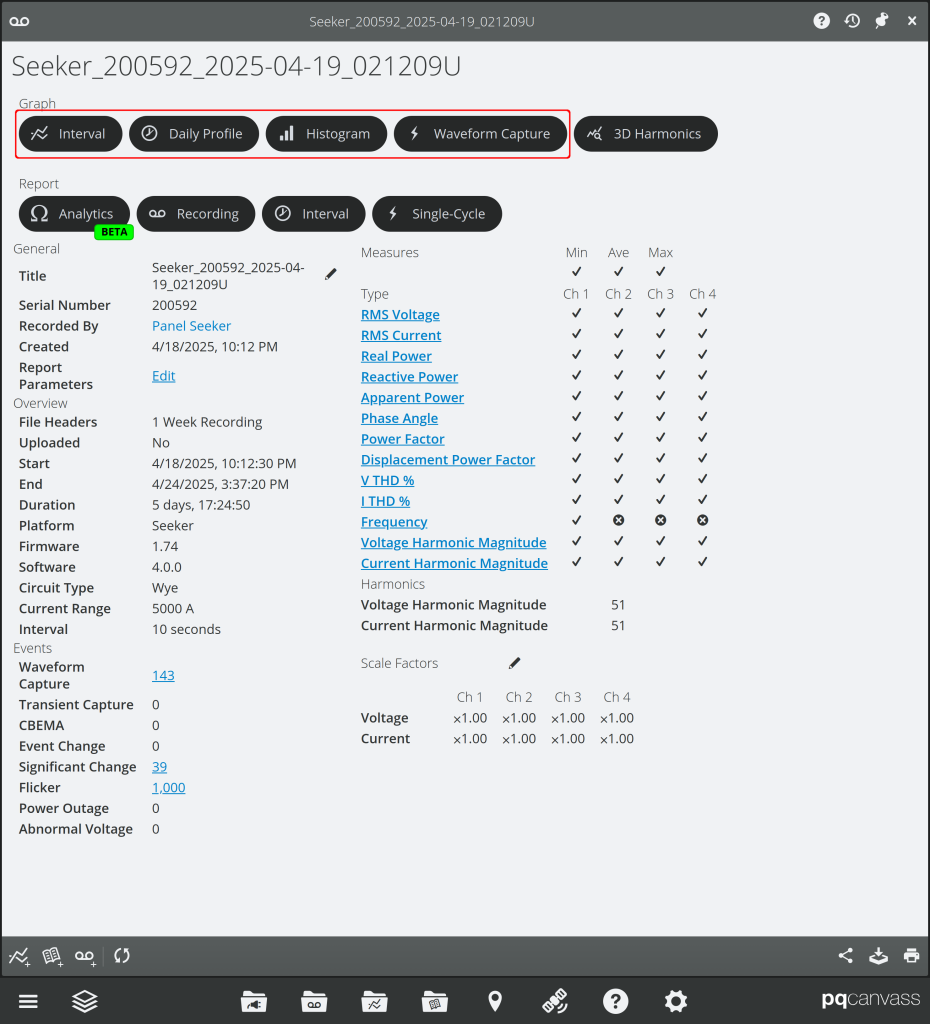
Once in this graph, the bottom toolbar contains the Toggle Voltage Configuration menu, allowing one to select either Phase or Line.

Phase will show the RMS Voltage for the device’s active Wye configuration, whereas Line will display the computed Delta configuration RMS Voltage for the same timespan. Note that this menu will not show for devices/recordings that do not support this feature.
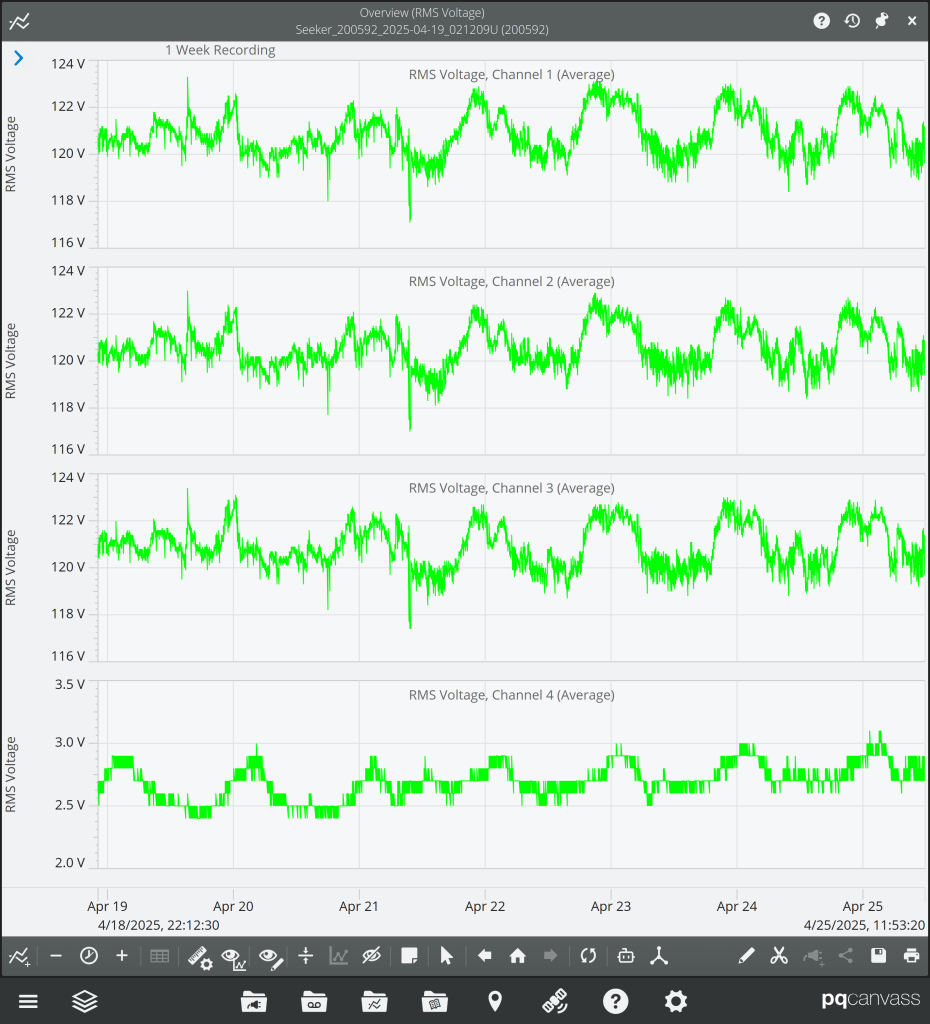
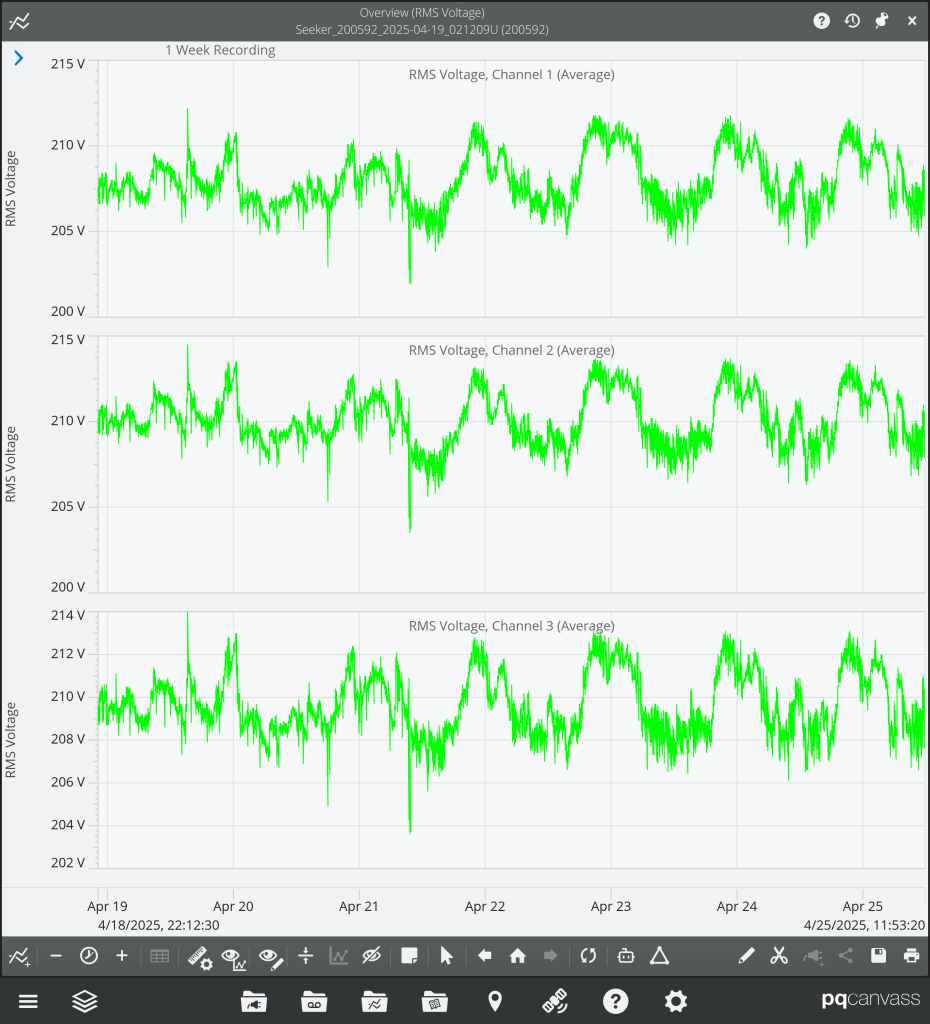
Stripcharts provide insight into the periodic or intermittent nature of imbalances that may be more readily apparent in Delta that may not be immediately visible in Wye RMS Voltage graphs. Seeing how long or how frequent these disturbances occur can assist in power quality analysis of why these issues are happening and how badly they may affect power distribution on the same circuit.
Daily Profiles
In the device’s Quick Access View, clicking on the active recording will take you right to the device’s most recent or active recording, or you can open the Recording List under Recordings to see a list of the most recent recordings for the device.
Once on the Recording page, navigate to the Daily Profile graph templates, and select RMS Voltage. In the bottom toolbar, you can switch between Phase or Line RMS Voltage. This menu will not show for devices/recordings that do not support this feature.
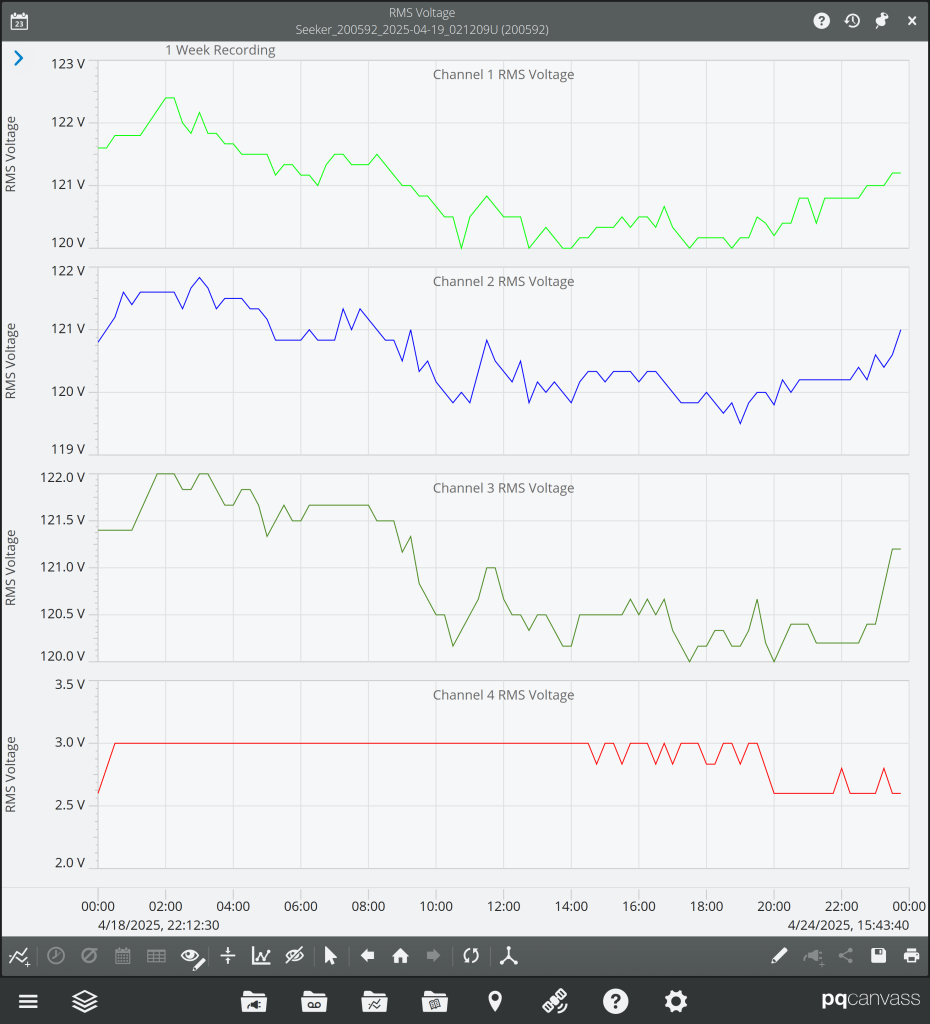
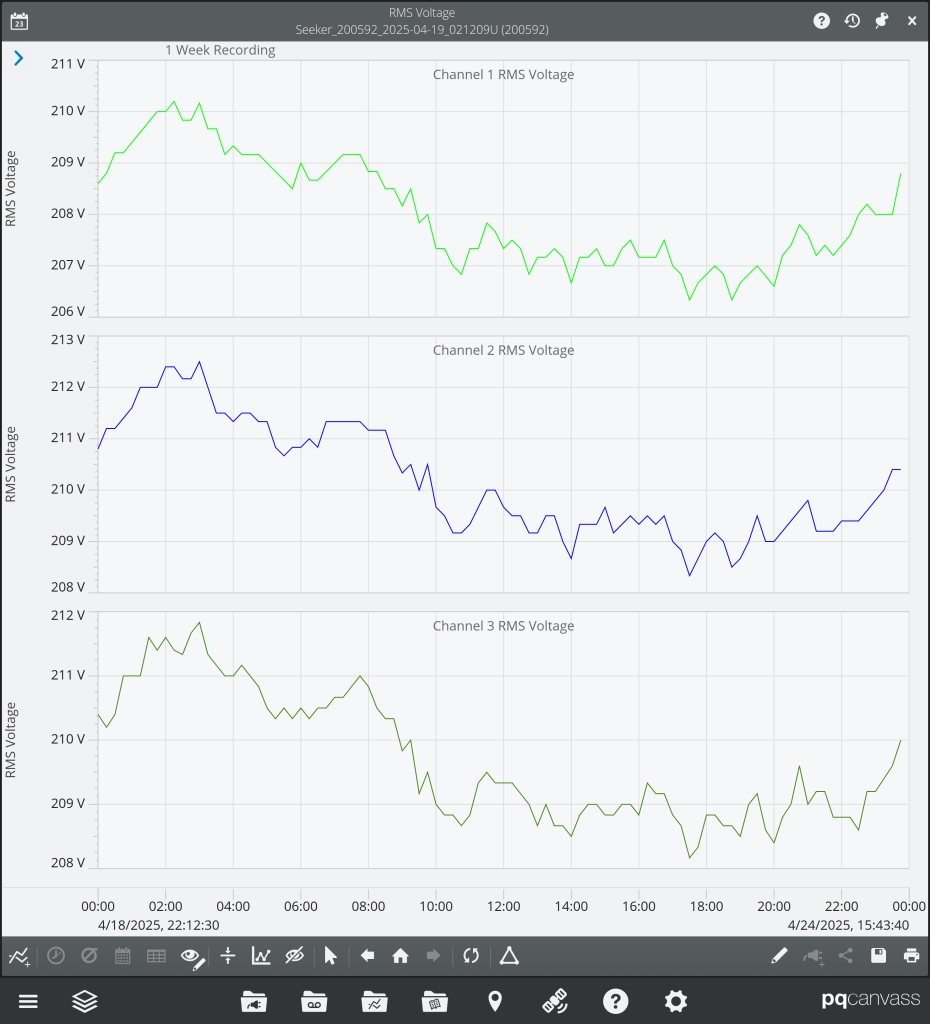
Delta and Wye comparisons in Daily Profile graphs make load imbalances or line-line voltage sags that occur around the same time during certain days of the week more apparent. When buildings power on certain equipment in the morning and turn them off in the evening, a disruption in load balancing would present itself during those specific times; this would in turn assist in PQ analysis of where problems may be stemming from.
Histograms
On the Recording page, navigate to the Histogram Graph template selector, and choose RMS Voltage. In the bottom toolbar, if the recording supports switching, you can choose either Phase or Line voltage.
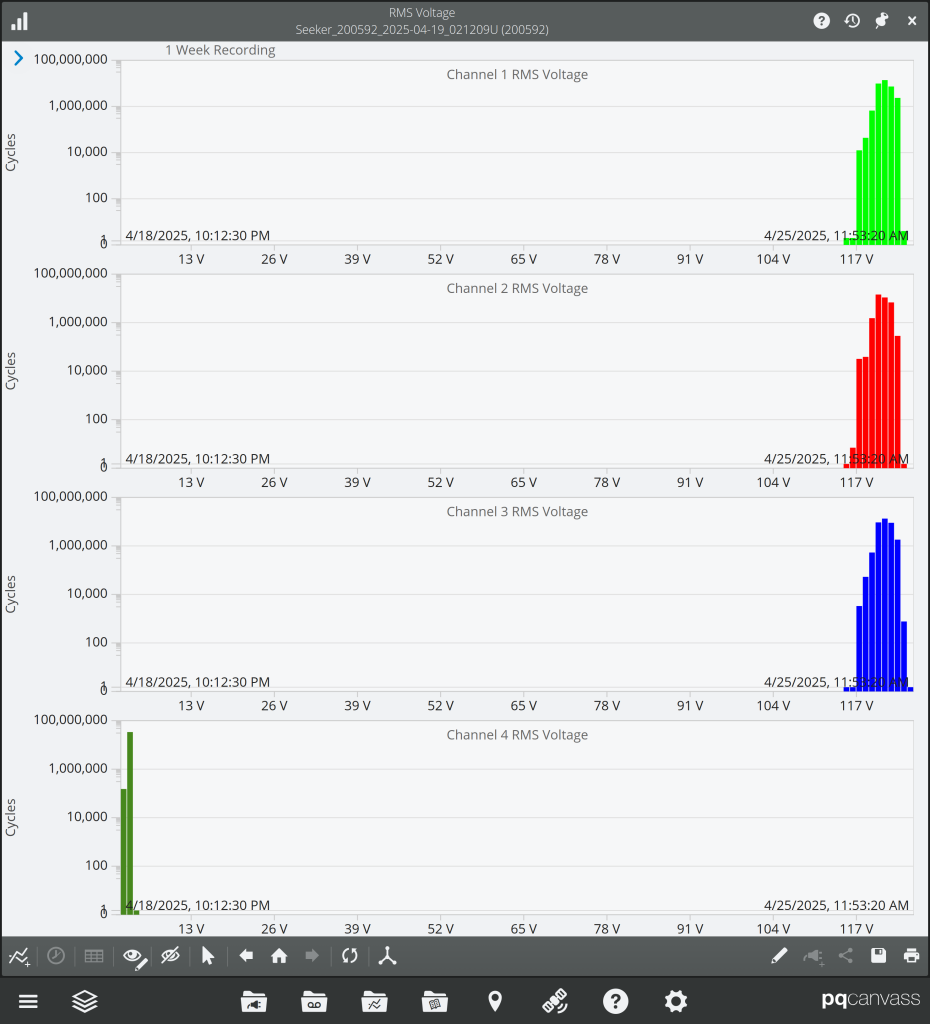
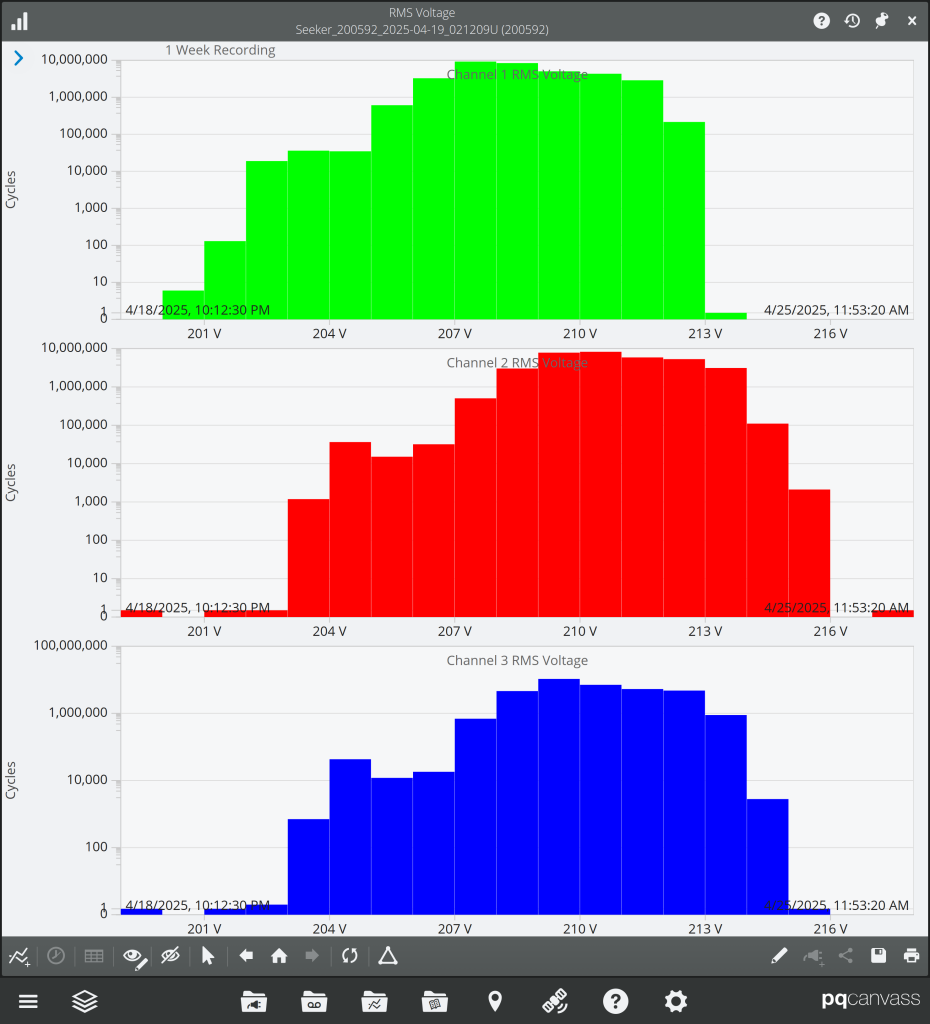
Delta/Wye histograms help to rapidly illuminate outliers in phase imbalances or neutral disturbances in comparison to nominal voltages for each phase. Knowing at a quick glance whether imbalances are occurring, and how drastically, can help to determine whether a greater investigation is needed into the recorded data or if the area being monitored needs to continue to be monitored.
Waveforms
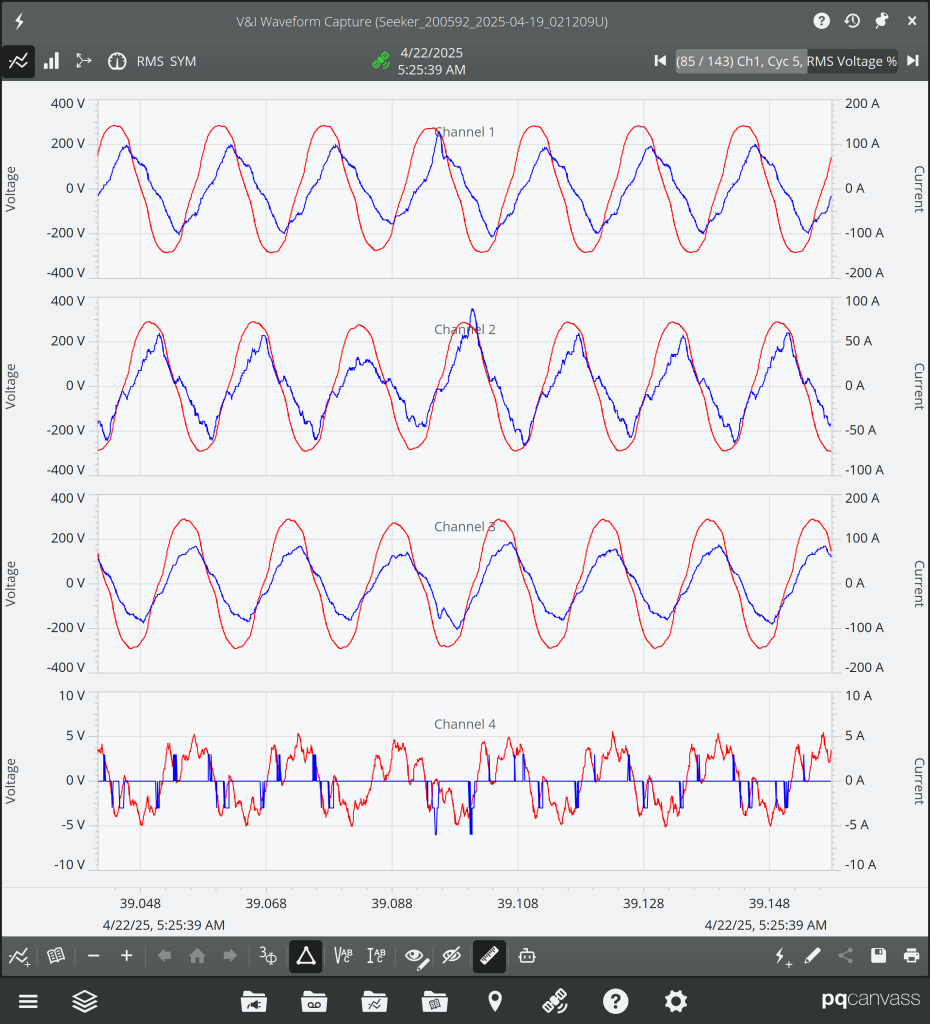
Both live waveforms and recording waveform captures utilize our new Phase/Line voltage feature. Live waveform analysis gives in-depth information on a cycle-by-cycle level of distortions from load imbalances, as well as transients or harmonics that could be caused from power distribution equipment like transformers. Toggling the view is as simple as clicking the outlined button in the figure below.
Conclusion
With the addition of the Delta/Wye feature to PQ Canvass and PMI View, it has never been easier to analyze, track down, and resolve power quality and reliability issues. In addition to being a helpful analysis tool, this feature can also prevent unnecessary dispatching of personnel to alter recorder hookups and time wasted waiting for PQ issues to arise again for analysis during the subsequent recording.