
Abstract
This power quality case study describes an industrial customer who was experiencing machine shutdowns in his manufacturing facility. These shutdowns were resulting in losses very costly to this die manufacturer. The utility was called in the belief that the disturbances were coming from the outside.
Investigation Results
This customer (Plant 1) was fed from a 12.47KV distribution circuit. The parent company owns another plant (Plant 2) about 1/4 mile from Plant 1 on the same road and fed by the same circuit.
The utility conducted two investigations. Study A was conducted from 4/28/03 through 6/13/03. Monitors were installed at both plant locations. Study B was conducted from 11/3/04 through 1/17/05. Results were as follows:
In study A, 75% or 21 of 28 sags recorded at Plant 1 were caused by current spikes at Plant 2. Figures 1 and 2 show this. Both figures show voltage in the top trace and current in the lower trace. Figure 1 shows current spikes occurring at the same time the voltage sags occur. Figure 2 shows the same voltage sags as in Figure 1 but does not show any current spikes. This indicates the current spikes at Plant 2 caused the voltage sags. Range of depth was 5% to 8% with durations of 1 to 4 cycles. The utility determined that the current spikes and sags were caused by a machine at Plant 2 designed to remove dust particles from the air to prevent product contamination. Dust particles were removed with an electric arc. Each arc caused a large increase in current, which resulted in voltage sags at Plant 1. Conflicting reports were received regarding the impact of the sags caused by Plant 2. The source of twenty-five percent of the sags recorded was not identified.
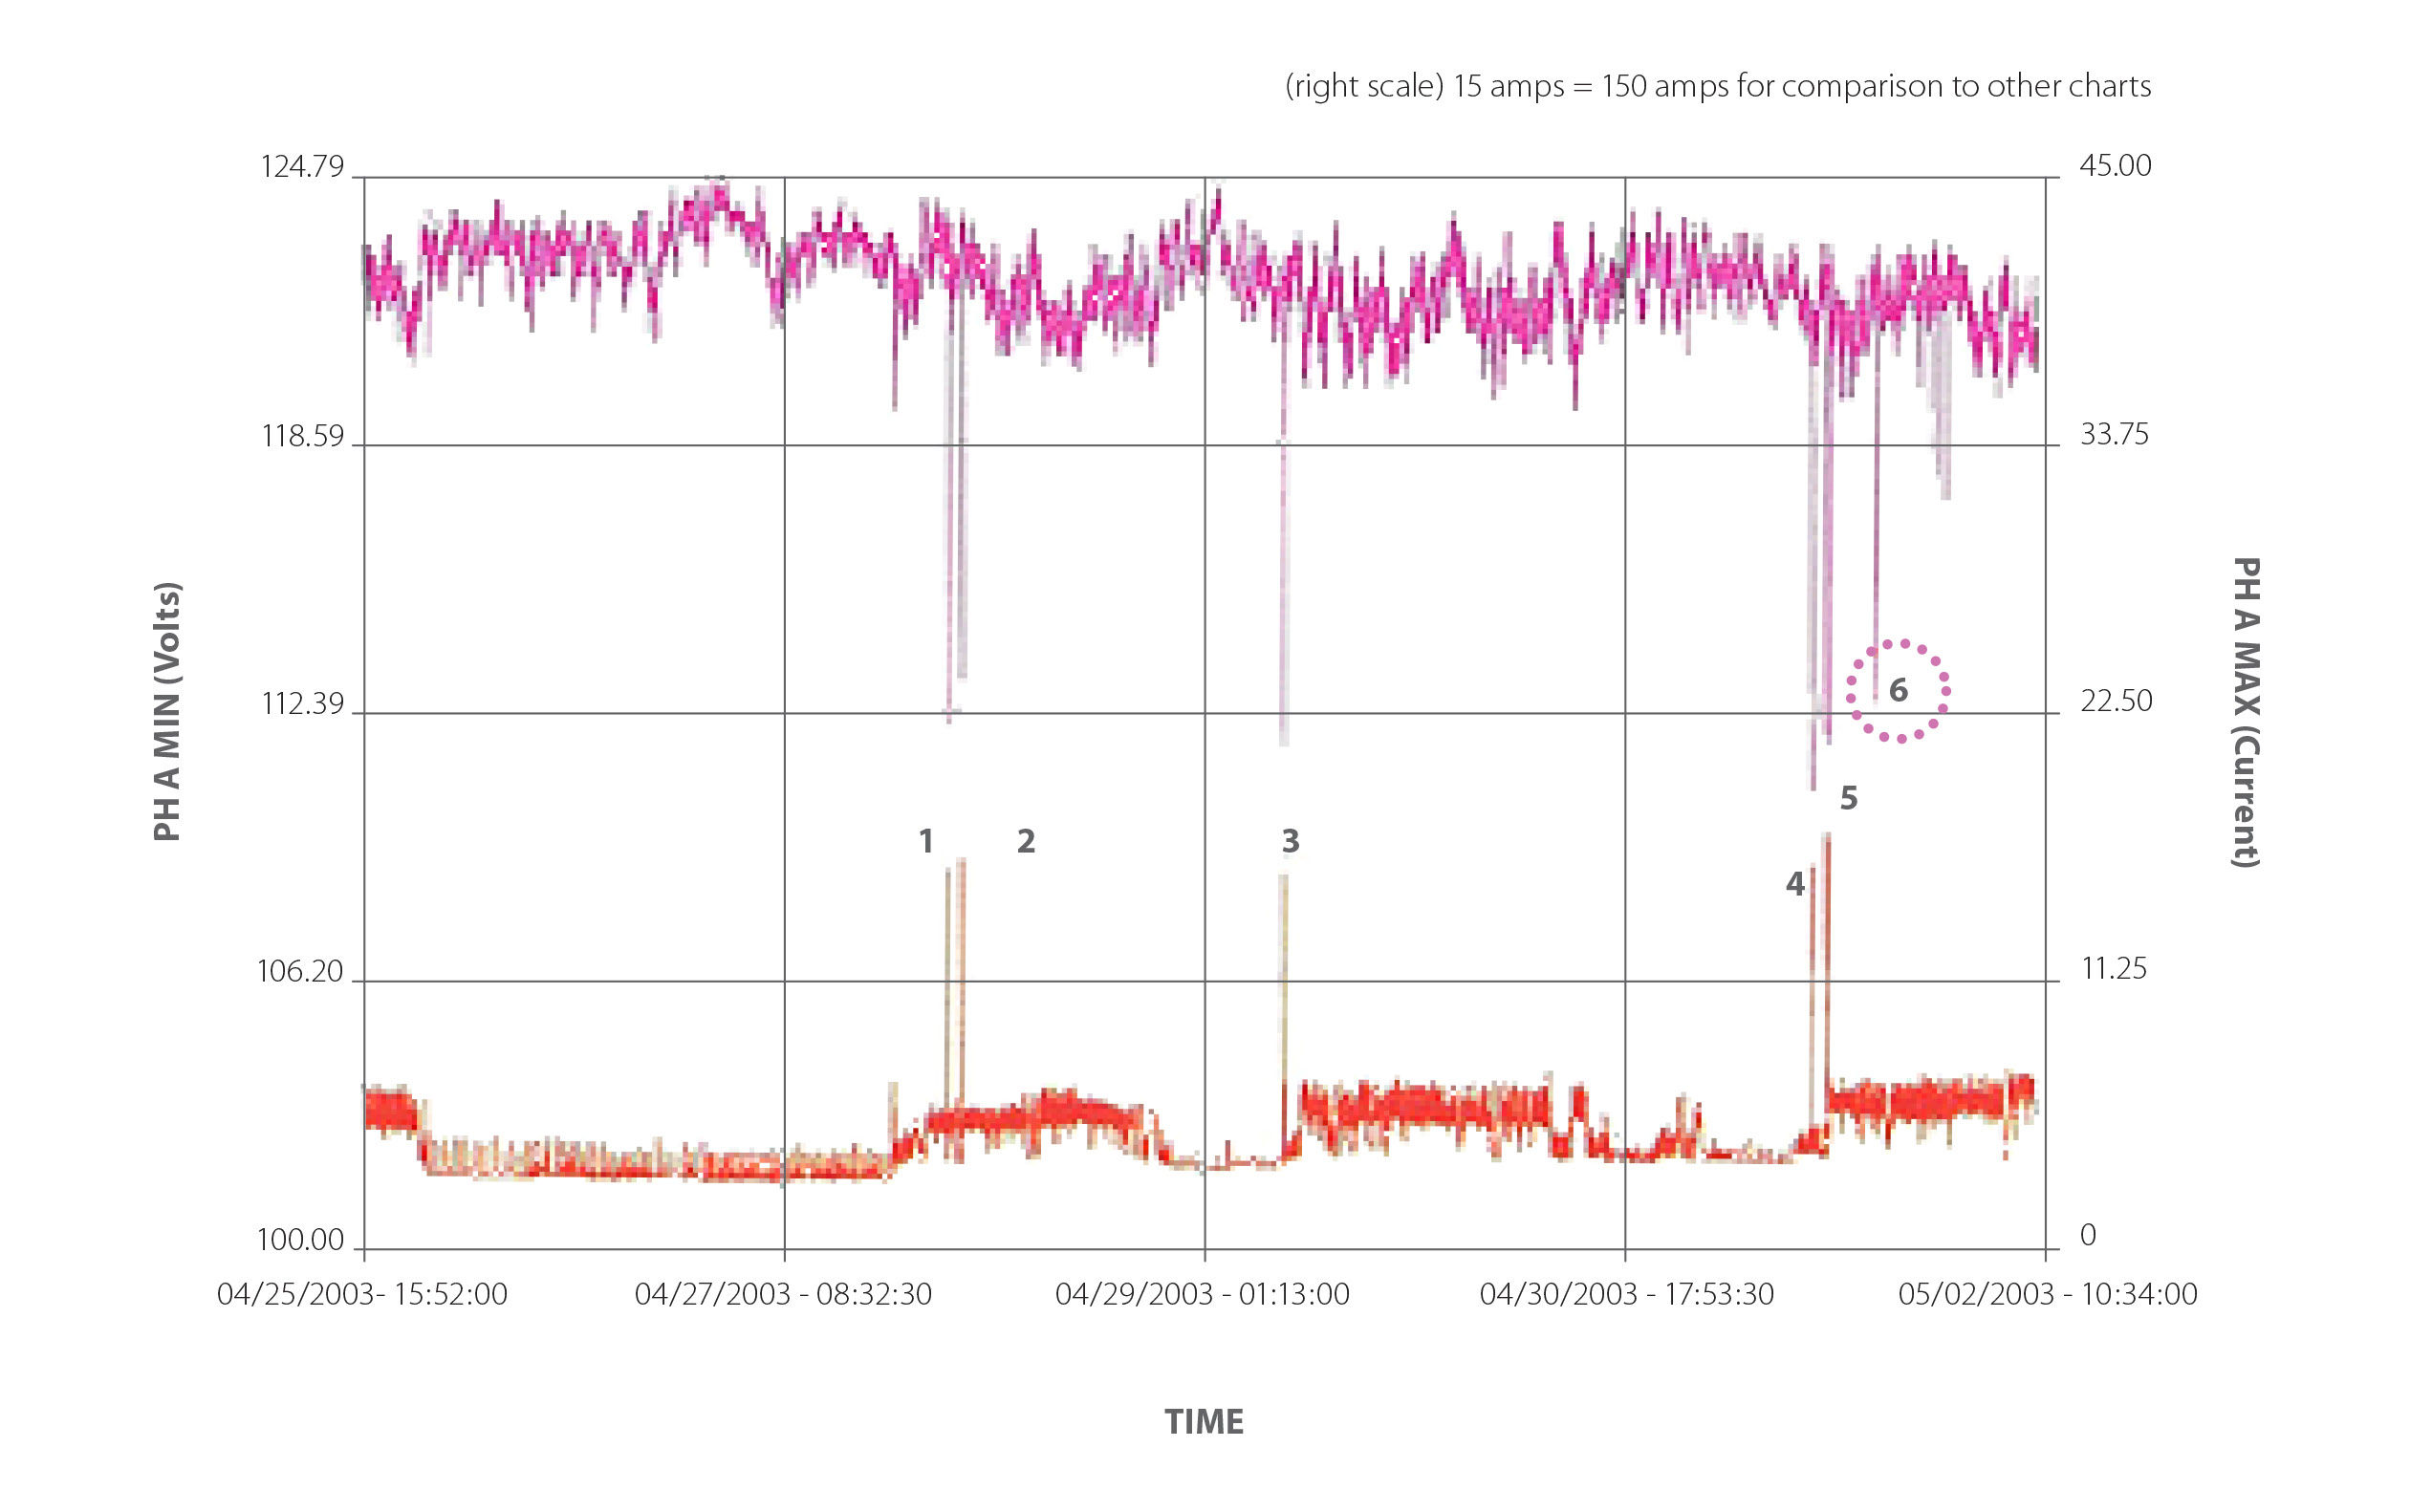
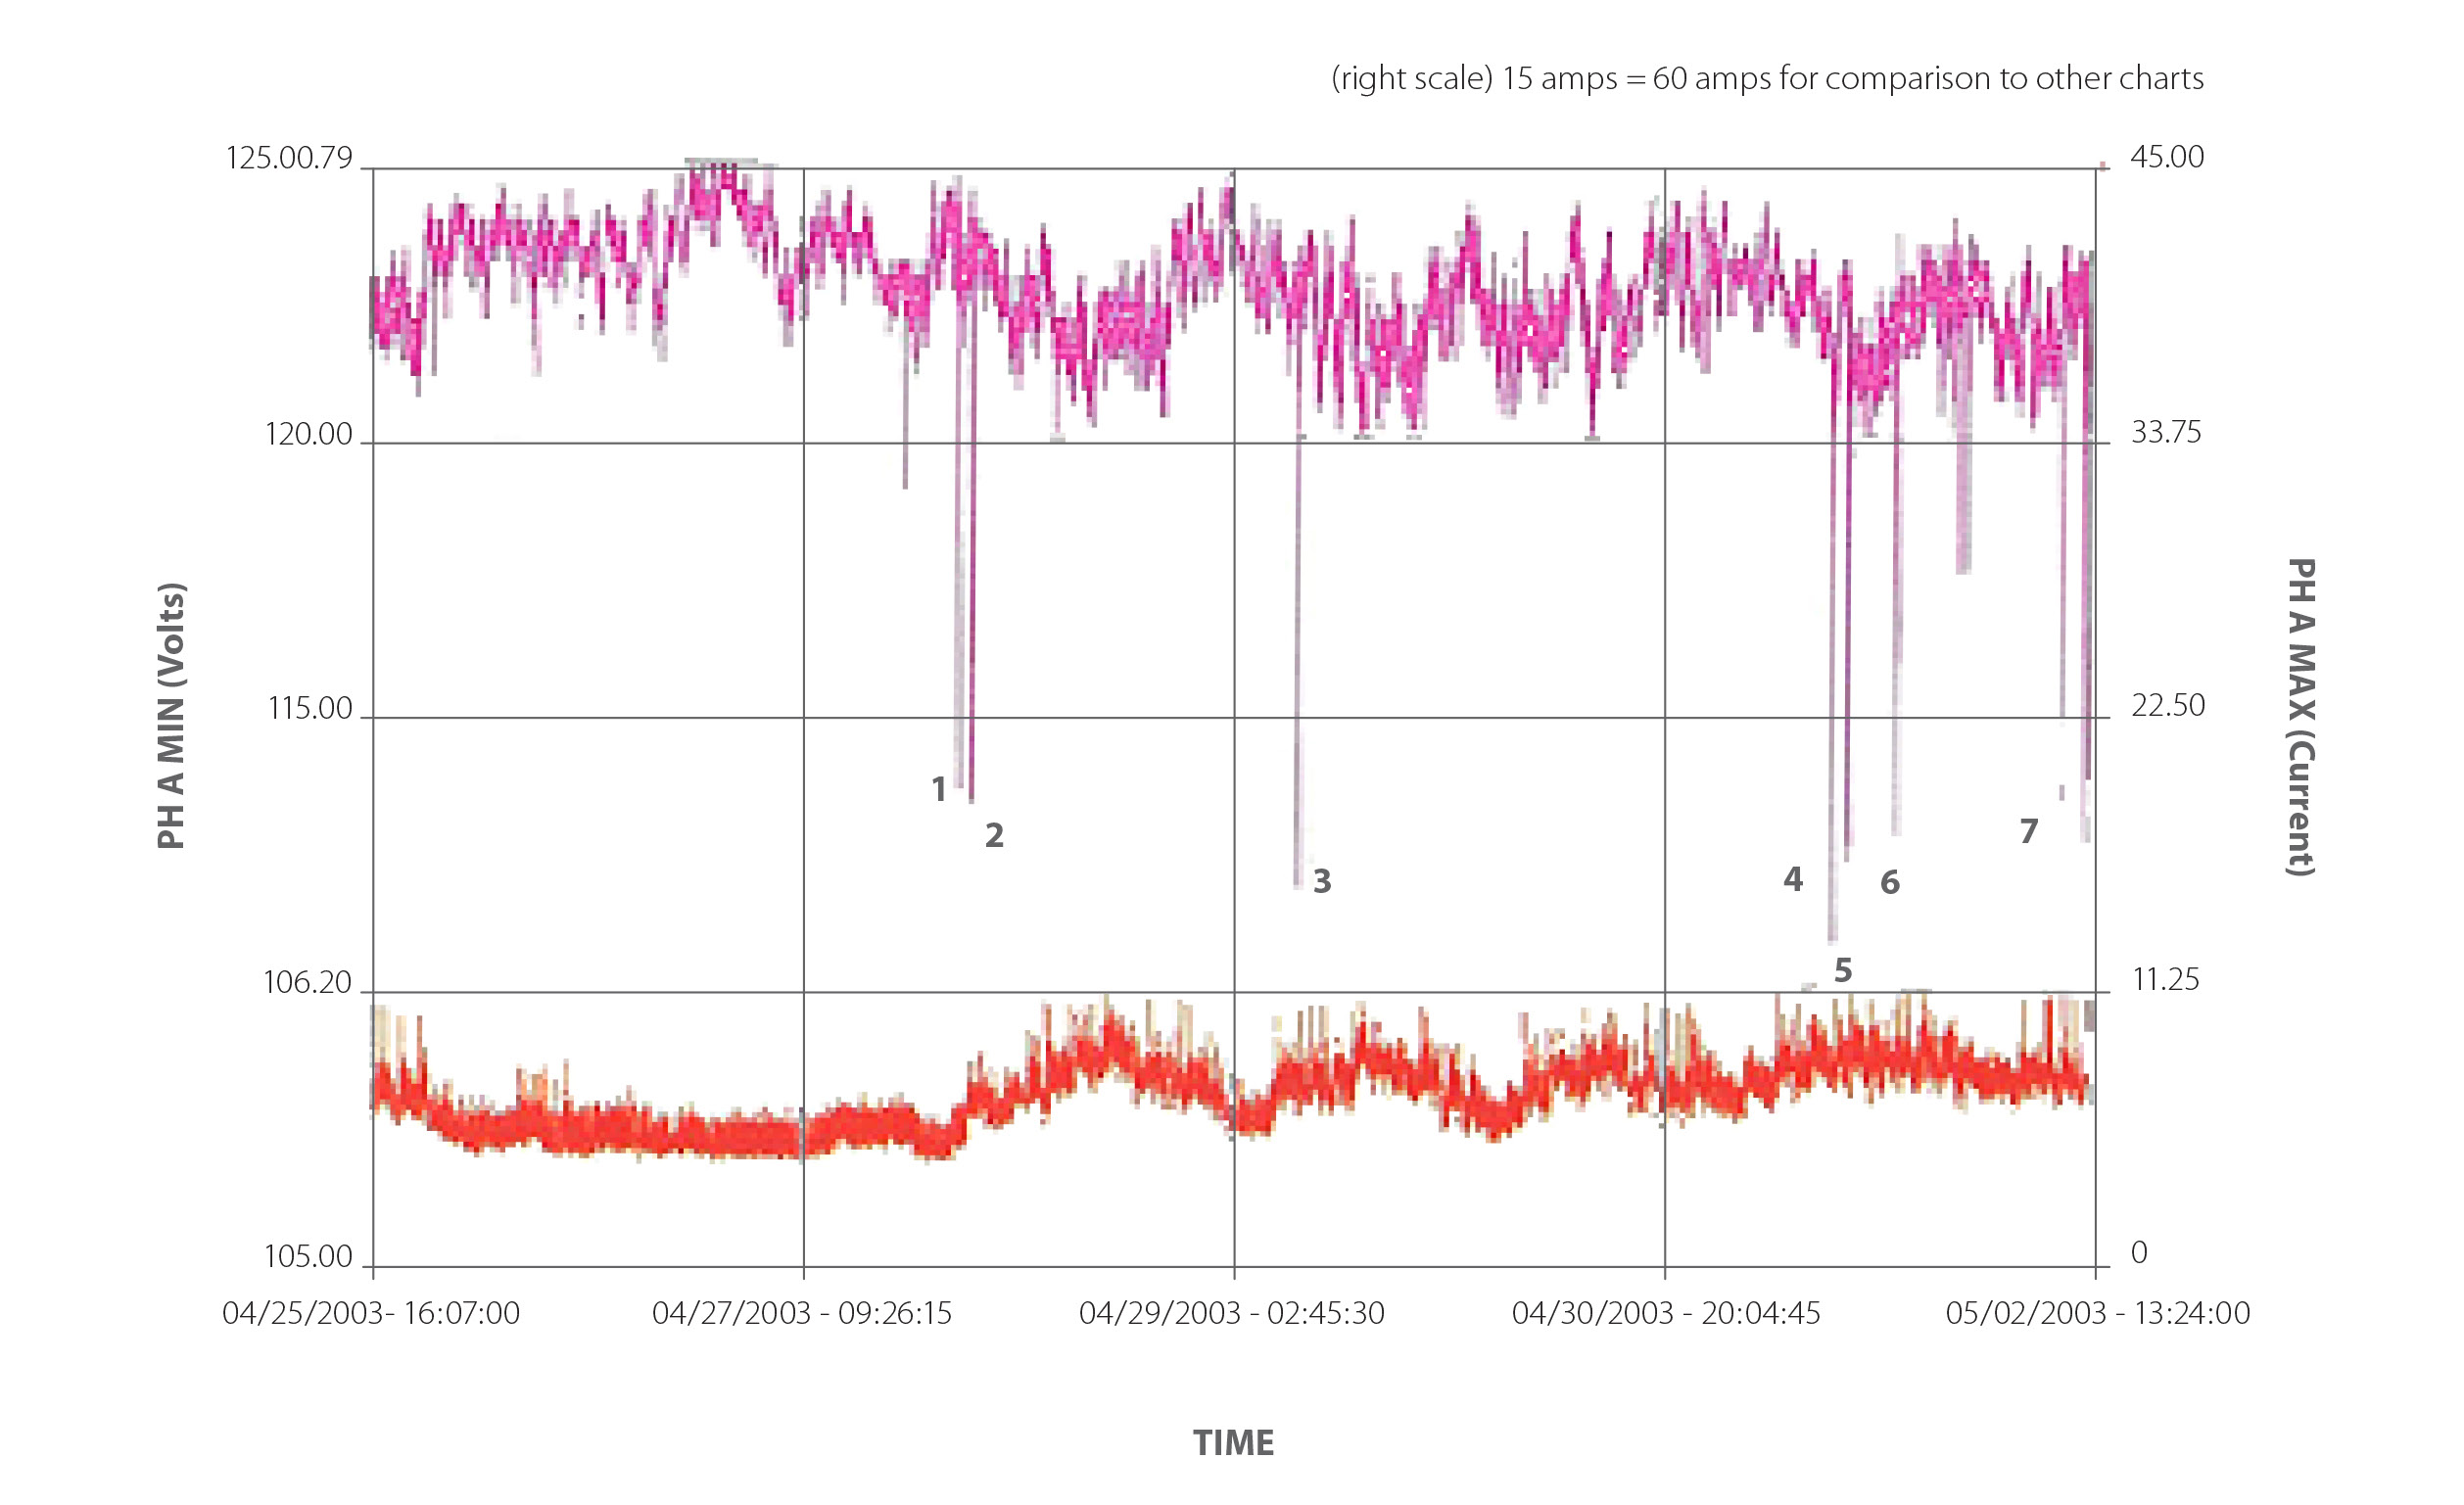
Due to the results above, the utility elected to conduct a second study. Monitors were installed again at Plants 1 & 2, but also two additional monitors were installed, one at the 115KV substation and one at Plant 3 owned by the parent company. Recording period was from 11/3/04 – 1/17/05. Of the 53 sags recorded at Plant 1, 42 were caused by the arcing machine at Plant 2 and ranged in depth from less than 5% to greater than 10%.
Study B indicated that sags originated from each of the monitoring locations but that Plant 2 was the source of 42 of the 53 or 79%; 5 originated on the distribution circuit, not caused by Plant 2, and was the second most frequent source; 5 were common to all monitoring locations and only one originated at the 115KV substation located at Plant 3. The distribution feeder was patrolled. Some tree interference problems were found and corrected. No other problems were found.
Conclusion
Power disturbances at Plant 1 were originating outside. One of the most frequent sources was the arcing dust removing machine at Plant 2. The customer was not totally convinced that the resulting power disturbances originating at Plant 2 were affecting operations at Plant 1 and began expressing the desire to receive power from a more reliable circuit. Since the fewest power disturbances were recorded at Plant 3, the parent company expressed a preference to be fed from a new 12.47KV circuit from the 115KV substation at Plant 3.
The more serious sags originated from sources other than Plant 2. Some were attributed to utility switching events and weather related causes. The cause for many was undetermined.
The utility determined that a new circuit could be built to feed Plant 1 from the 115 KV substation at Plant 3 but a contribution would be required. Negotiations were conducted and eventually the customer approved the funding for building the new circuit. Further the customer elected to move the operations at Plant 2 to a new location thereby removing the predominant source of sags from the distribution circuit. Both sources of power disturbances were addressed by the customer.
The studies conducted by the utility were helpful in that they provided data for discovering the most predominant source of the sags and for determining the most reliable alternative circuit to feed Plant 1.
Both Plants 1 and 2 were involved in highly proprietary manufacturing processes. Consequently, utility personnel were not granted access into the operation areas.
It is not clear whether Plant 2 was moved because of power disturbance problems at Plant 1 or for other reasons.
The best solutions were achieved jointly by the utility and customer working together. The solution of moving the operations of Plant 2 to a new location and building a new circuit was more expensive than the utility would have typically suggested. These solutions have been implemented. The utility has not heard from this customer since these changes were made.
Recommendations
Sag ride-through protection was recommended for the most sensitive machines at Plant 1. Uninterruptible power supplies were one alternative recommended. Some were installed. High-speed voltage regulators were also recommended for Plant 2 but were never installed.