
Abstract
Harmonic Distortion has long been recognized as a primary concern in power quality, traditionally monitored only through the 51st harmonic. This boundary was sufficient for decades, when most nonlinear loads were dominated by line-frequency distortions from older VFDs, fluorescent lighting, and low-frequency switching equipment. Today, however, there is a new type of frequency-based waveform distortion. Fast switching from inverters and VFDs causes waveform distortion beyond the 51st harmonic. This distortion is not quantified or limited by IEEE 519 or other standards. In this paper we show how to identify “supraharmonics”, components that extend past 3 kHz.
High-order harmonics (above the 51st) introduce new challenges: although they don’t increase transformer heating or generate large current in the way low-order harmonics traditionally interfere with equipment, they still produce problems. Protective devices such as GFCI breakers are often more sensitive in the kHz range than at 60 Hz. Other electronic loads such as LED bulbs may be fooled into dimming when subjected to high frequency noise. Many low-cost electric loads rectify the incoming 60 Hz voltage to a DC bus with little high frequency filtering, assuming there is no signal in that band. Their specific misoperation modes are highly dependent on the circuit design, making compatibility difficult to predict.
System resonances can amplify high frequency noise as well, especially on transformer secondaries inside customer facilities, where higher frequency resonances are more common. This paper explains the concepts behind high-order harmonics, why their importance today is critical, and the limitations of older PQ monitoring practices. It also outlines how modern analysis tools such as PQ Canvass allow PQ engineers to visualize, quantify, and diagnose high-frequency distortion with resolution and clarity not previously available.
What Are Harmonics Past the 51st?
The standard electrical frequency in the United States is 60 Hz. A standard harmonic order is defined as:
ƒn = n × 60 Hz
Where the harmonic frequency (ƒn) is the n-th order harmonic.
So, the 51st harmonic is:
ƒ51 = 51 × 60 Hz = 3,060 Hz
Anything above ~3 kHz falls outside the conventional monitoring band.
Higher order harmonics often arise from switching power supplies in computers, servers, LED drivers, and chargers that use PWM to convert AC to DC, VFDs used in motors, rectifiers, and magnetic saturation. Traditional PQ meters include low-pass anti-alias filters that eliminate >3 kHz content. Here we are using the term “harmonic” loosely; these high frequency components are often not synchronous with 60 Hz and thus not strictly “harmonics.” “Higher order harmonics” is used to indicate that we are using a harmonic analysis tool essentially as a spectrum display with 60 Hz-spaced bins, not necessarily implying that the distortion is truly harmonic. As the frequency band goes up, the 60 Hz spacing becomes less “harmonic”-related, and more akin to a simple bin spacing in a spectral display. These components are also sometimes called “supraharmonics,” indicating they exist past the traditional synchronous distortion harmonic range (nominally the 50th, or 3 kHz). Long feeder cables, power-electronic loads and capacitor banks can form resonance points in the 2-10 kHz range, which means high-order harmonics may be magnified, reflected or amplified by system impedance. This can lead to PQ problems that would go undiagnosed using low-order harmonic measurements alone.
Limitations of Historical PQ Practices
For decades, power quality monitoring has been shaped by assumptions that were reasonable for the electrical systems of their time but have become increasingly inadequate for systems of today. Traditional PQ analyzers, harmonic standards, and engineering practices were built around the expectation that meaningful harmonic activity would be confined to the lower orders—typically up to the 50th or 51st harmonic. Early measurement instruments lacked sampling rates and processing capabilities needed to examine content higher than 3 kHz.
Those assumptions, however, are no longer valid. Modern power systems have become saturated with devices that rely on fast-switching electronics. The switching processes that make devices such as LED drivers, switch-mode power supplies, solar inverters, and EV chargers efficient and compact generate substantial harmonic and inter-harmonic content at frequencies far beyond the traditional 3 kHz limit. In many situations, the highest-energy distortion no longer resides in the classical 5th or 7th harmonic but in a dense cluster of high-order components that older equipment is blind to.
High-Order Harmonic Analysis in PQ Canvass
A PQ recording may offer significant information to the user about these higher order harmonics. In the events section of the recording tab, the user can click on the number next to “Waveform Capture” to view a list of waveforms. Clicking on one of these options will reveal plots of voltage and current from each channel. Users can switch to the “Harmonics Graph” tab by clicking the bar graph icon in the top left. This shows Voltage, Current, and Power Harmonic Magnitudes by harmonic. In the bottom left, the user can click “51+” to view harmonics past the 50th harmonic. Users will notice that the magnitude of the 1st harmonic is far greater than all subsequent magnitudes.
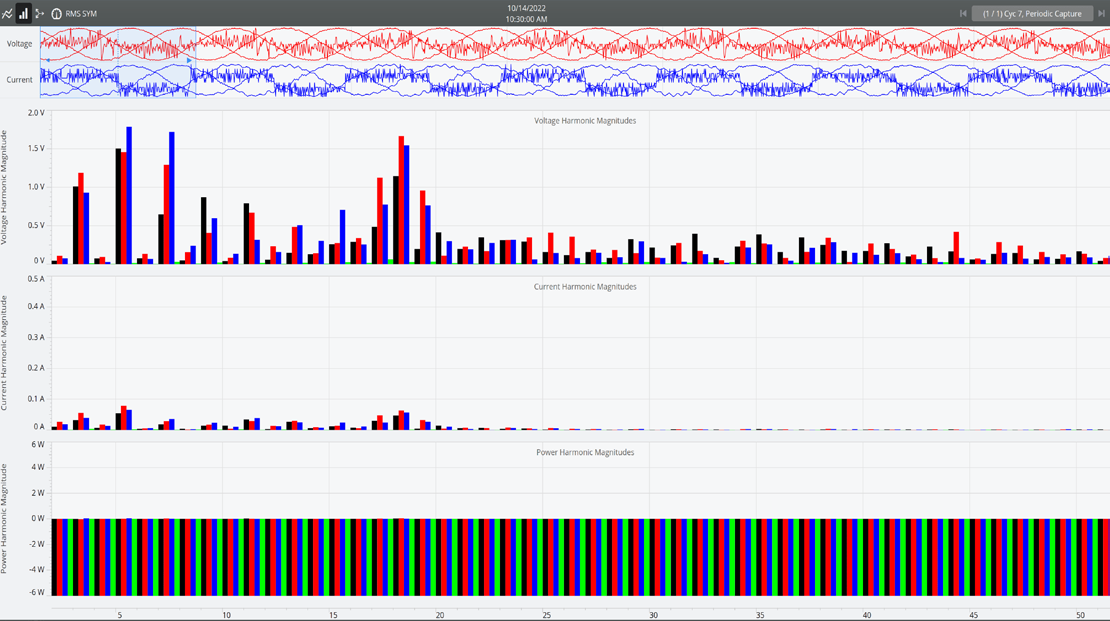
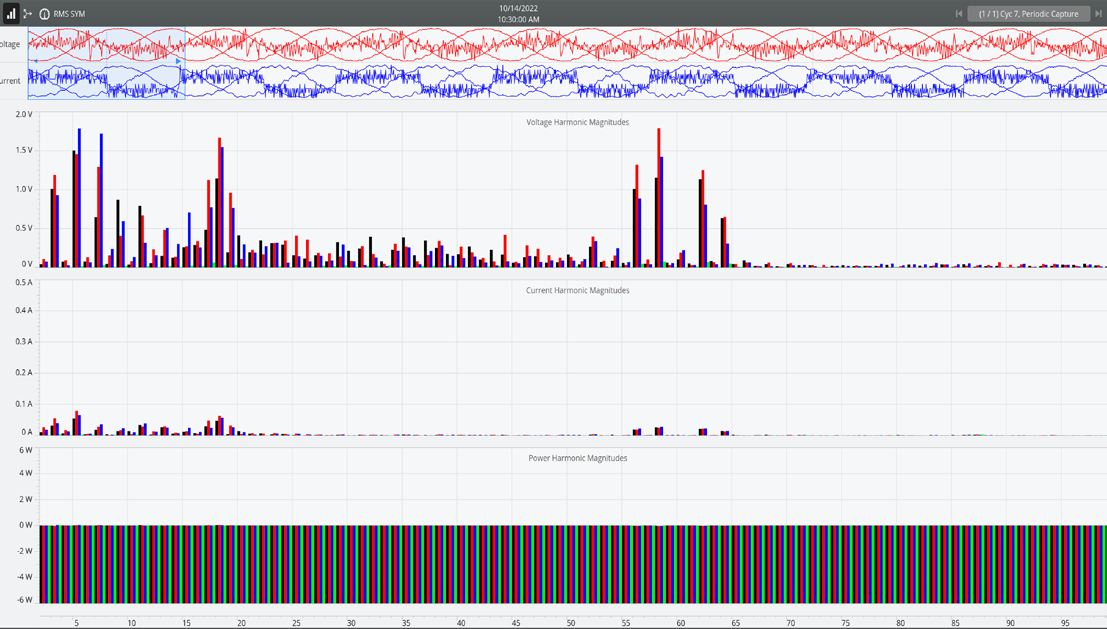
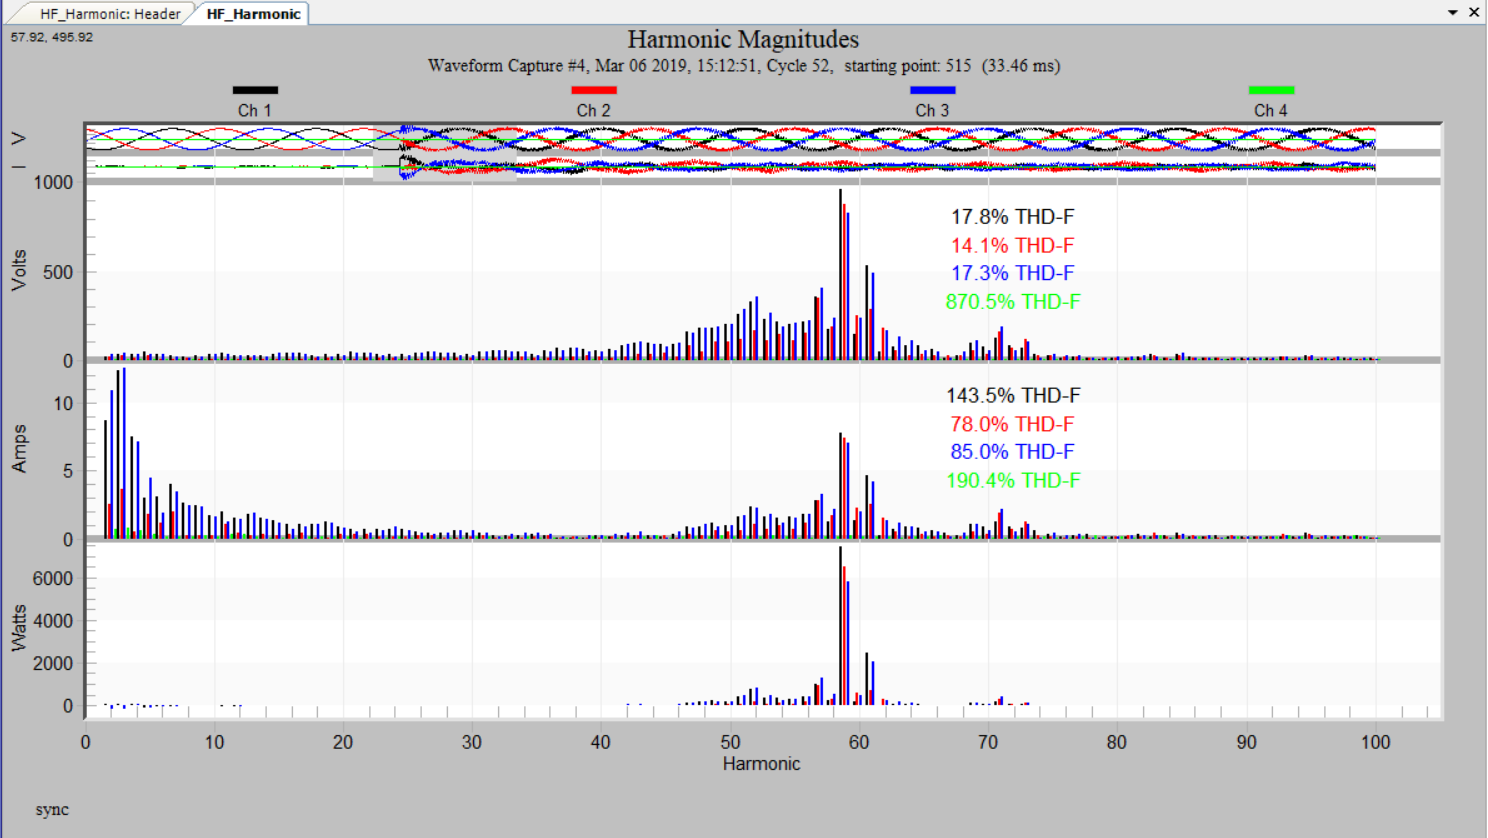
Pressing the ‘F’ key will remove the 1st harmonic (fundamental), which allows the graph’s auto-scaling rules to more clearly show the full spectrum of harmonic content. Figure 2 shows spikes in voltage harmonic magnitude that would be previously unseen by legacy PQ tools. This is an example of how PQ Canvass can show users more detailed high-order harmonic information, which can be useful in solving power quality problems.
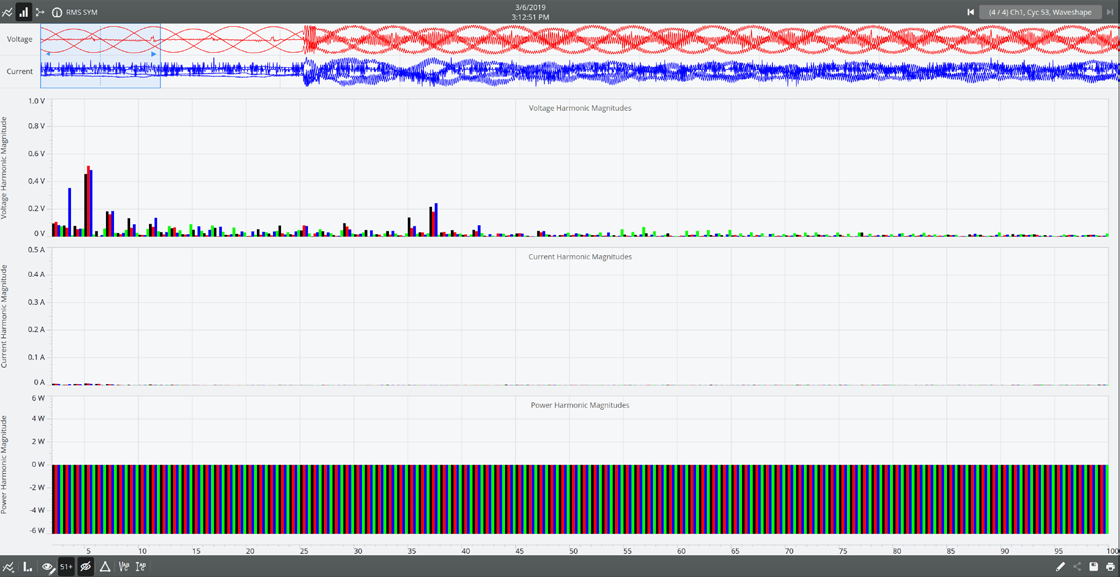
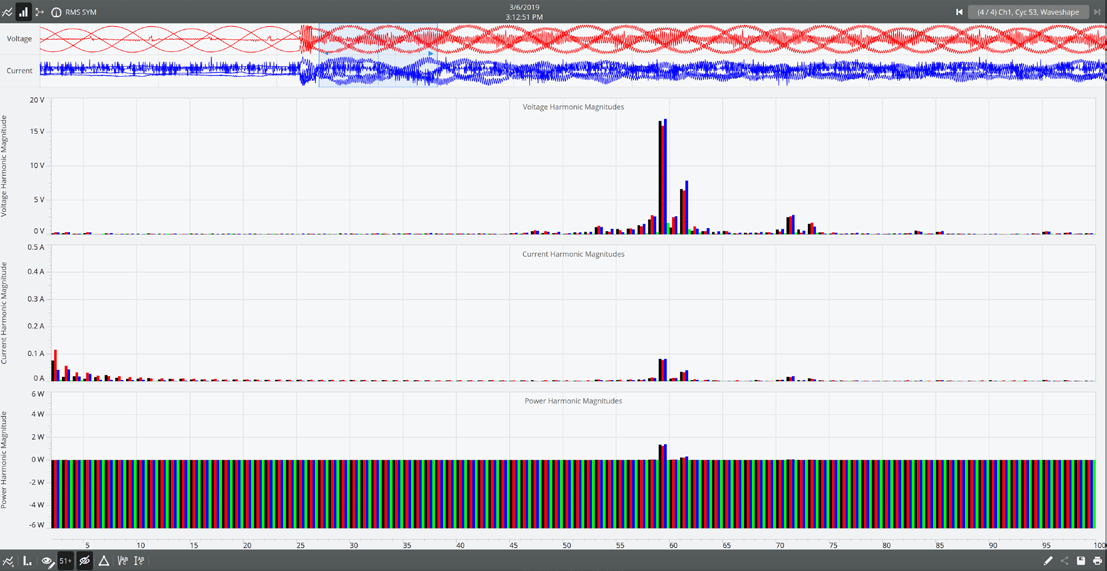
Figures 3 and 4 show a recording in which initially, very little voltage and current high frequency noise is present. Later in the recording, lots of voltage and current high frequency noise is present due to a high frequency harmonic component with a relatively high magnitude.
High-Order Harmonic Analysis in ProVision
ProVision users can view Harmonic Magnitude charts by clicking the Waveform Capture link and selecting a waveform. To view the Harmonics Graphs, click the ‘H’ graph icon shown in Figure 6. Hide fundamentals by right-clicking and deselecting “Show fundamental” or simply pressing ‘F’. Users can view past the 51st harmonic by clicking Options, Preferences, Harmonics, and checking the box, “Show Past 51st Harmonic”.

Conclusion
As the electrical landscape continues to evolve, the challenges surrounding harmonic distribution grow more complex and consequential. Power quality was once concerned with only a narrow band of low-order harmonics but has now expanded into a broad spectrum of high-frequency distortion that traditional PQ tools were never designed to capture. Modern facilities—dense with switching power supplies, inverter-based resources, advanced motor drives and EV infrastructure—routinely generate harmonics well beyond the 51st order. These components are quite significant; they increase thermal stress, excite resonance, reshape system impedance, and create operational conditions that are invisible to engineers who rely solely on legacy PQ instrumentation.
The industry can no longer afford to treat harmonics above 3 kHz as irrelevant or inconsequential. High frequency distortion is now a predictable byproduct of the devices that make modern electrical systems efficient, compact, and interconnected. Addressing these challenges requires tools capable of providing full-spectrum insight. PQ Canvass and ProVision provide the ability for engineers to analyze high-order harmonics past the 51st harmonic and view graphs displaying harmonic magnitude.
By extending analysis beyond the traditional harmonic boundary, power quality professionals can more accurately diagnose system behavior, prevent equipment damage, and design mitigation strategies that reflect the realities of today’s grid. Deeper visibility leads directly to better engineering decisions, more reliable infrastructure, and a safer, more stable electrical environment. High-order harmonics are no longer fringe phenomena; they are central to understanding the performance and resilience of modern power systems.