
Abstract
This white paper provides an overview of the Event Capture function available with PMI power quality analyzers and introduces the Event Change Report, generated by Merlin™, PMI’s AI-powered analysis assistant. Event capture is a trigger-based recording function that captures power disturbances on a cycle-by-cycle basis, offering significant memory efficiency over continuous waveform recording. This paper covers what event capture is used for, how to configure it through PQ Canvass, and how Merlin™, PMI’s AI-powered analysis tool, transforms captured event data into actionable insights. Topics include threshold configuration, the Event Change Table Report, and the Event Change Report’s ten analysis sections covering severity assessment, compliance, pattern identification, attribution, and recommended next steps.
Introduction
When undertaking an investigation with a PMI recorder, most of the data captured is unremarkable since the power quality is usually normal with no need for analysis. Event capture is a way for the device only to capture a snapshot of data around the time of any irregularities in power quality. This way, only the relevant data is stored and shown, making analysis significantly easier.
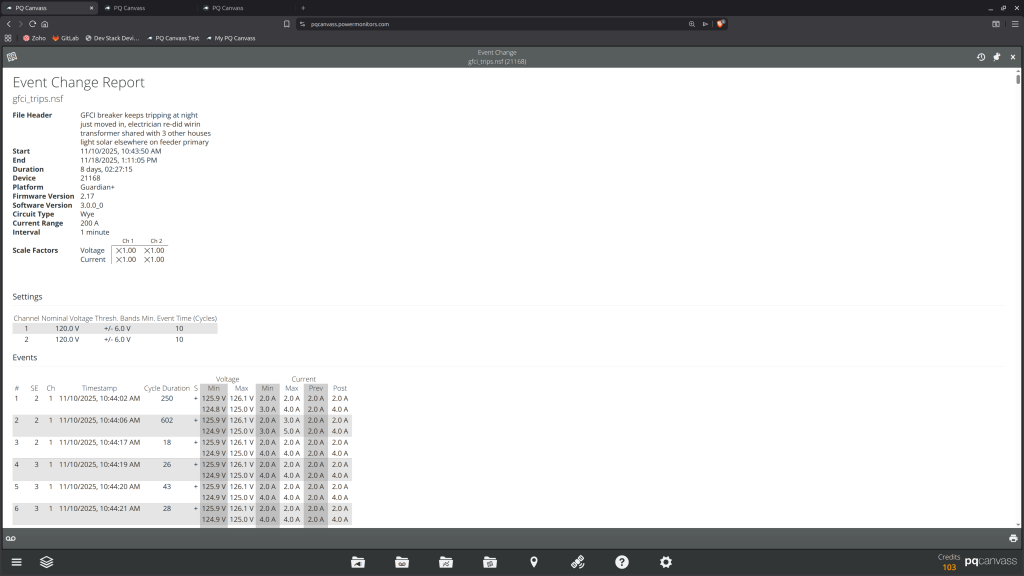
Event capture is a trigger based recording function in PMI power quality analyzers that records power disturbances on a cycle-by-cycle basis. When voltage crosses a user-defined threshold, the recorder captures all of the relevant data, as well as the data for the cycle before and after the event for comparison. All of the data collected is compiled in the Event Change Table Report, which is shown in Figure 1.
The technology for event capture was developed before the waveform capture function. It was initially used as a solution for PMI’s older recorders that couldn’t record raw waveforms. Even though PMI’s newer recorders now support full waveform capture, event capture still proves to be very valuable and is still supported in PMI’s latest software and hardware.
Event capture has several advantages over waveform capture. First, and most significant, is memory efficiency. Since event capture is only storing noteworthy events and not the entire device operation, the recorder can store significantly more events than if it were to record continuously. This also means that it can monitor power quality for much longer without filling up its memory. However, waveform capture provides higher resolution data—256 samples per cycle for typically 2 pre-trigger and 6 post-trigger cycles (9 cycles total), yielding 65μs resolution compared to event capture’s 16ms resolution with at most 3 RMS data points per triggered event. While waveform capture offers more detail for analyzing individual events, event capture’s memory efficiency makes it ideal for long-term monitoring where capturing a large number of events is more important than maximum resolution.
Setting Up Event Capture
Each device’s event capture settings can be configured wirelessly through PQ Canvass. From the home page, one can click on the devices folder, which is the first folder on the bottom of the page, and select the device to configure. From there, one can click Recordings, then New Recordings. This page will present the user with several pre-made templates to choose from, or if there are any previously saved recordings, they will also be shown. If the user wants to create a new recording template, the Customize Settings option will present the customizable recording options, including a tab for Event Capture.
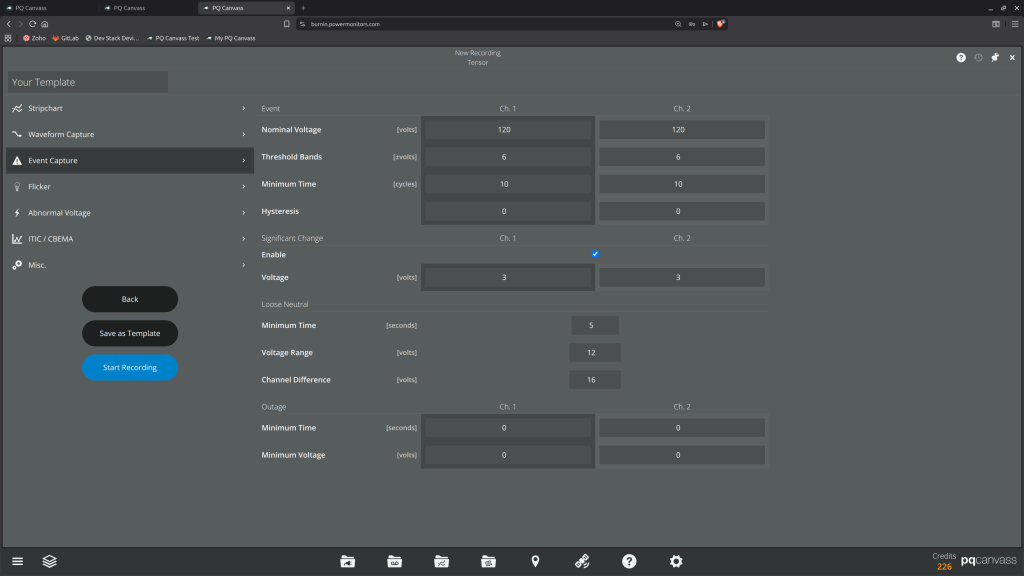
The first option to configure is the Nominal Voltage. This should be set to the actual measured line voltage. This is the “center point” around which the threshold to trigger an event capture is measured. Setting the threshold bands will set how far from the nominal voltage the measured voltage has to go in order to trigger an event. Setting this too low can end up triggering on insignificant voltage changes, whereas setting it too high could end up missing some events that one would actually want captured. A good starting point is 5% of the nominal voltage, so +/- 6V for a 120V line, for example. The minimum time controls how long the voltage has to stay beyond the threshold bands in order to trigger an event capture. This prevents brief fluctuations to be filtered out of the recording. Hysteresis works in a similar sense, making sure that the same event doesn’t trigger multiple captures by taking into account previous cycles. These are the main settings related to event captures. The complete list of settings, as well as their default values is shown in Figure 2. While there are a number of other settings, they are focused more on handling specific kinds of events.
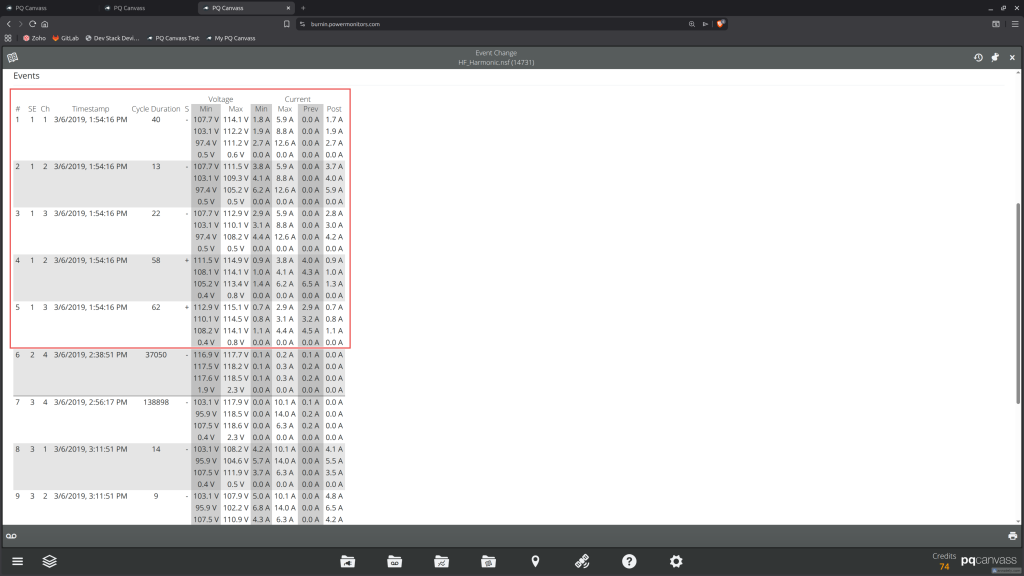
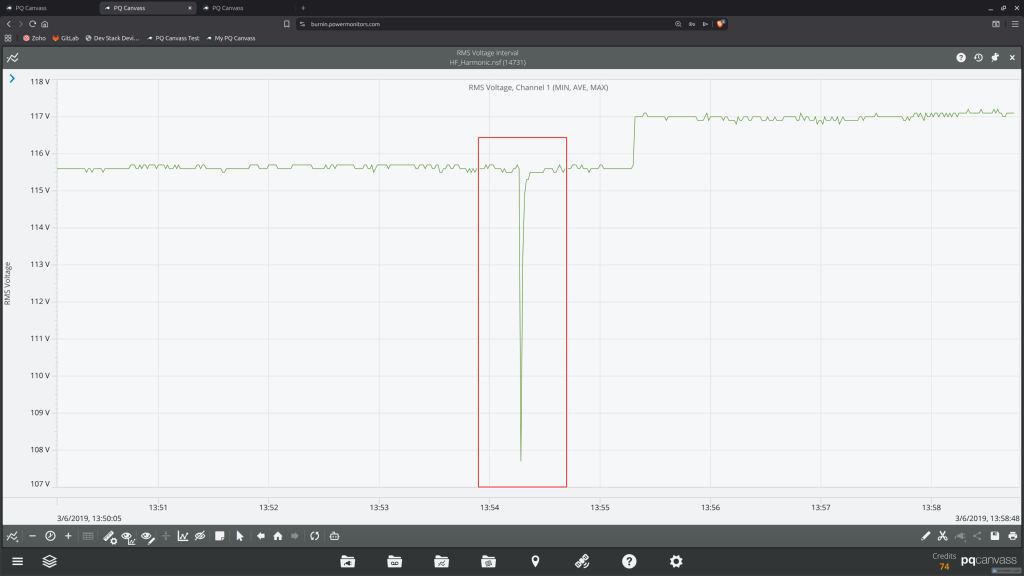
Once the new recording is set up, if an Event Capture is triggered, it can either be found under Recording List for that specific device, or in the Recordings folder at the bottom of the page. Clicking on a recording will present the users with all of the details for that recording, as well as links to generated reports and graphs. An example of a captured event can be seen in Figures 3 and 4.
Accessing Merlin™
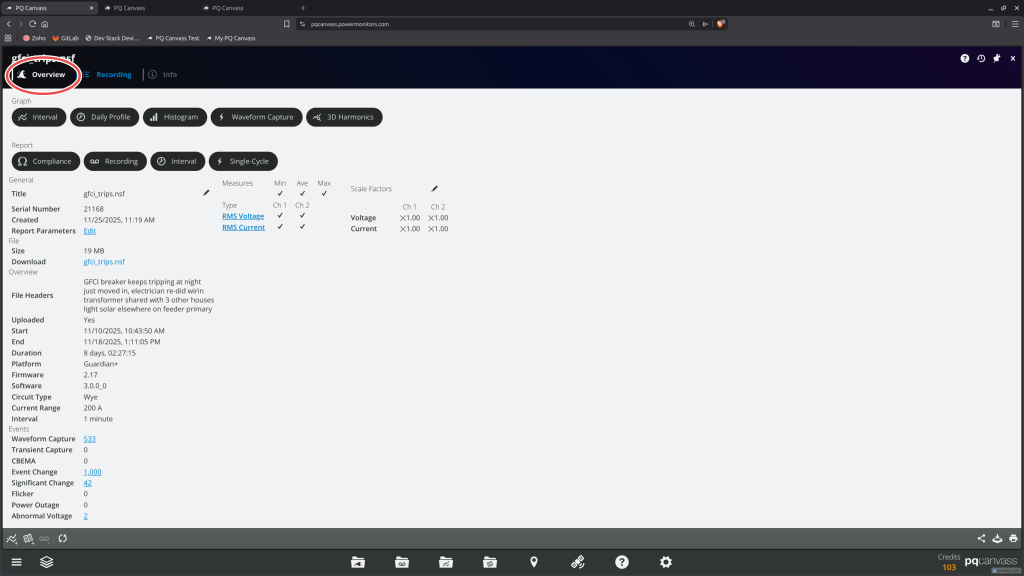
Those same recordings can also now be analyzed with our new AI tool Merlin™. From that same page of the recording information, there is now a new button under the name of the recording that says “Overview” (Figure 5). This is where the majority of our new AI powered assistant, Merlin™’s features can be found. If Merlin™ has not run an analysis of the selected recording yet, a prompt to start one will appear with the option to add any background information or additional details.
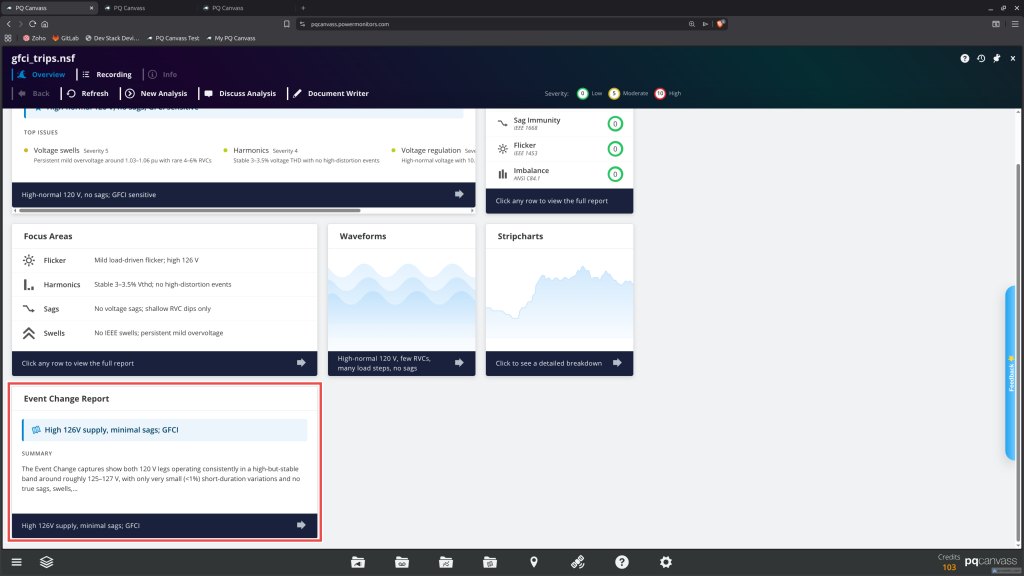
The Event Change Report card gives an excellent summary and next steps for the recording, focusing on key events, giving likely causes, and providing next steps for further testing, located near the bottom in Figure 6. This card is split up into ten sections.
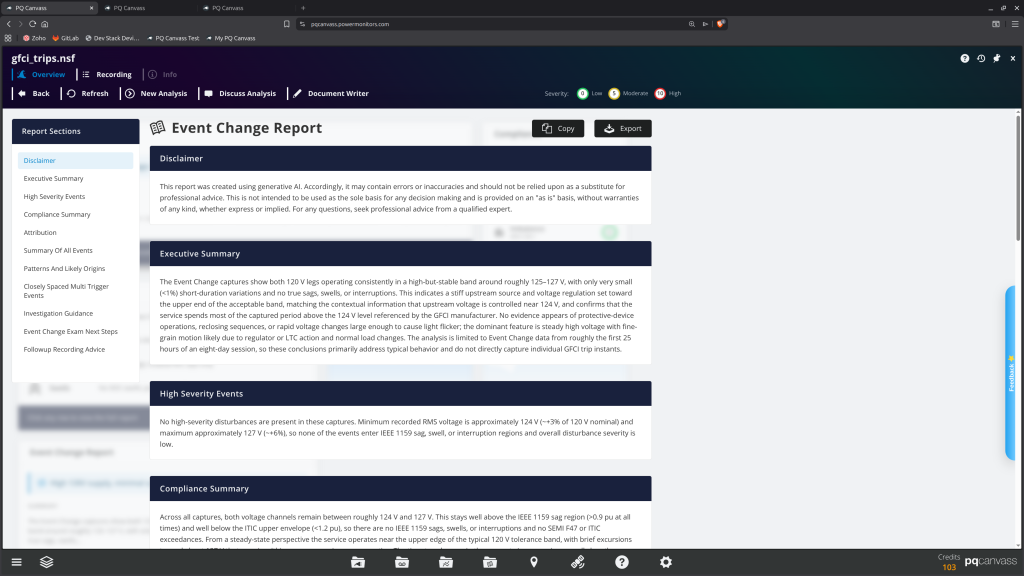
The Executive Summary presents the key power quality issues, overall severity, and the high-level conclusions from the event captures.
High Severity events highlights the most critical issues driving the overall risk and primary concerns.
The Compliance Summary assesses how the recorded events measure against several relevant power quality standards.
The Attribution section identifies potential sources or causes of the detected disturbances, narrowing the focus on either the customer or the utility.
A Summary of All Events provides a complete catalog of captured events.
Patterns and Likely Origins identifies recurring trends that point to plausible root causes.
The Closely Spaced Multi-Trigger Events section examines clusters of events that occur in rapid succession, which can indicate related or cascading issues.
Investigation Guidance recommends analysis and measurement strategies to isolate causes.
Event Change Exam Next Steps outlines further data collection and analysis plans to further examine the event changes.
Follow-up Recording Advice makes recommendations on additional measurements, sensors, and longer recording windows to help improve attribution and confidence.
An example of the sections are shown in Figure 7.
Conclusion
Event capture provides a memory-efficient method for long-term power quality monitoring, capturing disturbances on a cycle-by-cycle basis without the storage demands of continuous waveform recording. Configuration through PQ Canvass allows users to set thresholds tailored to their monitoring needs. Merlin™’s Event Change Report then automates the analysis of captured events, delivering severity assessments, pattern identification, and actionable next steps.