
Abstract
This white paper describes how to create custom initialization templates for application specific monitoring with PMI Recorders. PMI recorders have the ability to measure all types of power quality data. When using Revolution and Vision power analyzers it is possible to record voltage, current, power, harmonics, flicker, and even transient data on all 4 channels. When using the advanced features of these products the setup can be very time consuming. With a few simple steps it is possible to create custom templates for common use/application specific recorder settings. These settings can even be company standardized to share between colleagues.
- Overwrite OFF
- Record Time 10 days until full
For more background on Harmonic Recording theory, please refer to the White Paper: Recorder Settings for Harmonic Investigations found on the PMI website.
Choosing the Recorder Type
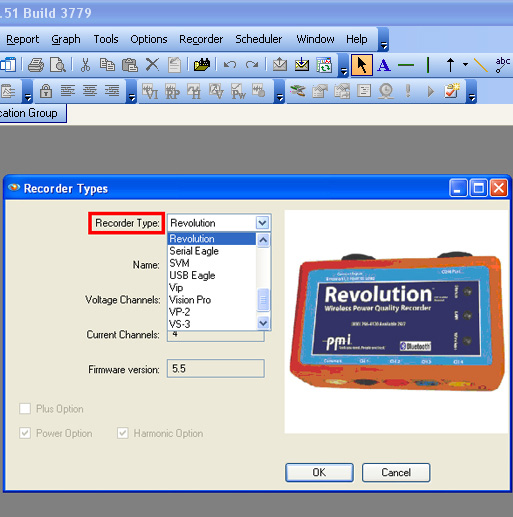
In order to create a custom template setting, it is necessary to first choose the type of recorder being used. Selecting the specific recorder will enable all the settings in the template that are available with that recorder as shown in Figure 4.
ProVision and the recorders are intelligent devices and will only use the selections that apply to that device being initialized. If a device is connected and a menu selection does not apply to that device, the selections will be “grayed out”.
NOTE: It is very important to ONLY use the settings file for the recorder type that the settings were customized for. Not all selections apply to all recorders.
Recorder Settings Folder
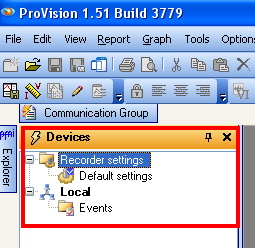
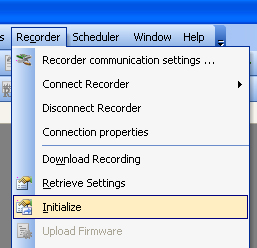
The recorder settings folder is used to store the default/custom settings used to initialize the recorder as shown in Figure 1. The Default settings file is a generic file that is created when ProVision is installed. It is default file used when Recorder > Initialize is clicked as shown in Figure 2 (Steps to initialize with the custom settings will be discussed later in the paper).
Create Template Settings
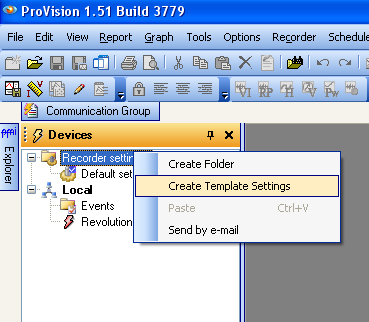
In order to create an application specific template it is necessary to first create a new template for the custom settings. Right Click on Recorder Settings and choose Create Template Settings as shown in Figure 3. For the purpose of this discussion a custom setting template for harmonic analysis will be created with the following parameters:
- Revolution Recorder
- Wye Circuit
- 3 Channels of Voltage and Current (4th Disabled)
- 1 Sec Interval
- Interval data: Voltage, Current, VTHD, ITHD, Frequency, and odd Harmonics 3, 5, 7, 9, 11, 13
- 1 Hour Periodic Waveform capture (Pre and Post 1 Cycle)
- Waveform Capture Disabled
Edit Settings
The Edit Settings windows make it possible to modify initialization settings to suit a specific application. Editing these initialization settings is a multi-step process. In this example, settings for harmonic analysis will be enabled as previously mentioned. The process is shown in the Figures that follow.
Step 1: Basic Screen
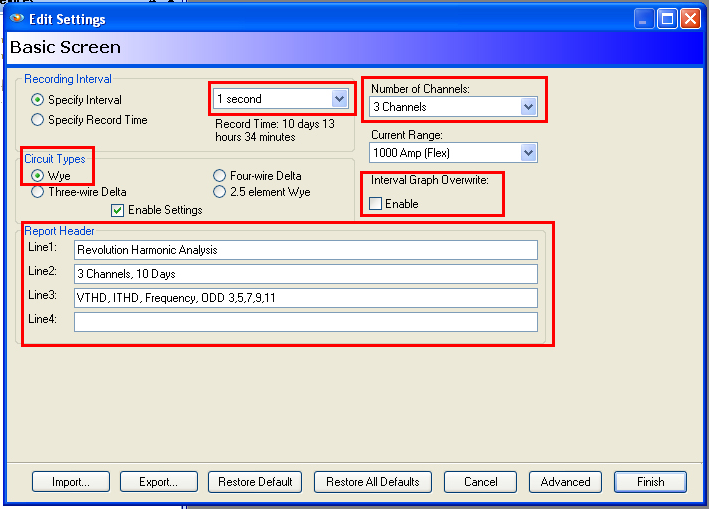
In the Basic Screen, Figure 5, the following settings will be changed: Circuit Type (Wye), Interval (1 Sec), Number of Channels (3), Interval Graph Overwrite (Disabled), and Report Header to describe the specific recording application.
Step 2: Interval Graphs (1/7)
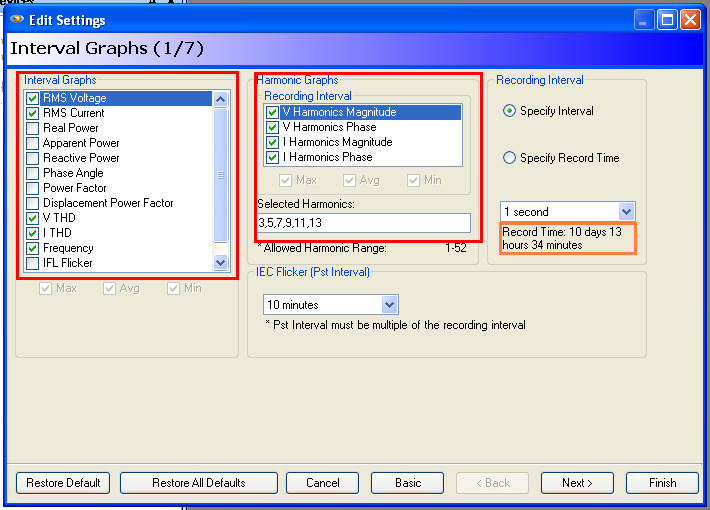
The Interval Graphs Screen, shown in Figure 6, allows for the acquisition of specific types of graphs. As shown in Figure 6, the following settings will be enabled: RMS Voltage, RMS Current, VTHD, ITHD, Frequency, ODD Harmonic Graphs V&I 3, 5, 7, 9, 11, 13.
NOTE: Highlighted in orange is the record time of 10 days with the selected settings.
Step 3: Waveform Capture (2/7)
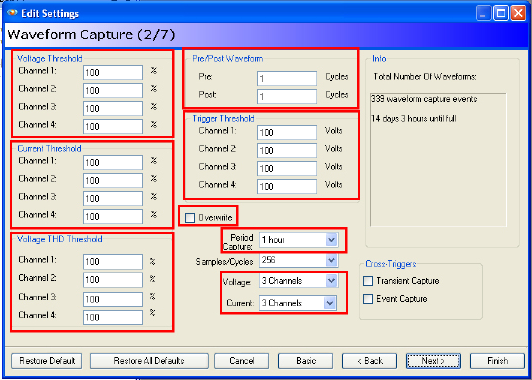
In the Waveform Capture Screen, Figure 7, the following settings will be changed: Waveform capture (Disabled by setting thresholds to 100%), Pre and Post Waveform (1 Cycle), Waveform overwrite (Disabled), Period Capture (1 Hour), V&I Channels (3).
Step 4: Event Capture (3/7)
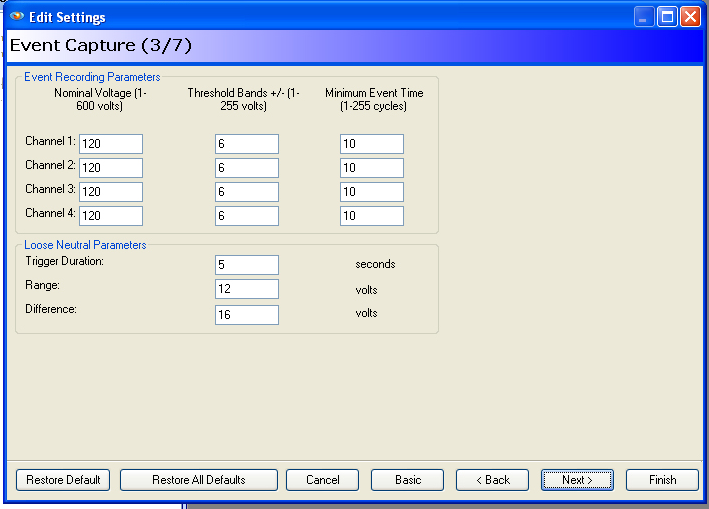
In the Event Capture Screen, as shown in Figure 8, it is possible to change event recording parameters such as nominal voltage, threshold bands, and minimum event time and to change loose neutral parameters such as trigger duration, range and difference. For the purpose of this example, there were no needed changes to this screen.
Step 5: Flicker (4/7)
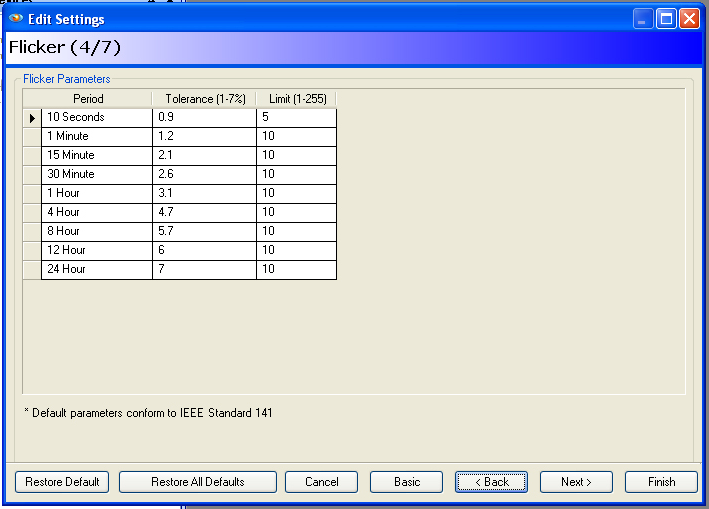
In the Flicker screen (Figure 9), Flicker Parameters are shown. This table contains three columns. For each time span row in the first column Period, it is possible to set the percentage of variation (Tolerance) and the minimum number of cycles (Limit). For the purpose of the harmonics analysis example given in this paper, there are no needed changes to this screen.
Step 6: Abnormal Voltage (5/7)
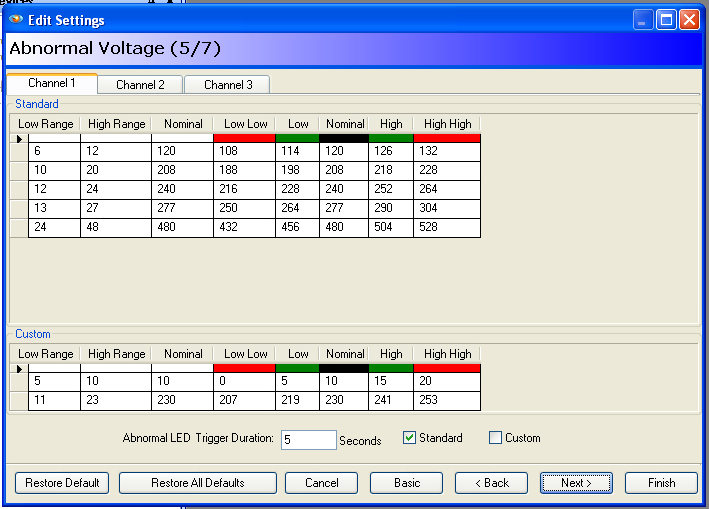
The Abnormal Voltage screen displays a chart of low and high abnormal voltage ranges. There are four pages of charts—one for each recording channel in use. To switch from channel to channel, click on the numbered tab at the top of the charts. For the purposes of the example covered in this paper, there were no needed changes to the Abnormal Voltage Screen.
Step 7: Transient Capture (6/7)
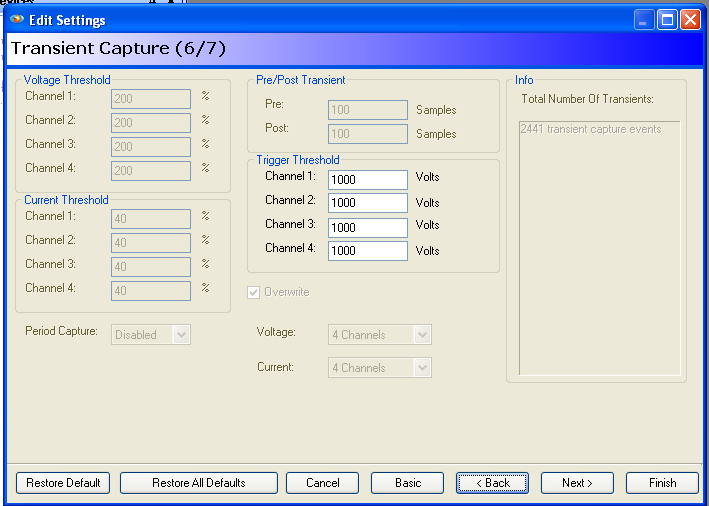
In the transient capture screen (6/7) there were no changes needed for the scope of this discussion.
Step 8: Misc. (7/7)
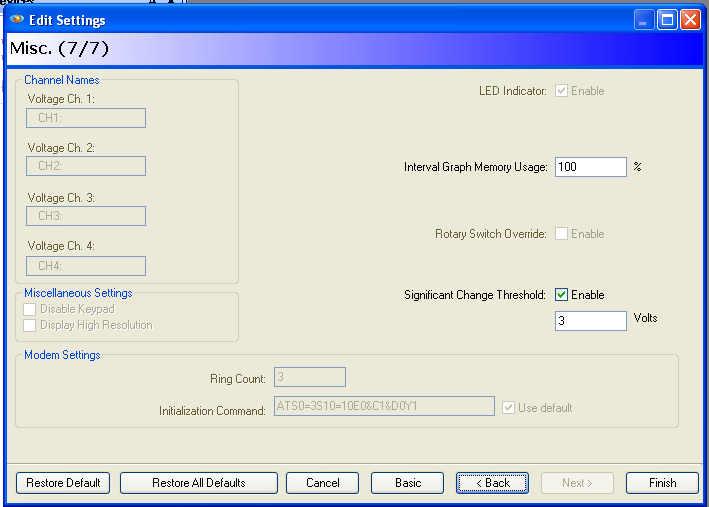
In the Misc. screen (7/7) there were no changes needed for the scope of this discussion.
Step 9: Save Settings
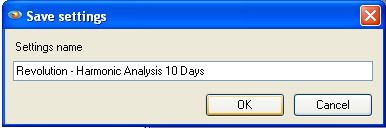
After clicking finish on the Misc. screen (7/7) a prompt will appear to save the settings under the settings name. It is very important to include the recorder type and a brief description of the settings so that they can be used correctly.
NOTE: It is very important to ONLY use the settings file for the Recorder type that the settings were customized for.
Using a Custom Setting
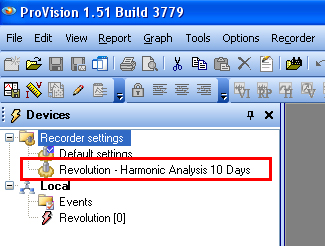
After generating the custom settings, the template will be saved under the Recorder Settings folder as discussed previously and shown in Figure 13. To use the custom settings, simply click the desired settings and drag the file onto the connected recorder as shown in Figure 14. A prompt will appear in ProVision to initialize the recorder with the new settings; click Yes.
Editing Custom Settings
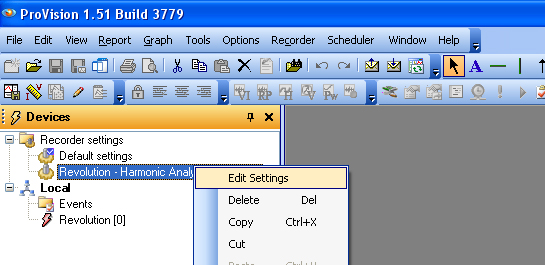
The custom settings template can be edited at any time to fine tune power quality analysis. To edit a custom setting, right click on the settings file and click Edit Settings as shown in Figure 15.
Typical Initialization Settings
Below are a few examples of typical power quality application settings that have been discovered through customer interaction. These settings might be beneficial to add to a collection of settings files. Remember each settings file can be edited to suit personal preference at any time.
Motor Start (All Models)
The motor start settings should records RMS voltage and current, with a 1 cycle interval setting for the higher memory models, and a 1 second interval setting for the others. These time intervals provide greater time resolution for precise measurement of motor start inrush currents and resulting voltage sags.
24 Hour Recording, 1 Week Recording, 1 Month Recording
These settings record nearly all of the available time interval graphs except individual harmonics, and IFL flicker. The waveform capture settings for this custom initialization type are shown in Table 1.
Advanced Harmonics
The Harmonics settings record RMS voltage, RMS current, real power, power factor, displacement power factor, VTHD, ITHD, individual odd harmonics to the 51st, and frequency. The waveform capture settings for this custom initialization type are shown in Table 1.
Flicker
The flicker settings record RMS voltage, RMS current, VTHD, ITHD, frequency, IFL flicker, and Pst flicker. The waveform capture settings for this custom initialization type are shown in Table 1.
NOTE: All Record time calculations are based on the 1GB Revolution and Vision Recorders. Record time and Interval options will vary by product type.
| Motor Start | 24 Hour Rec | 1 Week Rec | 1 Month Rec | Harmonics | Flicker | |
|---|---|---|---|---|---|---|
| Channels | 4 | 4 | 4 | 4 | 4 | 4 |
| Interval | 1 Cycle | 1 Sec | 10 Sec | 30 Sec | 30 Sec | 5 Sec |
| Record Time | 3d, 1h | 1d, 1h | 8d, 2h | 32d, 8h | 10d, 7h | 9d, 17h |
| Interval Graphs | ||||||
| RMS Voltage | X | X | X | X | X | X |
| RMS Current | X | X | X | X | X | X |
| Real Pwr | X | X | X | X | ||
| Apparent Pwr | X | X | X | |||
| Reactive Pwr | X | X | X | |||
| Phase Angle | X | X | X | |||
| Pwr Factor | X | X | X | X | ||
| Disp Pwr Factor | X | X | X | X | ||
| V THD | X | X | X | X | X | X |
| I THD | X | X | X | X | X | X |
| Harmonics | odd to the 15th | odd to the 15th | ||||
| Frequency | X | X | X | X | X | X |
| IFL Flicker | X | |||||
| Pst Flicker | X | |||||
| Waveform Capture Settings | ||||||
| Volt-% Threshold | 3 | 3 | 3 | 3 | 3 | 3 |
| Volts-Trig Threshold | disabled | disabled | disabled | disabled | disabled | disabled |
| Pre-Trigger Cycles | 5 | 2 | 2 | 2 | 2 | 2 |
| Post | 120 | 6 | 6 | 6 | 6 | 6 |
| Samples/Cycle | 128 | 256 | 256 | 256 | 256 | 256 |
| V Channels | 3 | 4 | 4 | 4 | 4 | 3 |
| I Channels | 3 | 4 | 4 | 4 | 4 | 3 |
| Periodic | 12 hr | 1h | 8h | 1d | 12h | 8h |
| Number WFC Events | 20 | 106 | 106 | 106 | 106 | 106 |
| Overwrite | on | on | on | on | on | on |
| Qty Periodic WFC in Record Time Period | 6 | 24 | 24 | 32 | 20 | 28 |
Conclusion
Creating application specific initialization templates is quite simple using the steps above. Power quality recording can be very complex especially with all the features/parameters in PMI’s products. Taking the time and effort to create custom settings templates will make future power quality analysis more consistent and convenient.