
Abstract
The Boomerang family of wireless voltage, current, and power monitors supports the DNP3 protocol for monitoring and control of a Boomerang when used as a DNP3 outstation. The original Boomerang 2S supported a small number of data points since it was a voltage-only monitor. The expansion of the Boomerang family requires an expanded DNP3 point map to cover multiple channels of voltage, current, and power, along with alarm settings, threshold values, and various other settings needed for full utilization of Boomerang features. This white paper will describe the updated version of the expanded DNP3 point map.
Expanded Point Map (Version 2.0)
In the white paper An Overview of DNP3 and the Boomerang Point Map (available HERE), the basics of DNP3 were covered, along with the specific DNP3 points available in the Boomerang 2S. This set of points encompassed data that was available for the one channel of voltage being monitored by the device, along with general data related to its operational state. The release of additional versions of Boomerang devices which monitor even more data required the DNP3 point map to be expanded. As explained in the white paper referenced above, DNP3 points are arranged as a series of object types and point numbers within each type. The object types are numeric values predefined by the DNP3 protocol that cannot be changed. These types specify general classes of data, such as binary inputs, binary counters, analog inputs, analog outputs, etc. The version 2.0 point map uses the same basic object types, but utilizes an entirely different range of points within the object types. The original point map definition will continue to be used by default in the voltage-only Boomerang 2S to maintain backward compatibility. This setting can be changed via configuration if desired, giving a consistent point map among all Boomerangs.
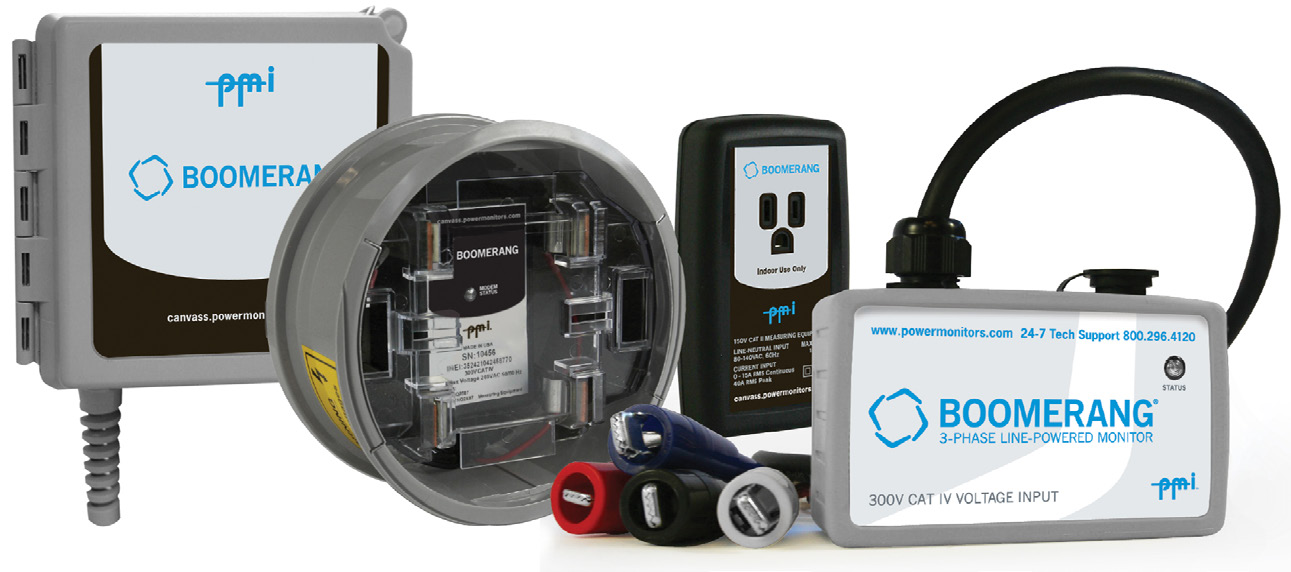
Boomerang devices (Figure 1) which utilize the version 2.0 DNP3 point map are those that monitor more than just a single channel of voltage. This includes Boomerangs that are single-channel but monitor both voltage and current. The voltage-only Boomerang 2S uses the 1.0 map by default, but can be reconfigured to use the version 2.0 point map, while the Boomerang 2S (voltage and current version), 3-phase, and plug-in always use the version 2.0 point map.
Expanded Data Points
As might be expected, the data points from the original Boomerang v1.0 point map are all represented in the new v2.0 point map, but have different point numbers to avoid confusion and to open up a new range of values for future growth. In addition, points have been added to monitor and control the full range of data available in the entire Boomerang line. These expanded points cover multiple channels of voltage, current, power, threshold monitoring, event counters and event durations. The complete DNP3 point map is shown in table 1.
Saving Analog Output Values
The group 40 points are programmable values that can be sent by a SCADA master to set the current range, circuit type, or threshold levels. The values can be sent to the device each time it is initialized or the values can be sent once and then committed to internal storage of the Boomerang. Saving these programmable values is accomplished via group 40 point 20. This particular point is used to receive a unique integer identifier that is essentially a command to save values to internal nonvolatile storage. Writing the value of 12345 as a 16-bit integer to group 40 point 20 will initiate the save procedure. This only needs to be done once after all programmable values have already been sent by the SCADA master. It will return a DNP3 control status success response upon completion or an error code if the operation failed.
Conclusion
The expanded capabilities of the Boomerang family have added a notable increase in the volume of data that is potentially monitored by a SCADA system. Oftentimes the default operation of a SCADA master is to simply request all data per monitoring period, but then only utilize a handful of values. This setup should be avoided when possible since most Boomerangs operate via cell modem data links. Instead, the SCADA master should request only the specific data points it will use per monitoring period. This will ensure the most efficient usage of bandwidth when using the expanded Boomerang point map. Polling for all points (e.g. a Class 0123 poll) every time can greatly increase cell data usage, and should be avoided if at all possible.
Table 1. DNP3 Point Map Version 2.0
Group 1 – Binary Inputs
| Point | Description |
|---|---|
| 0-19 | Reserved For V1 Point Map |
| 20-99 | Unused Binary Inputs |
Channel 1 / Channel 2 / Channel 3 – Binary Input Conditions
| Ch 1 | Ch 2 | Ch 3 | Description |
|---|---|---|---|
| 100 | 200 | 300 | Voltage Normal |
| 101 | 201 | 301 | Voltage Low Low |
| 102 | 202 | 302 | Voltage Low |
| 103 | 203 | 303 | Voltage High |
| 104 | 204 | 304 | Voltage High High |
| 105 | 205 | 305 | Current Normal |
| 106 | 206 | 306 | Current Low Low |
| 107 | 207 | 307 | Current Low |
| 108 | 208 | 308 | Current High |
| 109 | 209 | 309 | Current High High |
| 110 | 210 | 310 | Real Power Normal |
| 111 | 211 | 311 | Real Power Low Low |
| 112 | 212 | 312 | Real Power Low |
| 113 | 213 | 313 | Real Power High |
| 114 | 214 | 314 | Real Power High High |
Group 2 – Binary Input Events
| Point | Description |
|---|---|
| 0-19 | Reserved For V1 Point Map |
| 20-99 | Unused Binary Input Events |
Channel 1 / Channel 2 / Channel 3 – Binary Input Events
| Ch 1 | Ch 2 | Ch 3 | Description |
|---|---|---|---|
| 100 | 200 | 300 | Voltage Returned To Normal |
| 102 | 202 | 302 | Voltage Crossed Low Threshold |
| 103 | 203 | 303 | Voltage Crossed High Threshold |
| 104 | 204 | 304 | Voltage Crossed High High Threshold |
| 105 | 205 | 305 | Current Returned To Normal |
| 106 | 206 | 306 | Current Crossed Low Low Threshold |
| 107 | 207 | 307 | Current Crossed Low Threshold |
| 108 | 208 | 308 | Current Crossed High Threshold |
| 109 | 209 | 309 | Current Crossed High High Threshold |
| 110 | 210 | 310 | Real Power Returned To Normal |
| 111 | 211 | 311 | Real Power Crossed Low Low Threshold |
| 112 | 212 | 312 | Real Power Crossed Low Threshold |
| 113 | 213 | 313 | Real Power Crossed High Threshold |
| 114 | 214 | 314 | Real Power Crossed High High Threshold |
Group 20 – Binary Counters
| Point | Description |
|---|---|
| 0-19 | Reserved For V1 Point Map |
| 20 | Run Time In Seconds |
| 21 | Received Bytes (TCP + UDP) |
| 22 | Transmitted Bytes (TCP + UDP) |
| 23-99 | Unused Binary Counters |
Channel 1 / Channel 2 / Channel 3 – Binary Counters
| Ch 1 | Ch 2 | Ch 3 | Description |
|---|---|---|---|
| 100 | 200 | 300 | Voltage Low Low Events |
| 101 | 201 | 301 | Voltage Low Events |
| 102 | 202 | 302 | Voltage High Events |
| 103 | 203 | 303 | Voltage High High Events |
| 104 | 204 | 304 | Reserved |
| 105 | 205 | 305 | Time Voltage Low Low |
| 106 | 206 | 306 | Time Voltage Low |
| 107 | 207 | 307 | Time Voltage High |
| 108 | 208 | 308 | Time Voltage High High |
| 109 | 209 | 309 | Time Voltage Normal |
| 110 | 210 | 310 | Current Low Low Events |
| 111 | 211 | 311 | Current Low Events |
| 112 | 212 | 312 | Current High Events |
| 113 | 213 | 313 | Current High High Events |
| 114 | 214 | 314 | Reserved |
| 115 | 215 | 315 | Time Current Low Low |
| 116 | 216 | 316 | Time Current Low |
| 117 | 217 | 317 | Time Current High |
| 118 | 218 | 318 | Time Current High High |
| 119 | 219 | 319 | Time Current Normal |
| 120 | 220 | 320 | Real Power Low Low Events |
| 121 | 221 | 321 | Real Power Low Events |
| 122 | 222 | 322 | Real Power High Events |
| 123 | 223 | 323 | Real Power High High Events |
| 124 | 224 | 324 | Reserved |
| 125 | 225 | 325 | Time Real Power Low Low |
| 126 | 226 | 326 | Time Real Power Low |
| 127 | 227 | 327 | Time Real Power High |
| 128 | 228 | 328 | Time Real Power High High |
| 129 | 229 | 329 | Time Real Power Normal |
Group 22 – Binary Counter Events
| Point | Description |
|---|---|
| 0-19 | Reserved For V1 Point Map |
| 20-99 | Unused Binary Counter Events |
Channel 1 / Channel 2 / Channel 3 – Binary Counter Events
| Ch 1 | Ch 2 | Ch 3 | Description |
|---|---|---|---|
| 100-129 | 200-229 | 300-329 | Not Yet Implemented |
Group 30 – Analog Inputs
| Point | Description |
|---|---|
| 0-8 | Reserved For V1 Point Map |
| 9-99 | Unused Analog Inputs |
Channel 1 / Channel 2 / Channel 3 – Analog Inputs
| Ch 1 | Ch 2 | Ch 3 | Description |
|---|---|---|---|
| 100 | 200 | 300 | Rms Voltage (1 Second Average) |
| 102-104 | 202-204 | 302-304 | Reserved |
| 105 | 205 | 305 | Rms Current (1 Second Average) |
| 107-109 | 207-209 | 307-309 | Reserved |
| 110 | 210 | 310 | Real Power (1 Second Average) |
| 112-114 | 212-214 | 312-314 | Reserved |
Group 32 – Analog Input Events
| Point | Description |
|---|---|
| 0-19 | Reserved For V1 Point Map |
| 20-99 | Unused Analog Input Events |
Channel 1 / Channel 2 / Channel 3 – Analog Input Events
| Ch 1 | Ch 2 | Ch 3 | Description |
|---|---|---|---|
| 100 | 200 | 300 | Reserved |
| 101 | 201 | 301 | Voltage Returned To Normal Level |
| 102-105 | 202-205 | 302-305 | Reserved |
| 106 | 206 | 306 | Current Returned To Normal Level |
| 107-110 | 207-210 | 307-310 | Reserved |
| 112-114 | 212-214 | 312-314 | Reserved |
Group 40 – Analog Outputs
| Point | Description |
|---|---|
| 0-19 | Reserved For V1 Point Map |
| 20 | Commit Output Settings To Flash Storage |
| 21 | Threshold Hold Off Time (Seconds) |
| 22 | Threshold Hysteresis |
| 23 | Current Range (0-3) |
| 24 | Circuit Type (0-2) |
| 25-99 | Unused Analog Outputs |
Channel 1 / Channel 2 / Channel 3 – Analog Outputs
| Ch 1 | Ch 2 | Ch 3 | Description |
|---|---|---|---|
| 100 | 200 | 300 | Voltage Low Low Threshold |
| 101 | 201 | 301 | Voltage Low Threshold |
| 102 | 202 | 302 | Voltage High Threshold |
| 103 | 203 | 303 | Voltage High High Threshold |
| 104 | 204 | 304 | Reserved |
| 105 | 205 | 305 | Current Low Low Threshold |
| 106 | 206 | 306 | Current Low Threshold |
| 107 | 207 | 307 | Current High Threshold |
| 108 | 208 | 308 | Current High High Threshold |
| 109 | 209 | 309 | Reserved |
| 110 | 210 | 310 | Real Power Low Low Threshold |
| 111 | 211 | 311 | Real Power Low Threshold |
| 112 | 212 | 312 | Real Power High Threshold |
| 113 | 213 | 313 | Real Power High High Threshold |
| 114 | 214 | 314 | Reserved |