Abstract
The increasing development and use of solar power generation using Photovoltaic (PV) systems introduces new power quality perspectives and challenges. Understanding common analytic avenues with regard to PV systems can help identify and prevent issues with grid stability, and improve the quality of generated power.
Common Issues
Most problems are attributed to DC AC inverters used to create 60Hz sine waves from solar panels. Since these inverters create AC waveforms by switching a DC bus (using a technique known as Pulse Width Modulation) and relying on filters to create a smooth current waveform, harmonics can be introduced into the resulting system, often of a much higher frequency than is typically seen in loads. For those systems that aren’t phase locked well, the fluctuation of frequency in relation to the grid can cause interharmonic distortion. The interharmonics introduced tend to fall around the 60Hz range, as the introduction of beat frequencies to the system result from the straying from 60Hz.
Another concern for stability can be seen when there are rapid changes to the output of a PV system, such as those caused by passing cloud cover. When power output changes in such a manner, correction systems are repeatedly utilized in order to maintain nominal voltage such as capacitor banks and distribution regulators. Total harmonic distortion (THD) violations may contribute to this problem, since they could require a system to be shut off to alleviate the issues being imposed on the grid, which would further exacerbate the issue.
Monitoring Recommendations
Several types of data can assist with the monitoring or evaluation of a PV system.
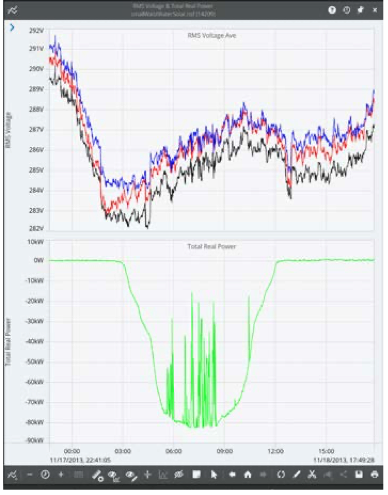
• Stripcharts, used to identify issues with voltage, current, power output, or reactive power.
• Daily profiles, to gather a better understanding of time frames during the week which may, on average, differ from normal system operation.
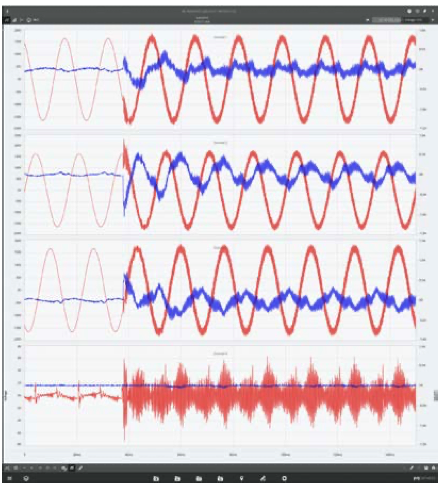
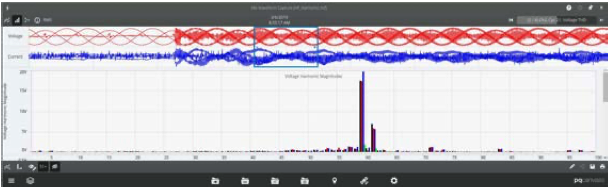
• Waveform captures, to analyze the waveshape generated by DC AC inverters, harmonics introduced by variations in PV output, and the inverter response to sags.
Since the measures used to create daily profiles are based on the measures chosen for stripcharts, only stripchart and waveform configuration will be discussed.
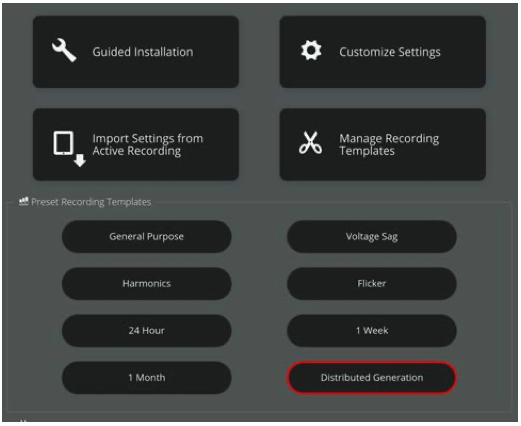
Stripchart Configuration
To analyze a PV system, at least three basic measures should be recorded: RMS Voltage, RMS Current, and Real Power. Knowing system voltage level, the efficacy of solar panels, and the output of a PV system requires that these measures be present.
Reactive Power is especially helpful, and Apparent Power can assist as well. Any power factor analysis will require the presence of VAR data, and when loads are present it will help to complete an understanding of issues that may arise.
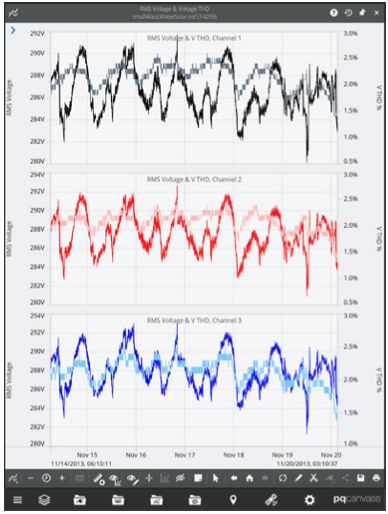
Voltage and Current THD are necessary for the analysis of harmonics and their impact on the system. An increase in the harmonics introduced can be easily seen when viewing THD graphs, and can help reduce the problems that are created by bad inverters.
Frequency is helpful in determining if 3-Phase systems are properly phase-locked. Beat frequencies, caused by the difference between system frequency and grid frequency, can be seen when this data is recorded. Even if the system is isolated and not connected to a grid, this can be useful to establish the normal operating frequency of said system.
Devices such as the Seeker can record all of these measures, and the Revolution can additionally record interharmonics. Enabling 1st harmonic (fundamental) recording will also record those interharmonics (if enabled) in the 5Hz bins around the fundamental, and would assist in the analysis of frequency variations.
The interval at which the device records measurement data is just as important as the data chosen. Since varying wind and cloud cover can cause rapid changes in system output, having a short enough interval to see these fluctuations is necessary. A recording interval of 1 minute is recommended. To increase the resolution of data, a smaller recording interval can be chosen, but anything over 1 minute will not reliably record variations in output due to changes in solar input.
Waveform Capture Configuration
Capturing waveforms allows analysis down to the cycle level, and can catch irregularities in poorly phase-locked systems. When viewing waveforms in PQ Canvass, we can also perform harmonic analysis and view the angles of each phase in a vec-tor diagram in addition to viewing just the waveform capture.
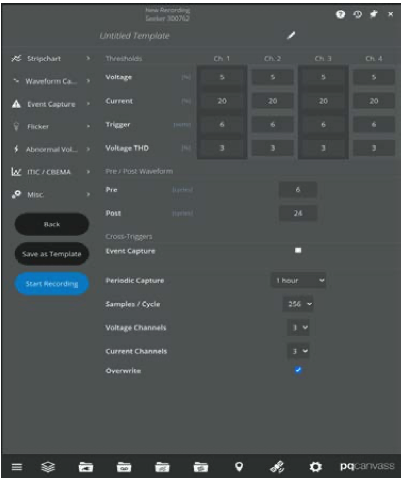
Voltage Thresholds should be raised (5%, 6V), while Voltage THD Thresholds should be lowered (3%), to catch changes in waveshapes without catching normal variation in system voltage too often.
Decreasing the Current Thresholds (10%) will allow PV system connection and disconnection events to be captured.
Increasing both Pre Cycles (6) & Post Cycles (24) will provide a ‘higher-level view’ of the event, such as capturing voltage decay from disconnects.
Depending on the system and monitoring configuration, 3 channels or 1 channel can be selected for the number of Voltage and Current Channels that will be recorded for waveform captures.
Periodic Capture should be set to get a snapshot of the system to establish baselines as the day progresses. One (1) hour is a good starting point.
Conclusion
Whether the photovoltaic system is isolated or connected to the power grid, several issues present themselves for consider-ation when evaluating these systems. Using a Seeker and PQ Canvass allows the user to analyze power quality pitfalls when dealing with these systems in the field and on-the-fly, or remotely. Using these recommended settings will provide a more detailed assessment of power quality within PV systems.
