
Abstract
In power quality investigations, triggered waveforms often claim the spotlight, but it is the stripchart that tells the story of the entire recording. Reviewing this data manually is tedious, error-prone, and lacks context. Merlin™ applies AI-driven pattern recognition to the full stripchart, automatically examining voltage and current behavior across all phases to determine root cause and attribution. This white paper explores how Merlin™ organizes stripchart findings into six distinct analysis modules — Voltage Sags, Voltage Swells, Loose Neutrals, Voltage Regulation, Flicker, and Harmonics — delivering specific, actionable conclusions rather than raw statistics.
The Hidden Story in Data Trend
In power quality investigations, triggered waveforms often claim the spotlight. They provide the millisecond-level forensics needed to diagnose a specific fault. But waveforms are merely snapshots of a single moment in time. To truly understand grid health, or diagnose an intermittent customer complaint, engineers must look within the stripchart.
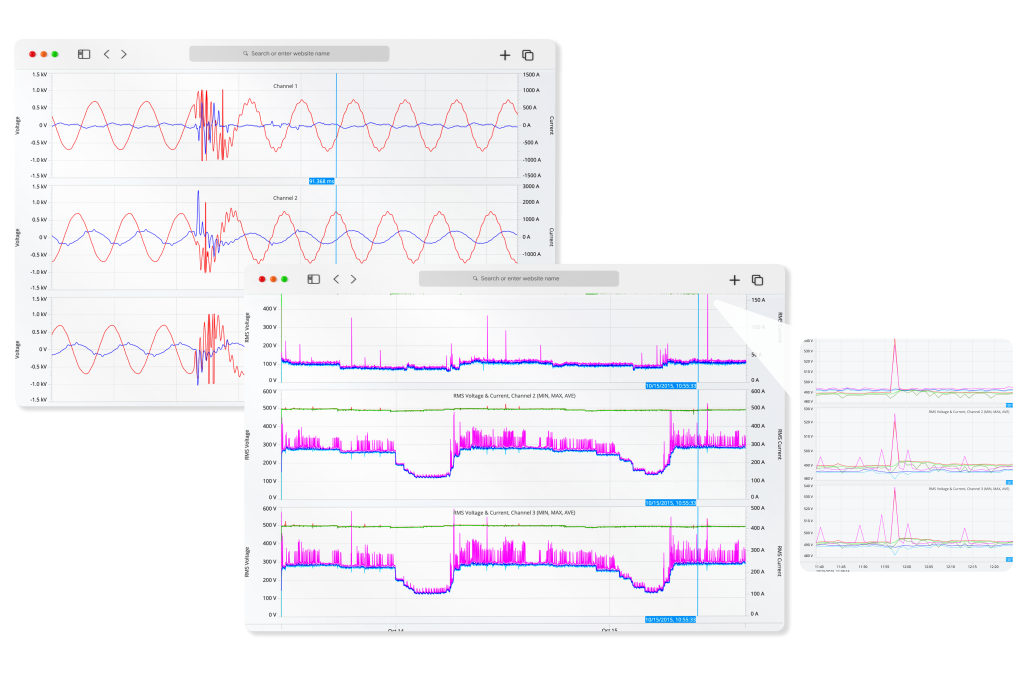
The stripchart graph tells the story of the entire recording. It captures the slow drift of voltage regulation, the rhythmic pulse of load cycling, and the subtle interactions between current and voltage that isolated triggers miss. However, extracting these insights has historically been a brute-force exercise. Engineers are forced to scroll through troughs of trend data, having to scan visually for deviations. Traditional Power Quality software compounds the problem by relying on binary thresholds: if a value does not cross a red line, it is treated as “normal,” ignoring the nuance of complex power quality issues.
The Inefficiency of Manual Review
A standard seven-day recording can contain many thousands of interval data points (ex. a recording configured at a 1 second interval on a four-channel recorder would log over 4.8 million points across 4 channels of voltage and 4 channels of current in just 7 days). For the human analyst, reviewing this data is a battle between volume and attention. The tedious scrolling through traces leads to attention fatigue, where subtle anomalies are easily missed.
Worse, manual analysis lacks context. A voltage sag on a stripchart looks identical whether it was caused by a lightning arrestor miles away or a motor starting next door. Without instant correlation to load current, determining attribution requires tedious manual cross-referencing. This reactive workflow often fails to explain the specific “why” behind a customer complaint, leaving engineers with data but no answers.
Context-Aware Automation
Merlin™ shifts this paradigm by applying AI-driven pattern recognition to the entire stripchart recording. Rather than treating each channel in isolation, Merlin™ evaluates the full context of the data — automatically examining voltage and current behavior across all phases to determine root cause and attribution.
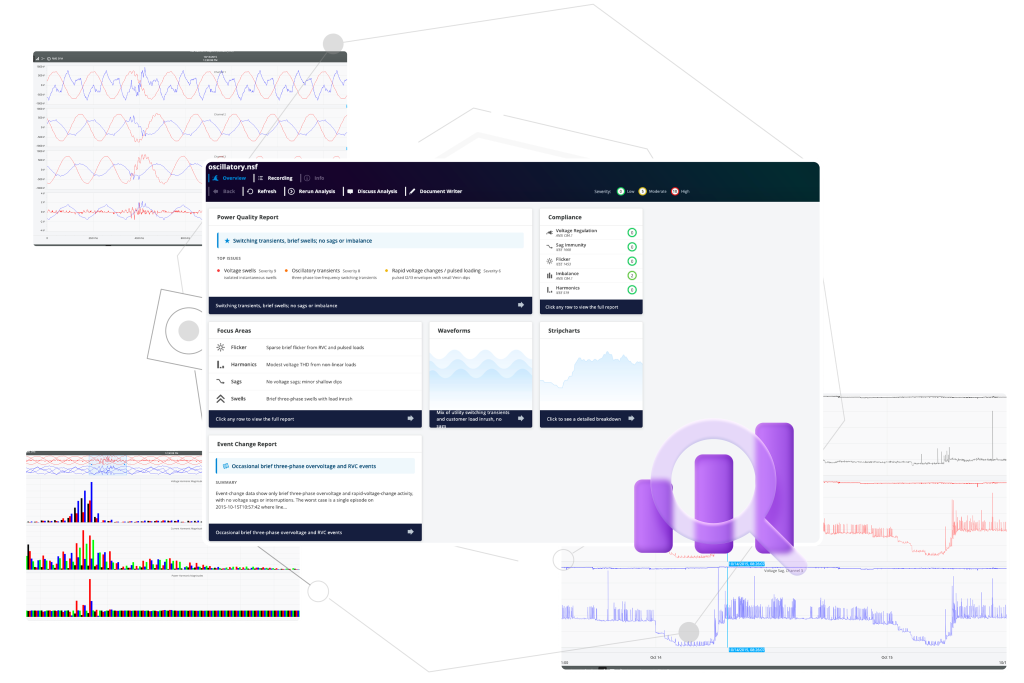
Merlin™ organizes the stripchart findings into six distinct analysis modules: Voltage Sags, Voltage Swells, Loose Neutrals, Voltage Regulation, Flicker, and Harmonics. Each module delivers specific, actionable conclusions rather than raw statistics, allowing engineers to move directly from findings to remediation.
1. Voltage Sags: Context and Attribution
While triggered waveforms capture the millisecond-level detail of a sag, the stripchart module provides the essential operational context. Merlin™’s primary goal here is attribution: distinguishing between voltage sags caused by the customer’s own equipment and those originating from the utility grid.
For each sag event identified in the trend data, Merlin™ delivers a clear determination — customer-sourced or utility-sourced — along with the supporting evidence and time intervals. This eliminates one of the most time-consuming tasks in complaint investigations: manually determining who or what is responsible for a voltage dip. Engineers receive a definitive answer they can present to a customer or use to prioritize field work.
2. Voltage Swells: Detecting System Instability
Voltage swells are less common than sags but often more destructive. Merlin™’s swell analysis identifies momentary voltage rises and evaluates them against equipment tolerance curves (ITIC/CBEMA), assessing multi-phase behavior to distinguish between benign regulation overshoots and dangerous system conditions.
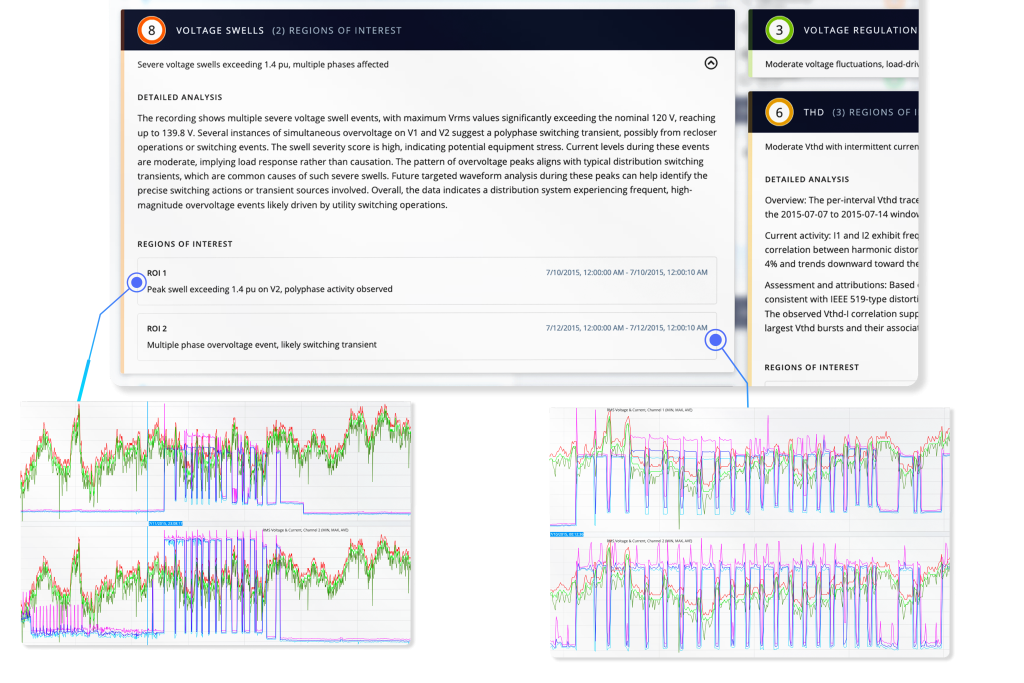
The result is a prioritized list of swell events with severity ratings and system-level context. Merlin™ flags conditions that may indicate arrester failures, capacitor bank switching issues, or regulation malfunctions — enabling engineers to act on the events that pose the greatest risk to surge suppressors and sensitive electronics.
3. Loose Neutrals: The Safety Sentinel
Open or loose neutrals in single-phase residential services can lead to fire hazards and catastrophic equipment damage, yet the condition often manifests as subtle voltage drift that standard threshold alerts miss entirely.
Merlin™ applies proprietary detection methods specifically designed to identify neutral impedance problems, distinguishing them from general grid regulation issues that produce superficially similar voltage behavior. When a potential loose neutral is detected, Merlin™ reports the affected time intervals and confidence level, allowing utilities to dispatch crews before a catastrophic failure occurs.
4. Voltage Regulation: Steady-State Compliance
While sags and swells deal with transient events, the Voltage Regulation module evaluates the long-term health of the service. Merlin™ assesses the steady-state voltage profile against ANSI C84.1 Range A and Range B limits, filtering out momentary excursions to focus on the true delivered service voltage.
The output is a compliance “report card” that identifies chronic under-voltage conditions (which cause motor overheating) or over-voltage conditions (which reduce lighting and driver life). This gives engineers a clear picture of how the utility’s voltage regulator settings and capacitor bank schedules are performing under real-world load conditions.
5. Flicker (Pst): Correlating Irritation With Load
Flicker is a complex phenomenon comprising both the “sensation” of light instability (Pst) and the voltage modulation that causes it. High Pst values confirm that a customer is likely experiencing irritating lighting conditions, but the raw number does not explain the cause.
Merlin™ determines whether observed flicker is being imported from the grid or generated by the customer’s own load — and characterizes the behavior pattern to help identify the type of equipment involved. This attribution is the key differentiator for closing out flicker complaints: instead of presenting a Pst number, the engineer can present a cause.
6. Harmonics (THD): Identifying Distortion Sources
As non-linear loads (EV chargers, VFDs, LED lighting) proliferate, harmonic distortion has become a primary concern. Merlin™’s Harmonic module goes beyond reporting a single “Max THD” value. It tracks Total Harmonic Distortion (THD) and Voltage THD (VTHD) trends over the full recording period and identifies when and why distortion levels change.
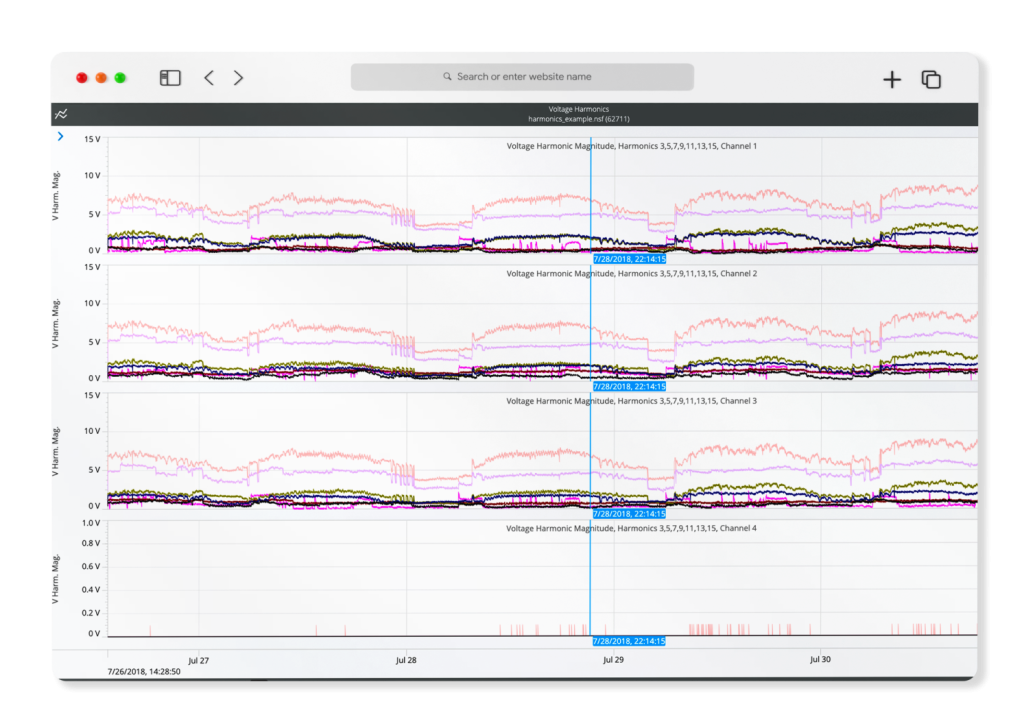
Engineers receive insight into whether harmonic distortion is a constant background condition or a specific interaction tied to equipment operation and time-of-day patterns. This context guides decisions about filter placement, system reconfiguration, or further investigation into specific loads such as solar inverters or industrial drives.
Conclusion
Merlin™ delivers evidence, not just data. Every insight — whether a voltage sag attribution, a loose neutral detection, or a harmonic trend analysis — is backed by specific observations and time-stamped regions of interest that the engineer can verify against the underlying stripchart graphs. This transparency transforms the analysis from a subjective opinion into a clear, auditable conclusion that can be confidently presented to a customer or included in a regulatory filing.