Abstract
Power quality (PQ) monitoring provides insightful information that can be used to detect industrial and residential power disturbances, and provide clues for mitigation and problem resolution. Having the proper power monitoring tools and a systematic approach to analyzing these problems will make the process much easier for you and your customers ensuring that no information is missed. This article will discuss the concepts needed to approach your next PQ monitoring job systematically and give ideas to add to your checklist for your on-site work.
Identifying and Classifying Customer Needs
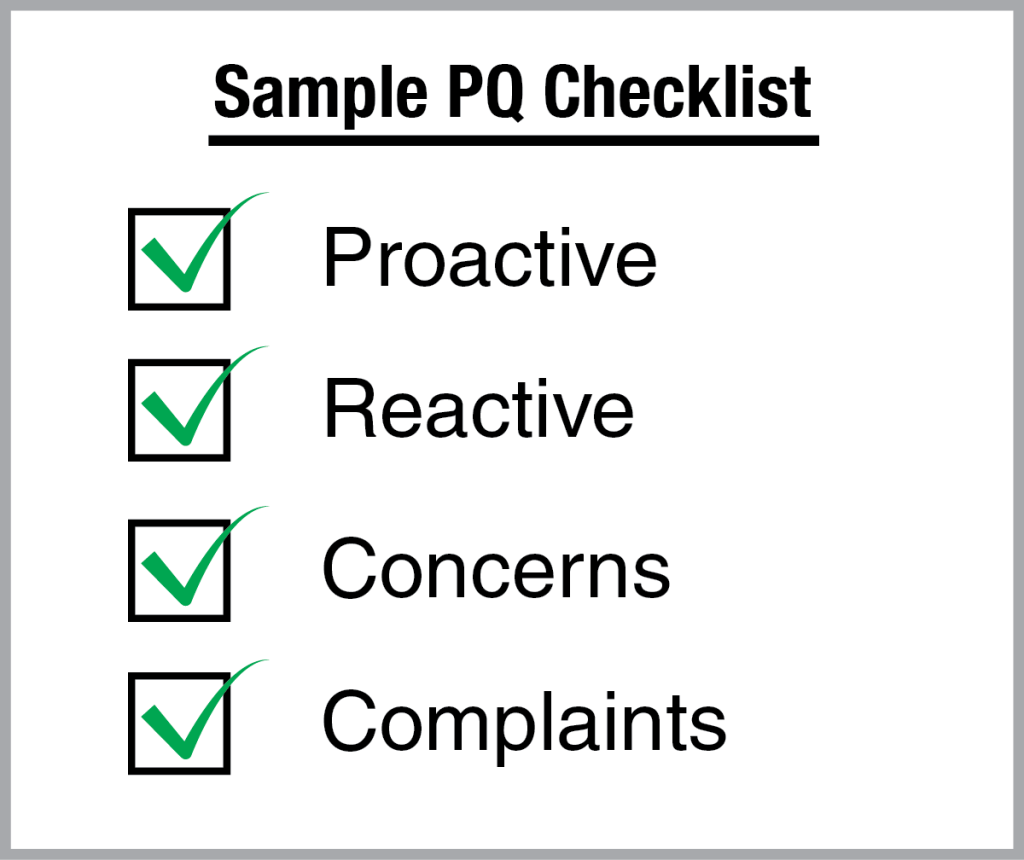
PQ monitoring jobs generally fall into two categories, proactive (preventative and baselines of electrical) and reactive (customer observed problems). When establishing a monitoring program for customers, keeping track of the customers concerns (proactive monitoring) and their complaints (reactive monitoring) should be established early in the process. Putting concerns, complaints and objectives into writing allows all team members to have a better picture of why the power quality assessment is taking place.
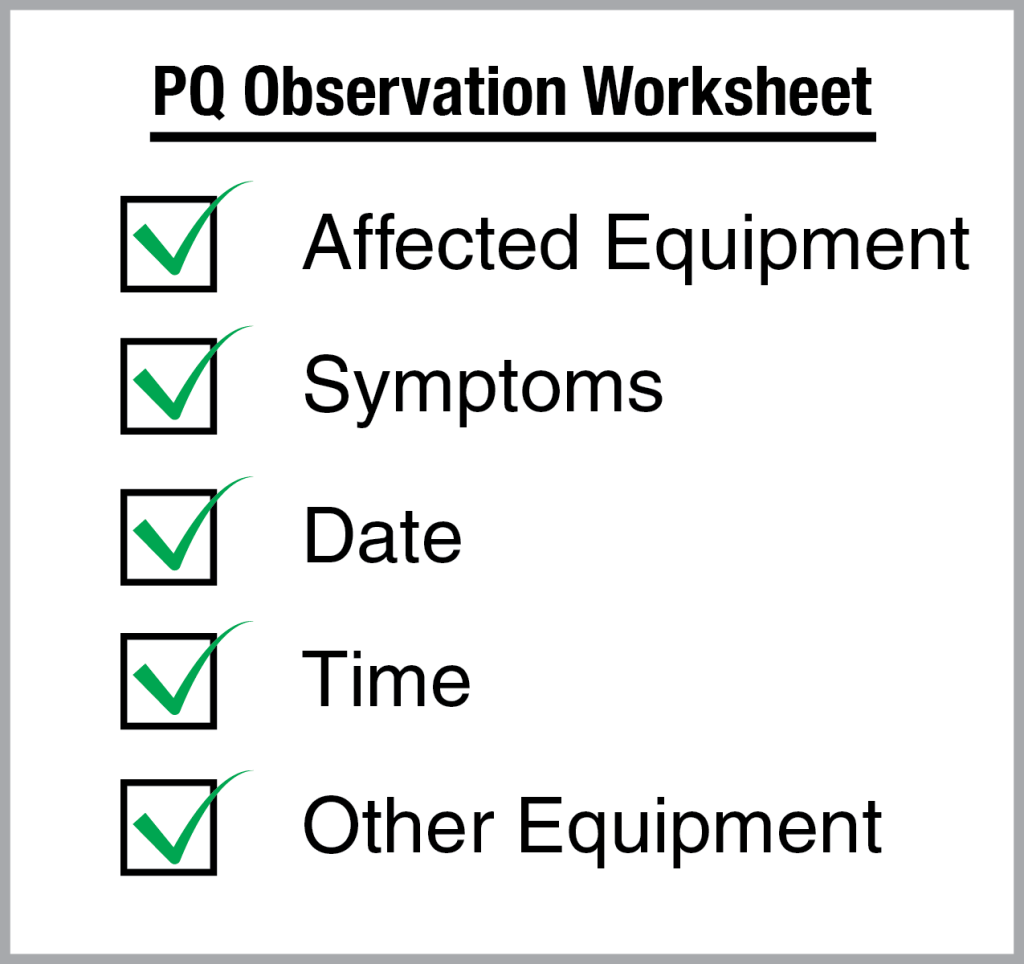
Reactive monitoring should begin by gathering facts related to the initial complaint including: what equipment is affected, characteristics of the affected equipment, when the events started, when the problems occur, and the observed symptoms. Since some problems occur sporadically and may be hard to capture, it is always beneficial to inform the customer to start collecting detailed information as soon as possible. Providing the customer with a PQ observation worksheet to track events could reveal important information especially if you are not able provide on-site analysis quickly (see Figure 1).
Proactive monitoring requires a focus on the future concerns of the customer when collecting initial information. Determining if the customer is looking for a baseline for future expansion of electrical systems or if they are looking for hidden PQ issues can help to indicate the extent of the equipment needed for the job. Baseline recording can be as simple as monitoring voltage or more complex where harmonic levels, flicker, and reference waveforms are logged (See Figure 2).
The IEEE 1159-1995 standard indicates that in order for a power monitoring project to be successful, the objectives must be clearly defined. Making sure to identify the reactive and proactive components as part of the objectives helps with this clarity and the overall goal of solving your customer’s needs.
Collecting Site Layout Information
Troubleshooting PQ problems simplified by having an accurate representation of the site power system layout and the equipment in operation. Documenting the facilities may reveal the problems without the need for placing monitoring equipment, freeing expensive resources for use at other job sites. The process of reviewing a list of facility equipment, along with motor nameplate ratings, drive type, etc. can often suggest likely troublemakers, or at least initial monitoring locations. On the distribution system, the same approach can be used, but instead of listing individual loads, customer types on a circuit are identified (residential, commercial, heavy industrial, etc.), along with utility equipment (power factor caps, reclosers, etc.)
Locate Adjacent Customers from the Point of Common Coupling (PCC)
Collect any available information about adjacent customers and the equipment they operate. If the source of the problem isn’t found to be on-site, the additional information can point the way to other causes. If present, concentrate especially on other customers on the same distribution transformer secondary, especially for residential situations. The customer with the PQ complaint may not be the root cause of the PQ problem, just someone with particularly sensitive equipment.
Identify Equipment and Types
Collect information on the type of device, what type of load it is (linear vs. nonlinear, resistive, capacitive, inductive), the operating patterns of the device, start/stop characteristics, and device compatibility parameters. For programmable equipment like VFDs, the controller programming and thresholds are just as important as the physical construction.
Electrical System Information
Collect information on which equipment is adjacent to each other on a circuit, the distances of the electrical run and cable characteristics, transformer characteristics, and the loads on the circuit. Additionally do not forget to list any power conditioning apparatus in operation on the circuit.
Pay special attention to large motors and VFDs which can contribute to sags and harmonics. UPSs can also be problematic, especially if the switching thresholds are overly conservative (a common default condition from the factory).
Monitoring Objectives
Now that the equipment has been classified we can determine the parameters that require monitoring. Depending on the type and input characteristics of the identified equipment it will be necessary to monitor for one or more of the following objectives:
| Parameter | Reasons To Include | Typical Limits | Trace to Evaluate |
|---|---|---|---|
| Steady State Voltage | Baseline service voltage can reveal regulation or transformer loading issues. | Nominal ±5% at service entrance. Adjust for sensitive devices. | Avg. Voltage – All Channels |
| Sags | Most common PQ issue – can cause many types of equipment disoperation | ITIC Curve | Vmin. All Channels. ITIC Curve |
| Swells | Can shorten equipment lifetime or cause damage | ITIC Curve | Vmax All channels |
| Transients | Can shorten equipment lifetime or cause damage, also can cause intermittent equipment disoperation | Upper Limit = 5% | Waveform and Transient Capture. All Channels |
| % THD | Can cause increased transformer and equipment heating | %THD Avg. All Channels | None Preferred |
| Momentary Interruptions | Can interrupt important commercial/industrial processes | Vmin., or RMS Capture | |
| Flicker | Light flicker produces customer complaints; can correlate with other sag-related PQ issues | Perceptibility Short Term (Pst) All Channels | Flicker meter Pst <= 1.0 |
| % 3 Phase Unbalance | Can cause increased motor heating, shorter lifetime | Upper Limit = 3% | % Unbalance from RMS avg. voltage |
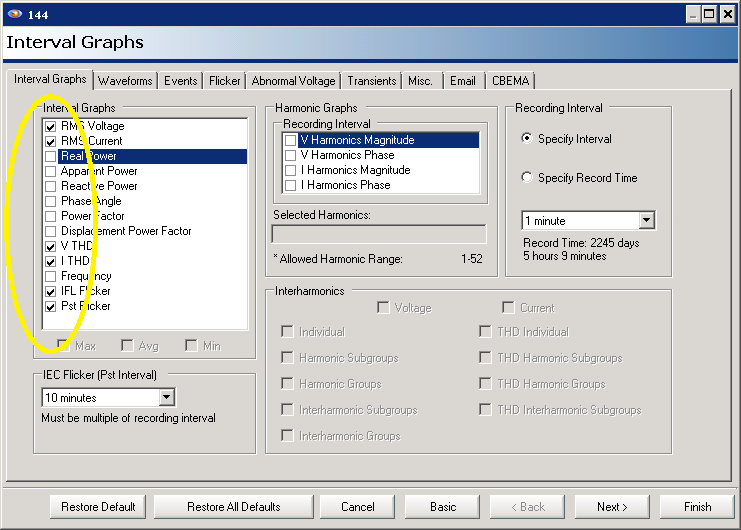
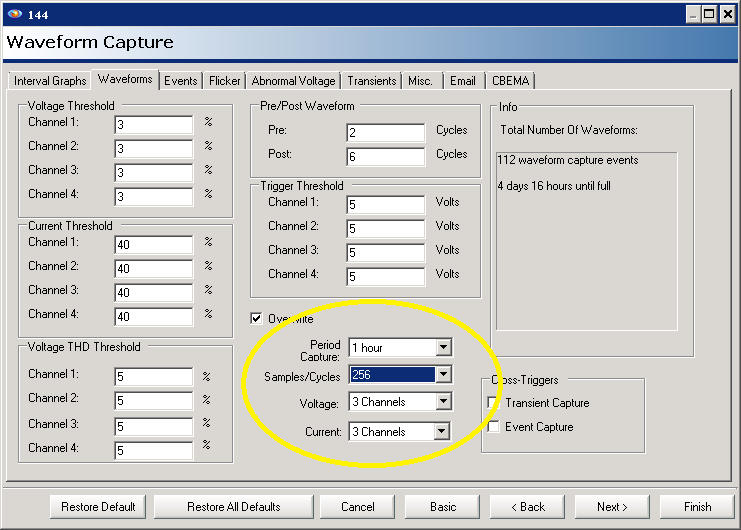
At a minimum, the RMS voltage and current stripchart data is essential for just about any PQ investigation. The Eagle, Guardian, and Revolution may be used for flicker, harmonic, and waveform capture recording, providing more information for in-depth analysis. With these recorders, adding voltage and current THD, and Pst flicker doesn’t take much extra memory. Individual harmonics aren’t always needed in stripchart form – these can be computed by ProVision from captured waveforms. If a specific harmonic is known to be a problem, a stripchart log can be very useful though, but recording all harmonics in stripchart form consumes a significant amount of memory. Figure 3 shows the basic stripchart enabled. For waveform capture, periodic capture can be useful for baseline waveshape references. Enable the “periodic capture” features as shown in Figure 4, along with strategically setting the number of current and voltage channels, and waveform data rate, to maximize recorder memory.
ProVision templates are useful for consistent recording, and ensuring that all data is available for your monitoring objective. It’s recommended to create separate templates for simple RMS voltage/current logging, harmonic recording, and transient/waveform disturbance complaints. These can be further tailored to specific types of equipment (e.g. iVS-2SX socket recorder, Eagle, Revolution, etc.).
Choosing Recorder Locations
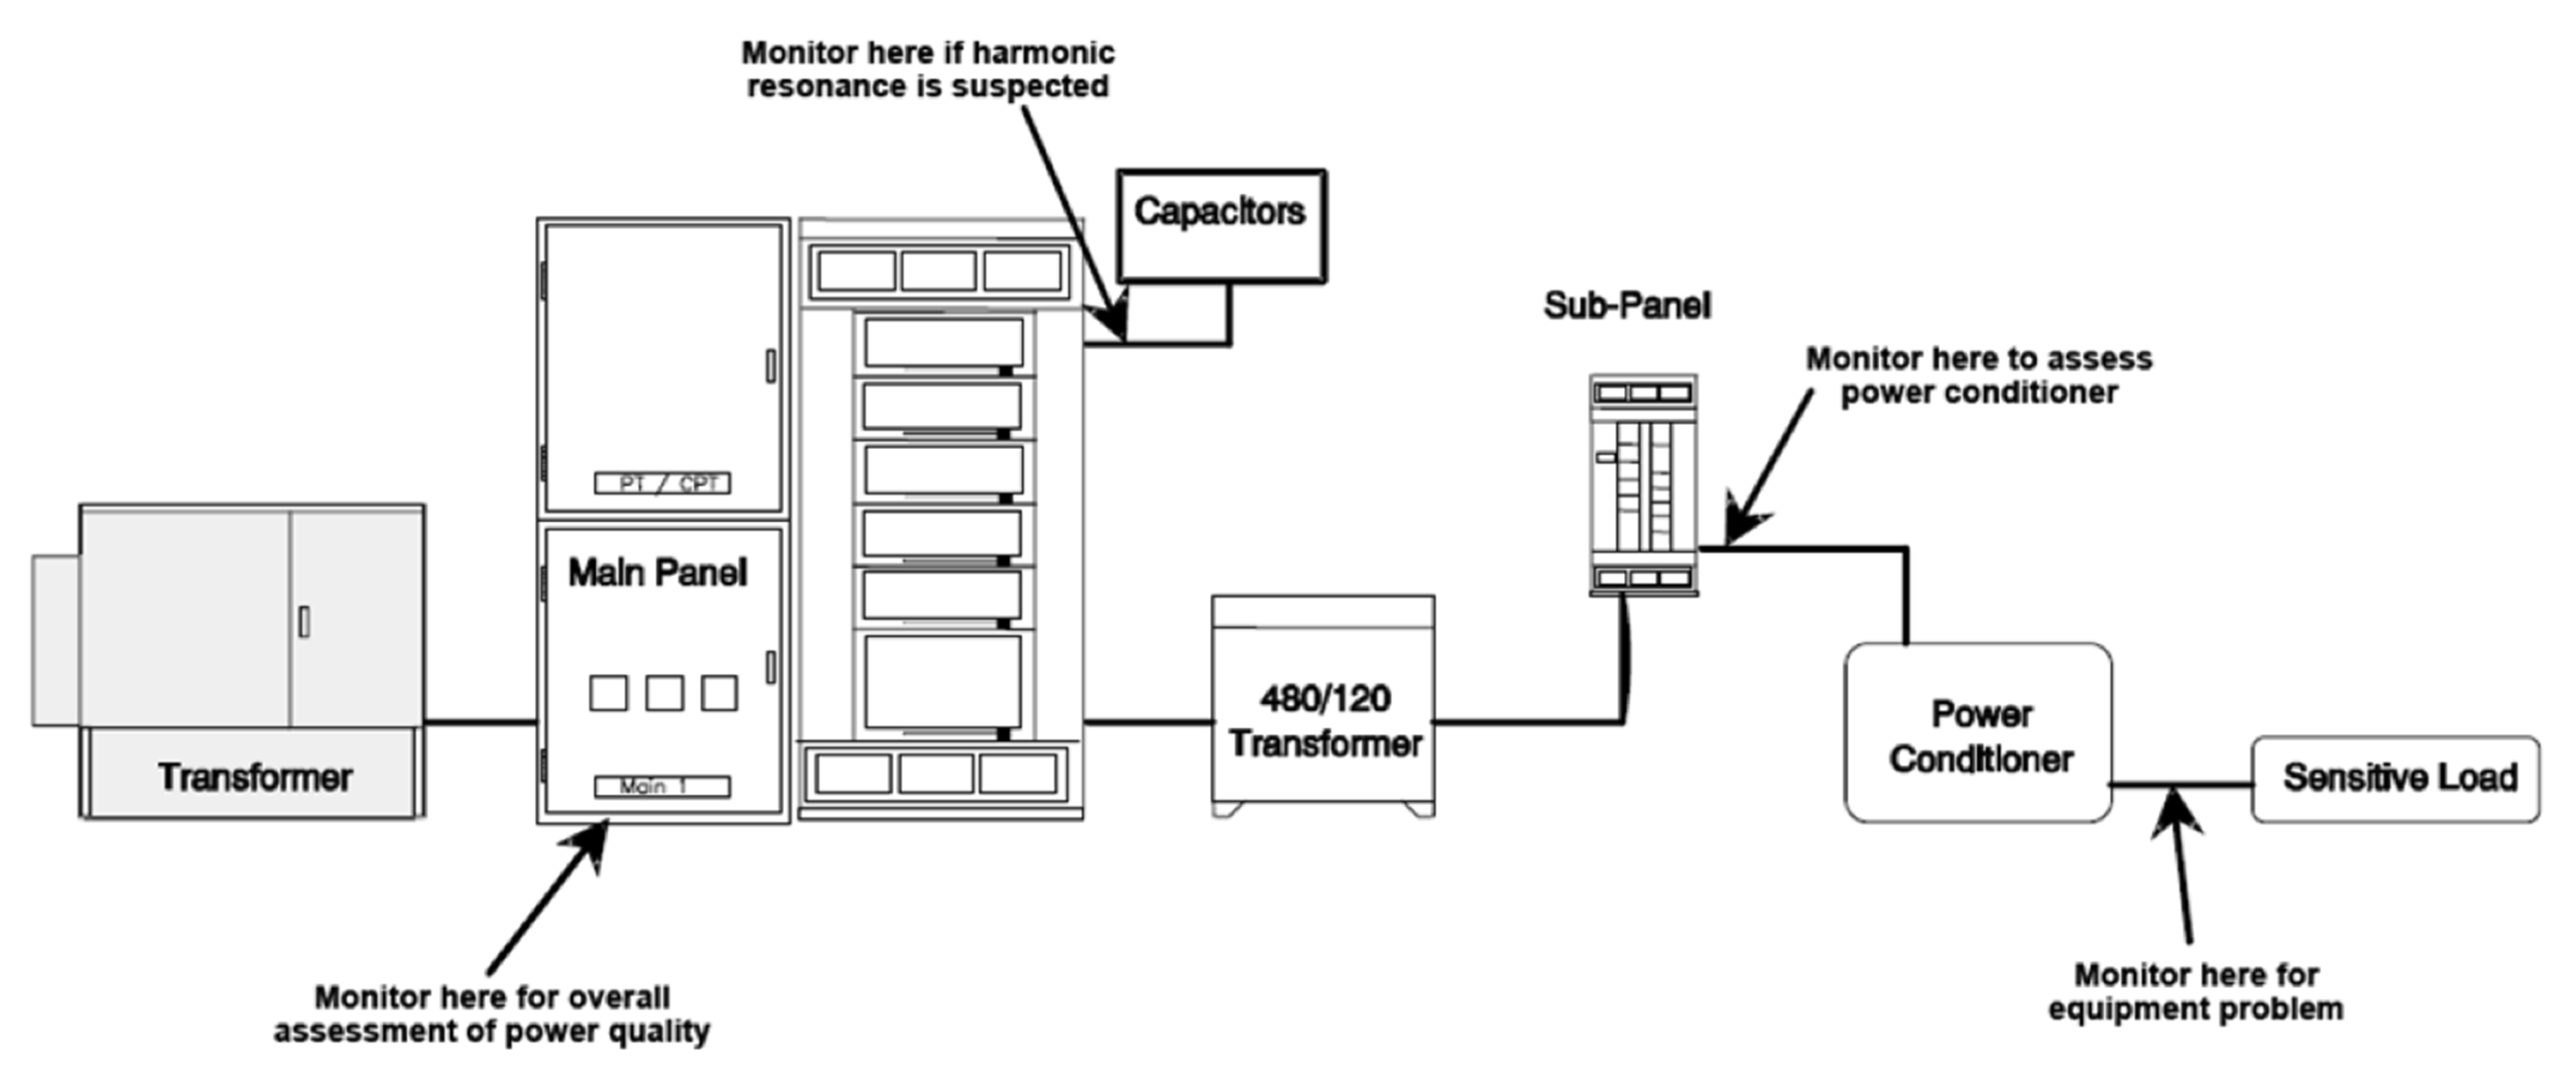
The two primary monitoring locations in Figure 5 are at the facility service entrance, or at a particular piece of equipment. If it is believed that PQ problems are affecting a particular piece of equipment it is best to place the monitor as close as possible to the equipment’s location. High frequency harmonics and fast transients can be attenuated by line impedance and may not accurately represent what is being seen by the equipment if placed elsewhere in the facility. In addition, connect the recorder the same way the load is connected (e.g. if the load is connected delta, connect the recorder as a delta, even if a neutral is available). The drawback to placing the monitor inside the facility is that it’s harder to determine if quality problems are originating from the utility or on the customer’s side.
If it is not necessary to investigate a particular piece of equipment then the service entrance is the logical choice for monitoring PQ conditions. At this location the recorder is in a position to “see” everything as delivered by the utility. Utility voltage requirements are geared towards this point, and any PQ problems originating further in are generally the customer’s responsibility. Since the current for all facility loads will pass through this point the data can be used to help determine if the customer is causing the disturbance.
Voltage disturbances that aren’t correlated with the building current likely originate from other customers on the same transformer secondary, or elsewhere on the distribution system. It’s important to note the times when the customer reports PQ symptoms – these may not correspond to apparent PQ issues to the delivered voltage. In this case, the PQ issue likely is inside the building, and monitoring further in is required.
Parallel monitoring at the service entrance and at a sensitive equipment location can be very powerful for quantifying PQ issues, and finding a root cause. If a PQ issue is seen at the equipment location, but not at the service entrance, internal building loads and wiring are likely causing the problem. If the voltage disturbance is present at both locations, but uncorrelated to the load current, the problem is likely coming from upstream in the distribution system. If it’s seen in both recordings, but correlated with the load, there’s a good chance a load inside the facility is affecting the service voltage.
Matching Test Equipment Features to the Job at Hand
Modern equipment, such as PMI’s line of PQ monitors, offers many features that make PQ measurement and analysis as straightforward as possible once their capabilities are understood. For residential and light commercial problems the 120V plug-in Eagle 120 may be sufficient. If the sensitive load is a 120V single-phase device such as a computer, cash register, etc., the Eagle 120 gives a complete picture for that load, including harmonics, flicker, and waveform capture. For residential service entrance monitoring, the Guardian Form 2S recorder is most applicable. For 3-phase commercial or industrial locations, the Eagle or Revolution recorders are best suited. The Revolution’s optional cell modem allows for remote access and instant notification of events.
Conclusion
Organization in the methods of collecting information can increase your chances of finding power quality problems on the first try and to obtain the data that you need for analysis with fewer site visits. A methodical, systematic approach insures that no details are missed, and also involves the customer in helping to resolve their own problems. For large or sensitive customers, these records can also be useful when additions or changes are made to the facility, and problems crop up in a previously good environment.