
Abstract
Now it is possible to inspect the quality of electricity from hard line power sources from anywhere with internet access. PMI’s Canvass web-based software works with Boomerang Voltage monitors to provide a broad picture of RMS voltage. What follows is a brief introduction to the Canvass user interface and instructions on how to perform basic operations with Canvass, such as assessing the status of Boomerang monitors and viewing graphs.
The Main Interface
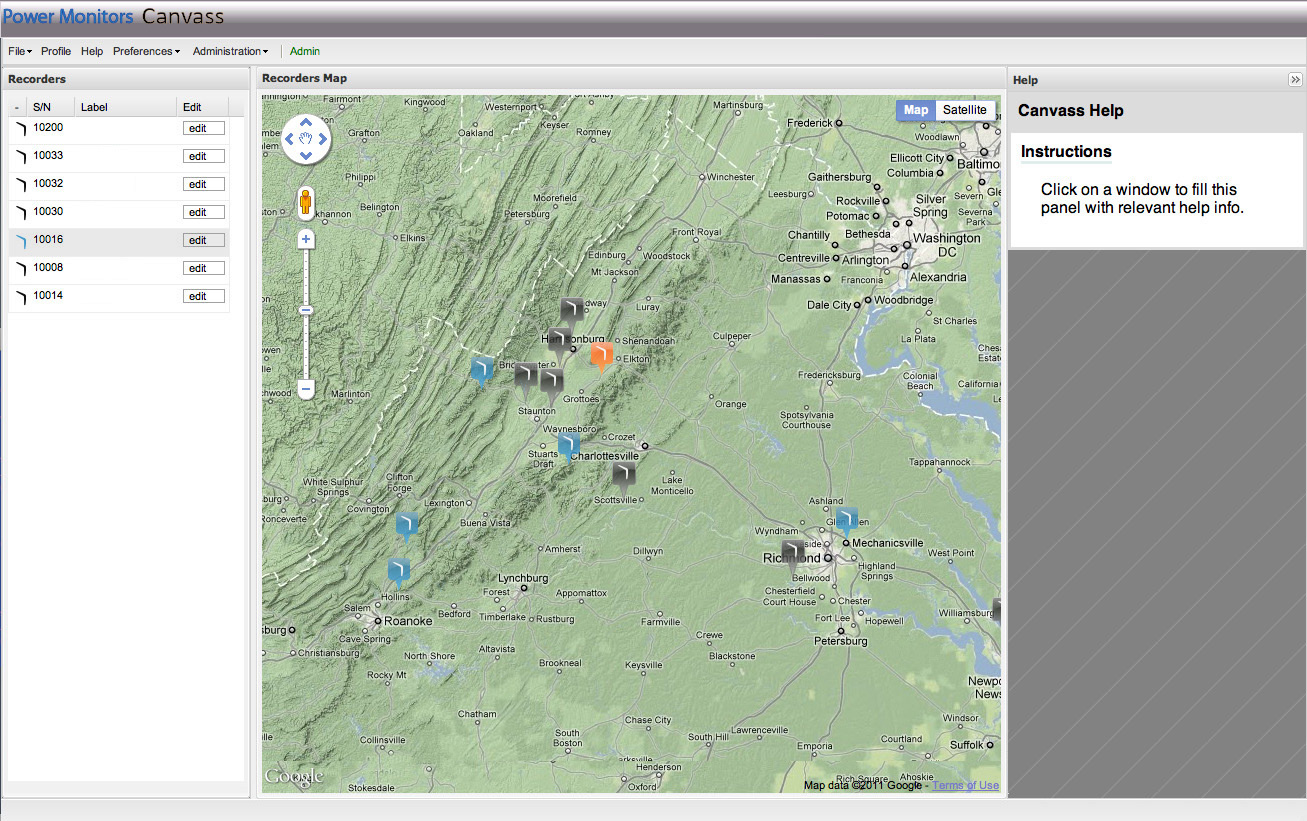
An overview of the Canvass interface is shown in Figure 1. The main menu bar (A) contains several drop down menus with options for signing out, creating distribution lists, and viewing help. The panel on the left of the screen (B) contains the list of monitors associated with the operator’s account. The Center Panel contains a map that shows the status and location of these monitors (C). The panel on the right is a help panel (D). If the help panel is not visible, expand it by clicking Help on the main menu or clicking the arrow at the top corner of the panel. Hide the panel by clicking the arrow a second time.
The Map
The Google Map at the center of the interface shows the location and status of the operator’s Boomerang monitors. A blue monitor icon is in a normal state; an orange icon is in an alert state; a black icon has stopped sending updates for some time and is dead. Zooming in on the map will expand these icons into a marquee, displaying the monitor’s name and serial number.
Viewing Graphs
To view a graph either click on a Boomerang icon on the map or click on the monitor’s name in the panel list to the left of the map to open up that monitor’s menu window, as shown in Figure 2.
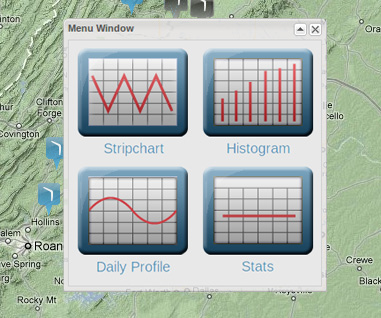
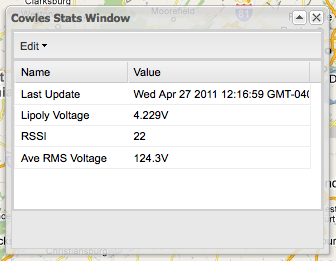
Once the device’s menu window is open it is possible to view stripchart, histogram, and daily profile graphs by clicking on the appropriate button. Clicking on the Stats button will open a window containing real-time statistics for the selected monitor (Figure 3).
The Help Panel
To have the help panel automatically display information about a particular window, just click on the window in question, and the panel will populate with pertinent information.
Graphing Multiple Monitors
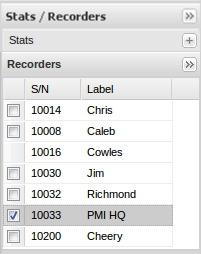
By default, the monitor associated with the window is graphed. To graph other monitors at the same time, click on the checkbox next to the monitor’s name in the panel to the right of the graph.
Zooming
To zoom in on a graph, simply click and hold in the graph area, drag the mouse to the right, and release. The zoom highlight will turn green before the mouse is released to indicate that the drag area is sufficient. If the mouse is not dragged far enough, the highlight will remain red and zooming will not occur.
Viewing Histogram Stats
To view various statistics about the histogram graph for the selected monitor, click on the button on the Stats tab located to the upper right of the graph. Toggle back to the monitors list by clicking on the Recorders button on the monitors tab.
Conclusion
Boomerang monitors when paired with the Canvass web utility are a powerful new addition to PMI’s ever growing line of power quality measuring devices. Canvass makes it easy to monitor power quality anytime, anywhere.