
Abstract
Waveform Capture data is often the most detailed information available in a PQ recording. Getting good data is not always easy, so it’s important to glean all information possible from the data at hand. To help you get the most from this valuable data, ProVision offers several features for waveform analysis. Some are geared towards more advanced analysis (e.g. harmonic or parametric plots), and some are present to speed up analysis of many waveforms, or more precisely show an issue. All these waveform capture features are described in this whitepaper.
Getting Started
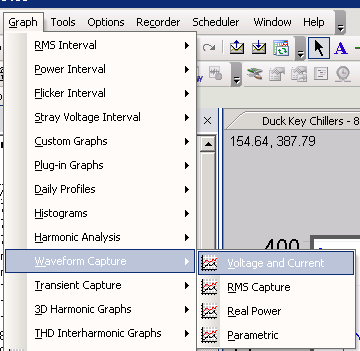
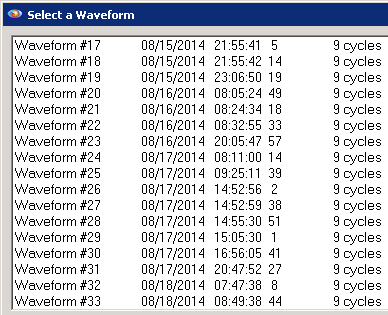
There are three ways to access the waveform capture data. The most straightforward is to choose Graph, Waveform Capture, Voltage and Current from the menu (Figure 1). A faster way is from the default Header Report. The list of event-triggered items in the Header Report are clickable links; clicking on Waveform Capture pulls up the list of waveforms to view (Figure 2). Finally, the default RMS voltage and Current stripchart contains vertical annotations which mark times where a waveform capture was triggered. Clicking on any of these annotations launches the corresponding waveform capture graph. These annotations can be added to any custom graph, and are the quickest way to match waveform data with sags and other events found in the RMS stripchart.
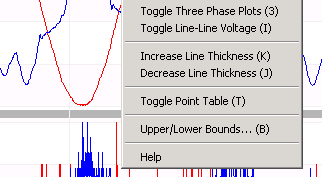
Once loaded, many of the operations described below are available via “hot-keys” (keyboard shortcuts that are enabled when the graph is selected), or the context menu. To view the context menu, right-click on the graph (Figure 3). Choices that have a hot-key method of invocation show the hot-key in parenthesis (e.g. “T” for Toggle Point Table). Using the hot-keys is the fastest way to invoke the advanced features.
Point Table
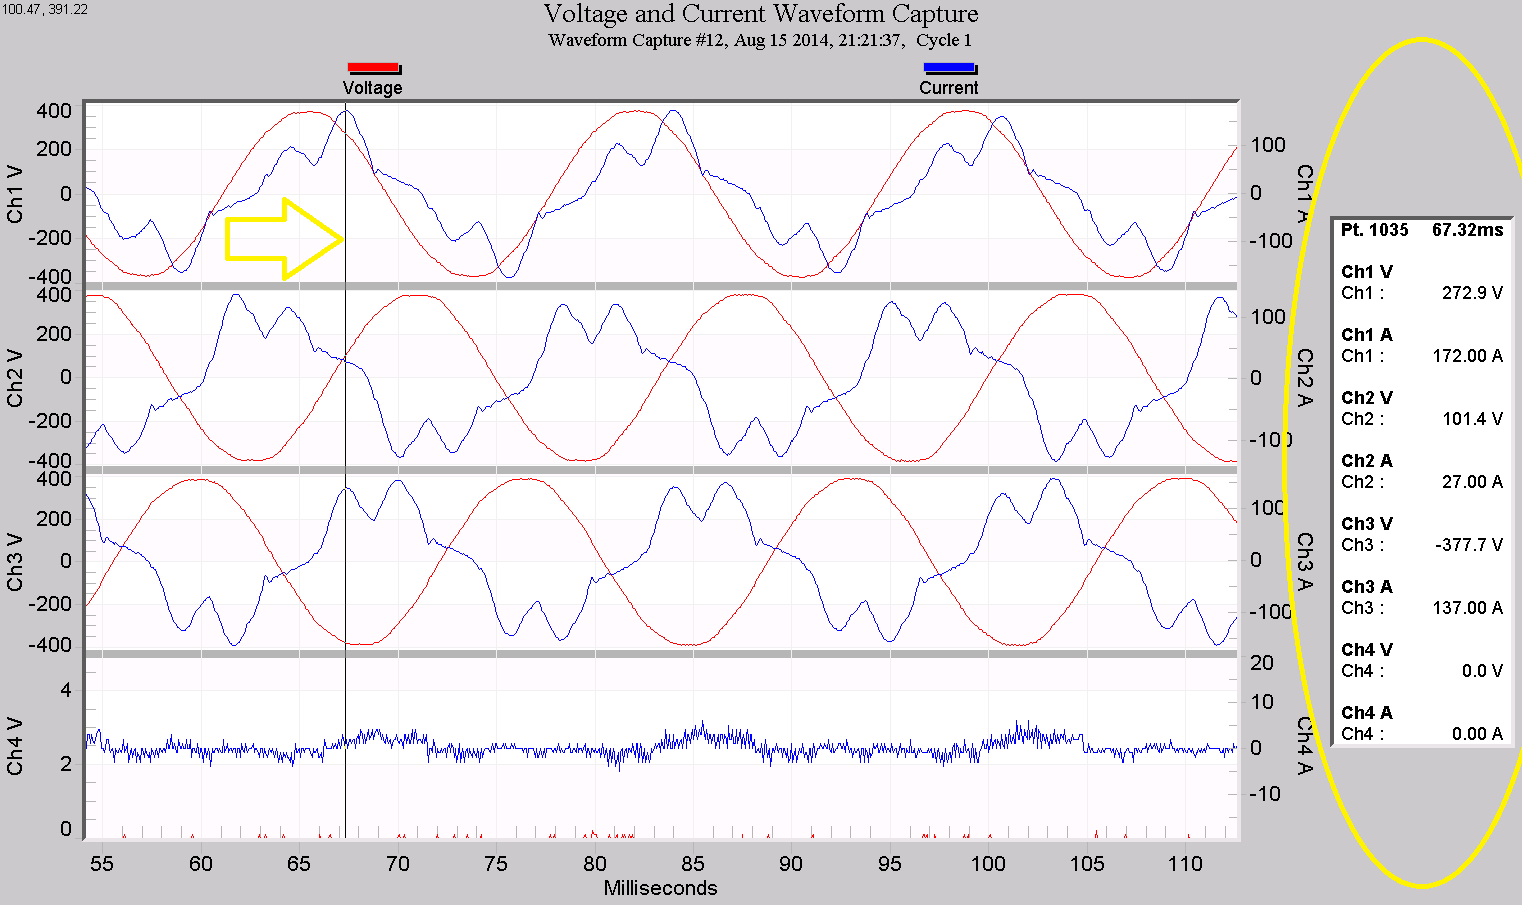
The Point Table functions similarly to the table in the stripchart graphs. When enabled (right-click the graph, then choose “Toggle Point Table”, or use the “T” hot-key), a side panel appears with the exact value of each voltage and current trace at a specific sampled time. In Figure 4, the table is circled, and the vertical scan line marking the displayed points is highlighted with the yellow arrow. The specific point number and time (in milliseconds) from the start of the capture is shown at the top of the table, followed by the values of voltage and current for each channel recorded. To move the scan line, click on the specific point on one of the traces, or use the left/right arrow keys to move it one point at a time. In this mode, the Page Up/Down keys move the scan line 20 points. If you press and hold an arrow key, the scan line will keep moving, panning the waveform if the edge of the graph is reached.
The Point Table has several uses beyond just quantifying raw sampled values. By comparing two points, the ringing frequency of a cap bank switch or other oscillatory transient may be measured. Comparing amplitude points allows for manual crest factor or unbalance calculations. Voltage and current phase shift may be estimated by comparing zero-crossing times. Switch make/break time, motor start-up timing, etc. may all be precisely determined with the Point Table. In general, looking at the graph lets you see the event; the Point Table lets you measure the event.
3-Phase Graph
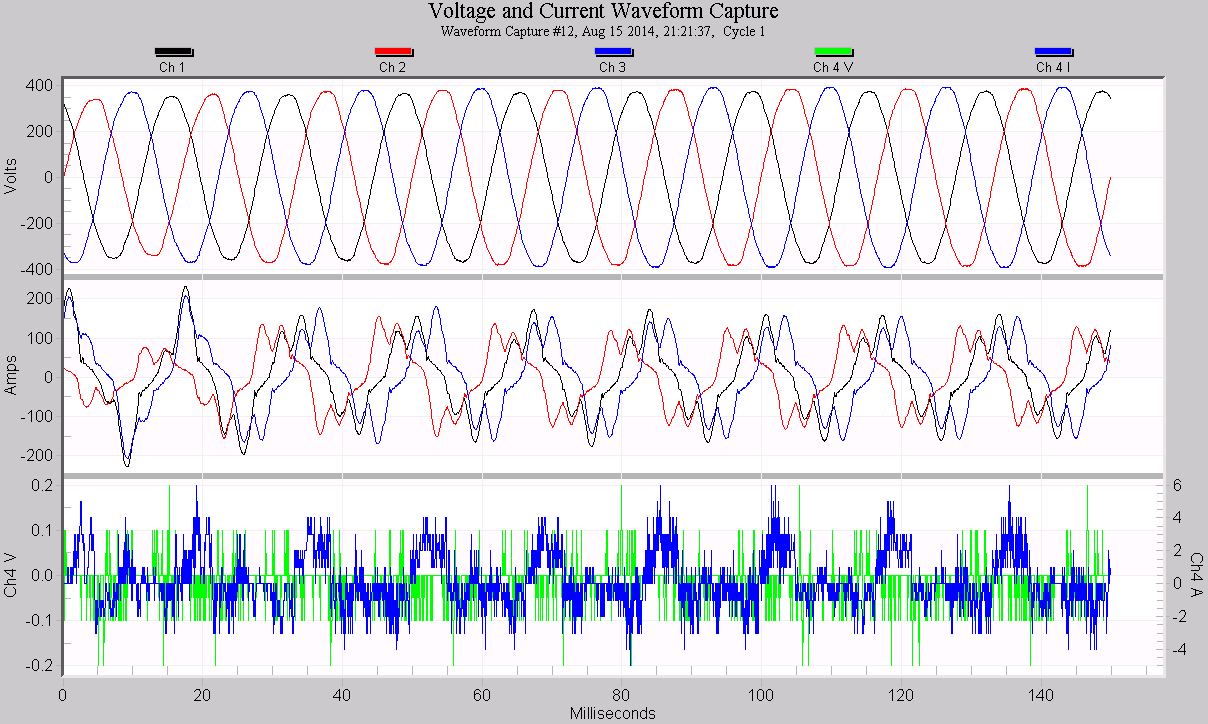
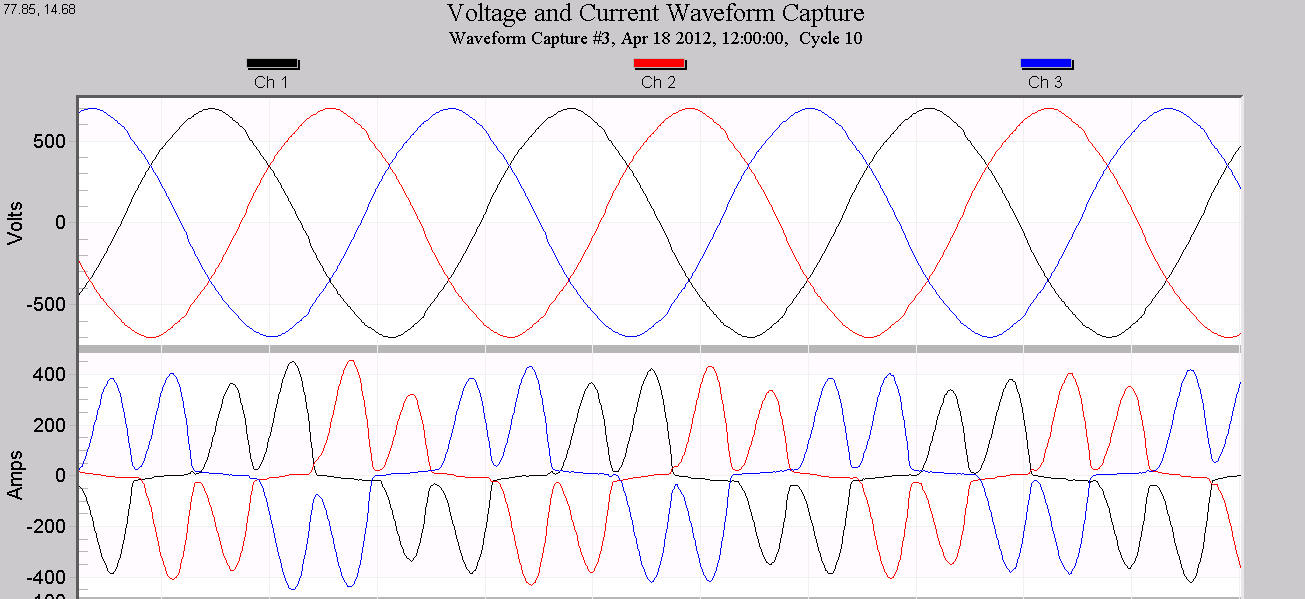
The default waveform capture arrangement displays each channel of voltage and current paired on a separate plot (as in Figure 4). This grouping is useful for looking at voltage/current relationships, but other combinations are sometimes helpful. Choosing “Toggle 3 phase plots” from the context menu, or the “3” hot-key changes the configuration so that all three voltage phases are on one plot, current phases are on a second plot, and channel 4 voltage/current on a third plot, as shown in Figure 5. This view is especially useful for 3-phase inverter loads such as VFDs. Unbalance in the voltage and current waveforms is much easier to see in this view. Figure 6 shows the successive pairs of phases that draw current in a 6-pulse VFD converter; apparent in this view is that some of the current pairs are at different peak amplitudes – possibly a failing diode leg in the bridge rectifier.
Line-Line Graph
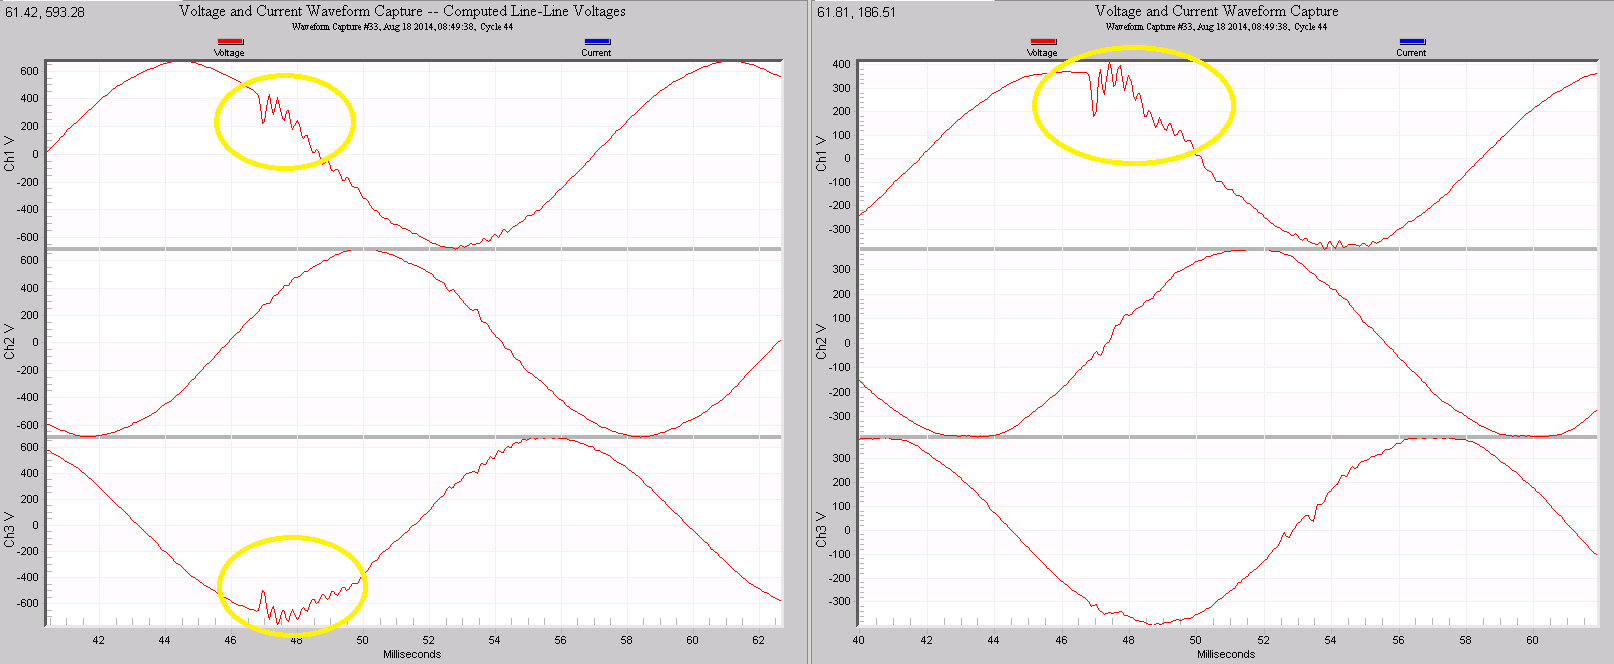
Occasionally a 3 phase system is recorded with a wye hookup, but the system contains some delta-connected loads. ProVision can compute the line-line voltage waveforms from any waveform capture, creating a graph of the voltages as seen by delta-connected equipment on the circuit. Choosing “Toggle Line-Line Voltage” on the context menu or the “I” hot-key switches the graph to Line-Line mode. The voltage waveforms plotted are computed from the line-neutral data exactly as they would have been if the recorder were configured as a delta. The current waveforms are unaffected. To indicate this mode, the graph title is appended with “Computed Line-Line Voltages”. All other graph controls including 3-phase mode and the point table work with this graph type. In Figure 7, a single-phase disturbance on Phase A (right graph) appears across 2 phases to delta-connected equipment (left graph).
Harmonic, Vector, Real Power, Parametric Views
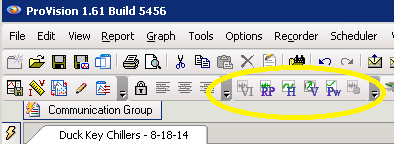
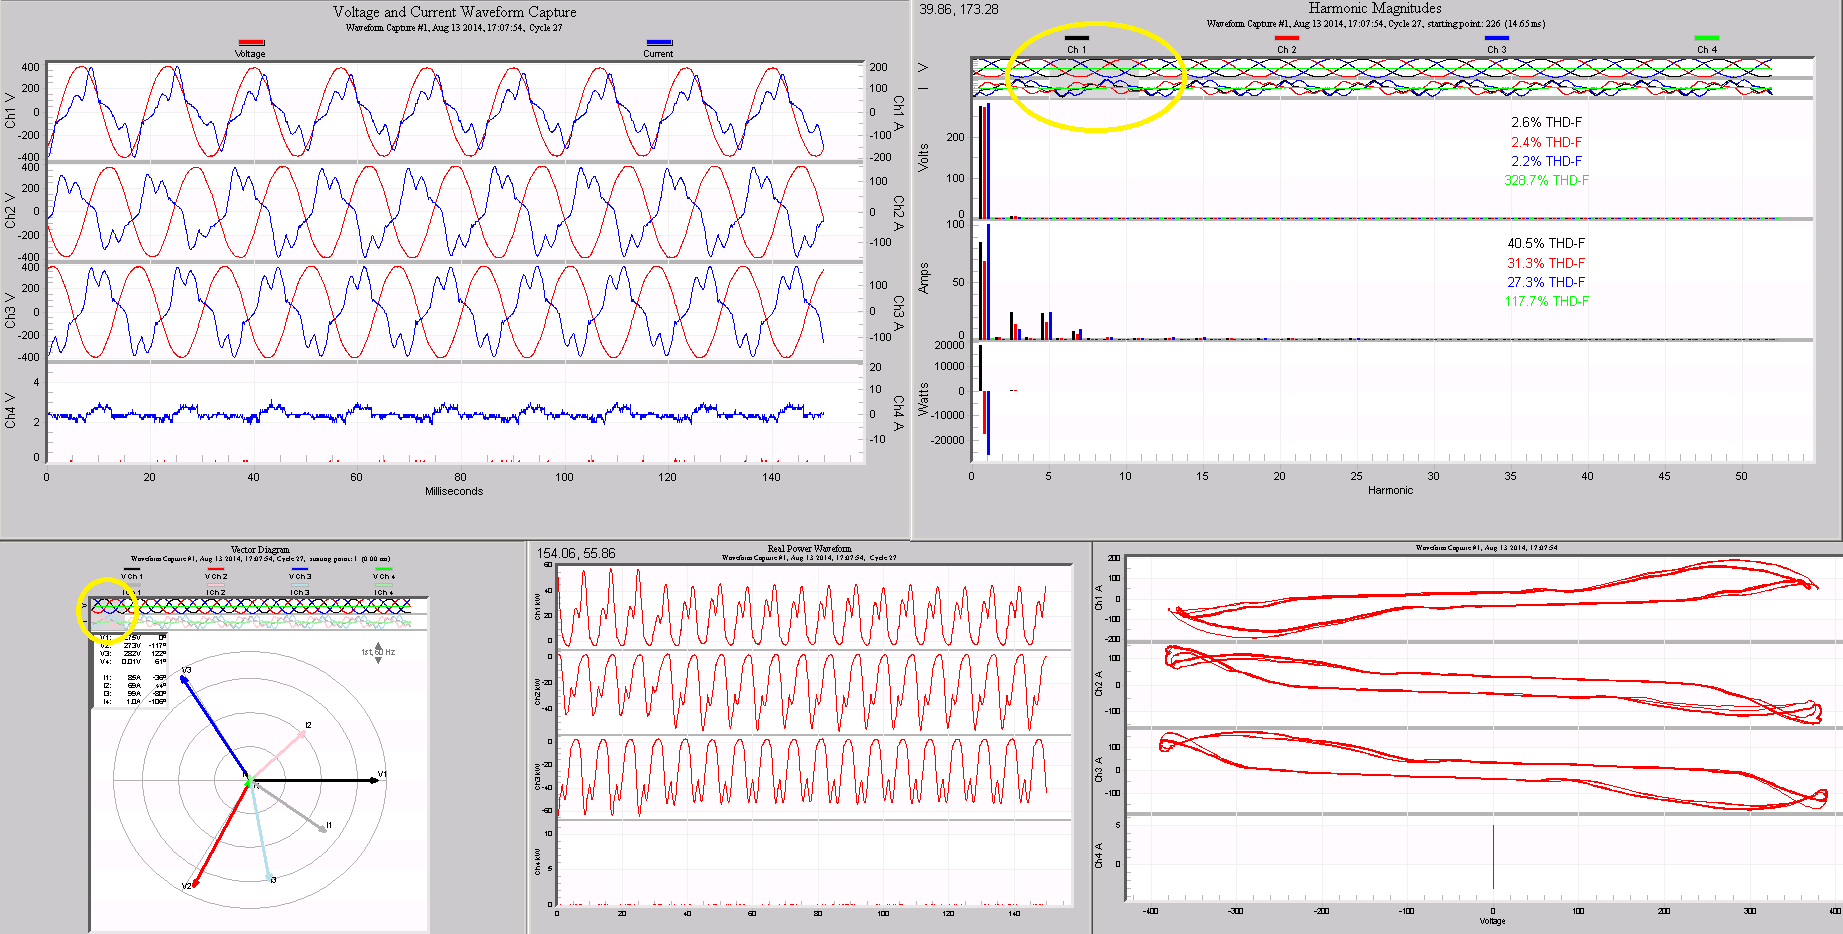
In addition to computing line-line voltages, ProVision can also compute harmonics, vector diagrams, instantaneous real power, and parametric views of the raw voltage and current waveform data. Real power and parametric graphs are available in the ProVision menu under Graph, Waveform Capture. To view harmonics or vector diagrams choose Graph, Harmonic Analysis, then Magnitudes or Vector Diagram. An easier way is to use the Waveform toolbar to switch instantly among the different views of the same selected waveform on the screen. These buttons (shown in Figure 8) switch from the standard voltage/current graph to instantaneous real power, harmonics, vector diagram, and parametric graphs. Each of these views of the same raw voltage/current samples is shown in Figure 9. For the harmonic and vector plots, ProVision uses a single cycle to compute the required data. This cycle is denoted with a gray rectangle in a mini-plot above the main plot (circled in the figure above); this annotation may be dragged to select the best representative cycle for the analysis. Choose a “normal” cycle for steady-state readings, or center the annotation over a ringing transient to examine the resonance frequencies in the harmonic plot. It’s rare that all are needed at the same time, but in different situations each view can be very valuable.
Waveform Capture Report
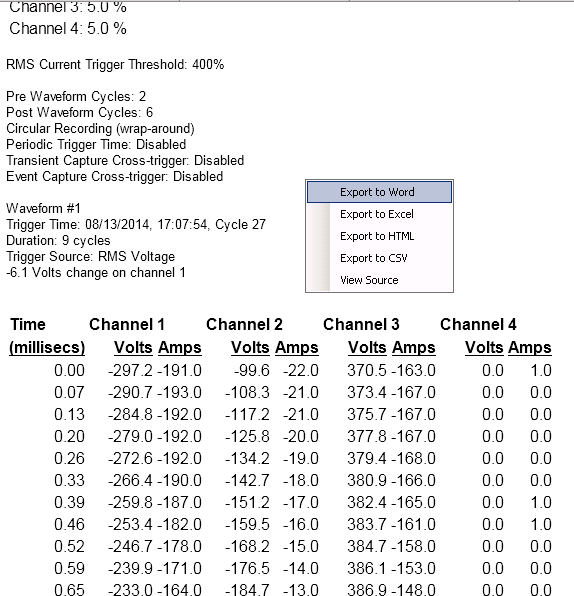
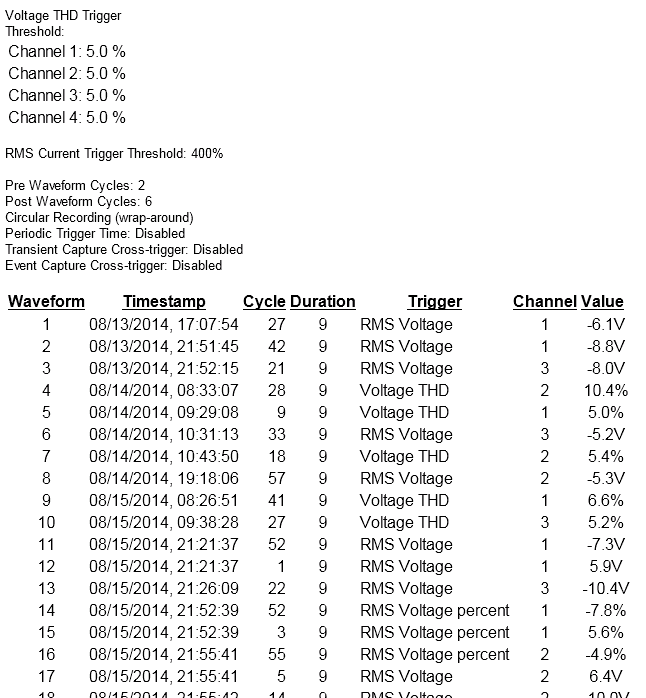
Waveform data may be viewed in tabular format for a closer analysis. Choose “Launch Report” from the context menu to generate this report, as shown in Figure 10. The waveform settings are shown at the top, then the trigger details for the specific capture, followed by every voltage and current data point in the capture. This data may be exported by right-clicking the report to bring up its context menu (as seen in Figure 10). Exporting to Excel or CSV format allows for a more specific analysis with a spreadsheet or MATLAB. Analysis outside of ProVision is the most common use for this report. To view just the triggering information for each waveform, choose Report, List of Waveforms from the ProVision menu. As shown in Figure 11, this generates a list of each triggered waveform, showing the timestamp, duration, and the trigger source and value (Revolution only).
Hot-Keys
There are several other smaller waveform capture graph features that are useful time savers. A full list of the shortcut hot-keys is shown below:
| Hot Key | Action |
|---|---|
| Page Down | Loads the next capture waveform |
| Page Up | Loads the previous captured waveform |
| 3 | Toggles 3-phase plot mode |
| I | Toggles line-line plot mode |
| T | Toggles point table off/on |
| B | Edit Graph upper/lower bounds |
| E | Launch graph export dialog |
| P | Print graph |
| U | Undo one zoom level |
| Z | Undo all zoom levels |
| Q | Bring up context menu |
| R | Launch waveform report |
| L | Launch waveform selector dialog |
| K | Increases plot line thickness |
| J | Decreases plot line thickness |
| S | Toggle color/black and white mode |
| M | Maximize graph on screen |
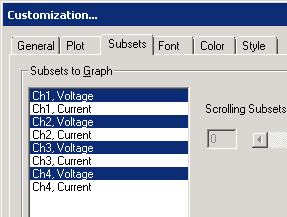
The “L” key is particularly useful to jump directly to another waveform capture. This launches this list of all waveforms (As shown in Figure 2). The Page Up/Down keys immediately jump to the previous or next waveform, and make it very quick to cycle through all waveforms to find a problem. Adjusting the upper/lower bounds, line thickness, etc. are useful when printing or creating reports. Finally, choose Tools, Select Plots to disable voltage or current channels (as shown in Figure 12). Disabling unneeded channels helps maximize the graphing area for the important channels. This is particularly helpful when including screenshots in reports.
Conclusion
Waveform capture data provides a wealth of information beyond just the raw voltage and current samples. Efficiently analyzing this data requires a good knowledge of the many ProVision advanced features and shortcuts available. An overview of the different graphing modes and shortcuts has been presented here.