Introduction
Power Monitors, Inc.’s PQ Canvass is a secure, cloud-based platform built for power-quality (PQ) analysis. PQ Canvass has a beta feature of automated “compliance reports” that transform data uploaded from field-deployed instruments such as the Bolt, Seeker, and Revolution into digestible compliance summaries based on industry standards. One of these reports is the Unbalance Report.
Compliance Reports
All compliance reports in PQ Canvass are structured to prioritize actionable information. They present tabular compliance summaries, key statistical metrics, and time-aligned waveform and trend plots. Reports are accessible remotely via the cloud portal, enabling rapid response and collaboration across utility departments or with industrial customers. A notable advantage is the standardization of report structure and criteria across instruments and locations, which supports benchmarking and longitudinal studies. For instance, system upgrades or seasonal variations can be quantitatively compared using successive PQ Canvass reports. Data feeding into PQ Canvass originates from PMI recorders configured for high-resolution RMS and waveform sampling.
Generating Compliance Reports
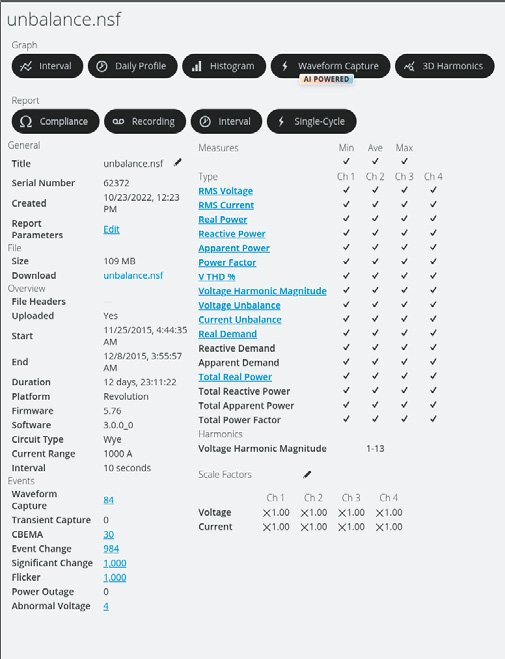
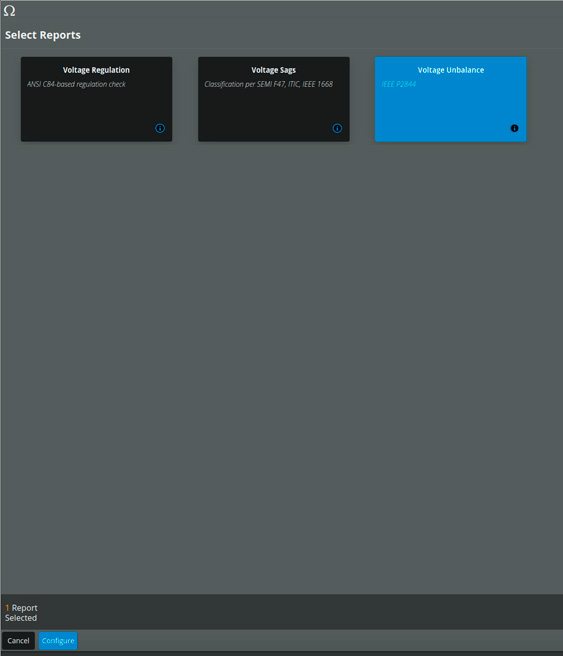
To generate the unbalance compliance report in PQ Canvass, start by selecting the relevant recording and clicking “Compliance” to open the available reports (Fig. 1). Choose the unbalance report template (Fig. 2), then click Configure to adjust analysis parameters such as time window, phase selection, and standards limits. Press “Run” to launch the job; a real-time progress bar tracks execution. When processing completes, a link to the finished report appears. Click to preview the report.
Voltage Unbalance
Unbalance is a frequent cause of nuisance PQ complaints, especially in rural or lightly loaded three-phase circuits. Voltage unbalance can cause severe heating in motors and large DC power converters. Ideally, the voltages of a polyphase system are all equal in magnitude. Due to uneven single-phase loading, differences in impedance in connectors, transformations through open delta and other non-symmetric transformer arrangements, and other factors, the line voltages are often not exactly equal as delivered to a load. Small differences in voltage are usually harmless, but as the difference increases, problems can quickly develop. While the primary concern with voltage unbalance is its impact on motor efficiency and equipment lifespan, it also introduces waveform distortion, which can increase voltage harmonic levels, increase losses, and negatively affect sensitive loads. The PQ Canvass platform facilitates pinpointing the phase and time of greatest deviation, aiding engineers in corrective balancing efforts or component replacement planning.
A good approximation of voltage unbalance can be found using the following formula.

For example, if the three line voltages are 124V, 119V, and 112V, the average voltage is:

The maximum deviation is 6.3 volts, resulting in a percent unbalance of 5.3%. The voltage unbalance would be:

Voltage unbalance is usually caused by single-phase and non-linear loads that are not evenly distributed. Sources of voltage unbalance are usually found inside of facilities.
A better formula for voltage unbalance is:
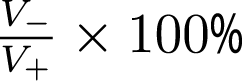
Where the Positive Sequence Voltage (the “good” part of the voltage) represents the fundamental, balanced component, and the Negative Sequence Voltage is the portion of the system that has the opposite rotation to the system’s source and is used to quantify unbalance.
See the whitepaper on Symmetrical Components for more information. A typical unbalance reading is under 1%. ANSI C84.1 recommends keeping voltage unbalance below 3% (as measured at a revenue meter), and many utilities target 2% or 2.5% as a maximum, where possible. More sensitive loads, like variable speed drives, may require tighter margins.
Unbalance Compliance Report
The Unbalance Compliance Report in PQ Canvass applies the NEMA-defined voltage and current unbalance ratios and captures the minimum, average, and maximum unbalance over the monitoring period and identifies the percent of time thresholds were exceeded.
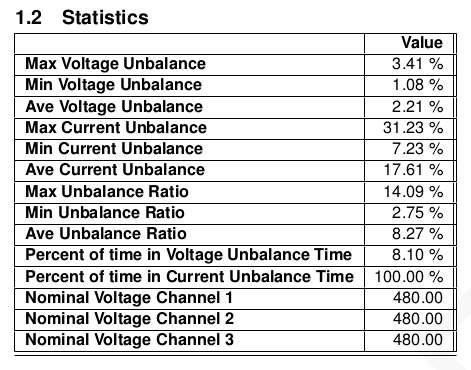
The Unbalance Compliance Report first gives a summary of the recording and user selections followed by an overview in a statistics chart (Fig. 3) so that a user can quickly see if the time under consideration was in compliance with industry standards. This is followed by more detailed information, including graphs and recorded excursion lists.
The first set of graphs is the Voltage, Current, Voltage Unbalance and Current Unbalance graphs (Fig. 4) showing at a glance if and when the unbalance limit is exceeded.
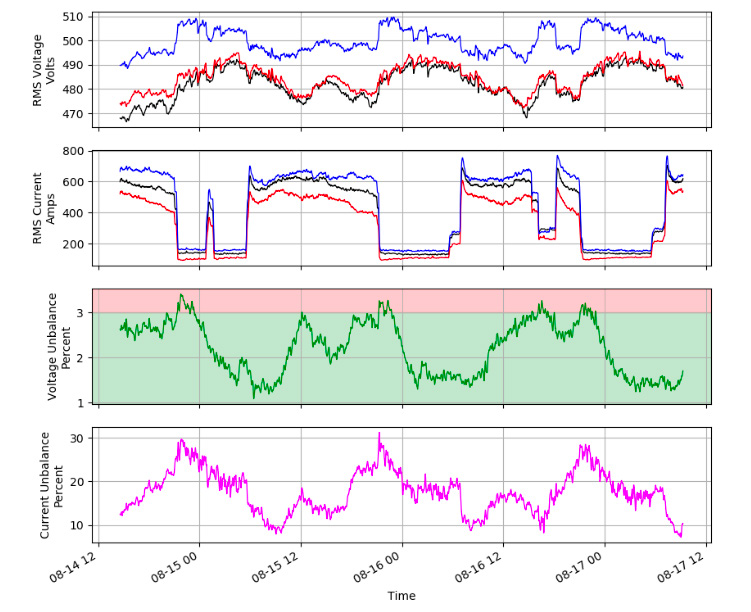
Together, these four graphs illustrate the relationship between the plots and help identify whether the voltage unbalance is caused by load-induced sags. By analyzing these graphs, one can assess the correlation between load and voltage unbalance. If the unbalance varies with changes in current, the load is likely the source. If it remains unaffected by current, the unbalance is likely originating from the distribution system.
The next graph is the Current to Voltage Unbalance Ratio. The higher the ratio, the more likely it is that the load is contributing to the unbalance.
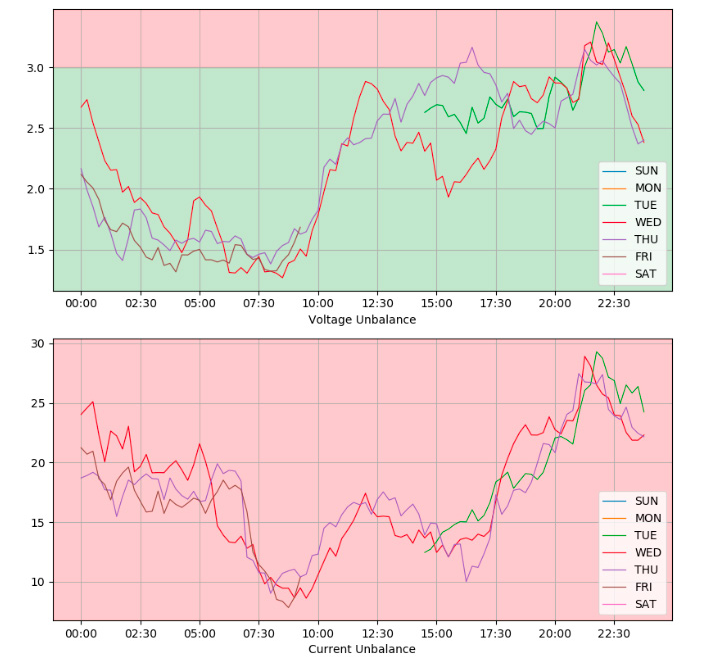
The daily profile graphs break down the recording into 15-minute bins, each bin corresponding to a 15-minute period in a 24-hour day. There are a total of 96 bins. Each bin is the average value of that fifteen minute period over the duration of the recording. These graphs (Fig. 5) help show the relationship of Unbalance and time of day.
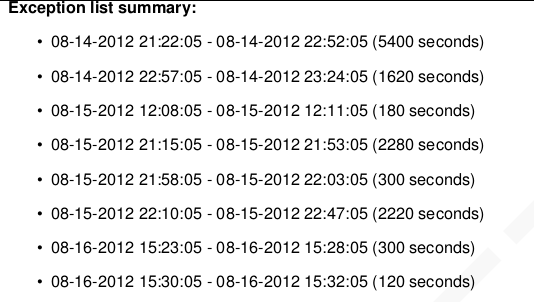
Following the graphs, there is the recorded Voltage Unbalance Limit Exception list (Fig. 6) showing a detailed list of all recorded limit exceptions.
Conclusion
Voltage unbalance can produce problems with polyphase loads, and therefore, it is an important parameter to check when analyzing any 3-phase data set.
PQ Canvass compliance reports offer utility engineers a robust, standards-based tool set for rapidly evaluating power quality data. By automating compliance checks and surfacing critical events, the platform reduces analysis time and enhances consistency. The structure and clarity of the reports make them suitable for both internal diagnostics and customer-facing communication.
