Abstract
A recloser is most associated with brief voltage interruptions, possibly followed by an extended outage if a fault cannot be cleared. Upstream customers experience voltage sag during the reclose attempts, when fault current is flowing. A voltage swell seems counterintuitive during a fault or recloser operation, but in some situations the voltage can raise considerably during the reclose time. This phenomenon is discussed here along with a real-world example.
Recloser Operation
A recloser is designed to open immediately under a high current fault condition. Since many faults are temporary (e.g. tree branch falling across the lines, then falling to the ground), a recloser is programmed to re-close the circuit in the hopes that the fault is now gone. If the fault current is still present, it opens again; if not, it stays closed. Most reclosers are programmed for 3 or 4 reclose attempts before locking open – at this point, all customers downstream experience an outage and a line crew must investigate. Typically the recloser closes for a few cycles to up to a second, with several seconds of open time between attempts.
A line-to-ground fault typically presents a severe voltage sag to all downstream residential customers on the same phase. The open period of a recloser interrupts any downstream power flow, which would present as a momentary outage to any residential customers. For residential customers fed from other phases on the same circuit, the voltage would typically either be unaffected, or possibly sag as well if an upstream transformer saturates.
Given these two states (closed into a short, or open), a recloser operation as captured by a downstream power quality recorder is typically an outage interspersed with several short voltage sags (during the close periods). However, it’s possible for a line-to-ground fault to actually cause a voltage swell.
Faults in a 3-Phase System
Consider a 3-phase system as shown in Figure 1. Here the neutral is at the same potential as earth ground and the three phase voltages are 120 degrees apart. If the circuit has no ground reference (e.g. neutral not tied to ground, or a floating delta), then a single line-to-ground fault has no effect on the line voltages, but the phase A voltage with respect to ground is now zero. This condition may persist for quite some time, since no fault current flows. The phase voltage for A is zero (since it’s at the same potential as ground), and the phase voltages for the other two legs are increased by sqrt(3) = 1.73 per unit with respect to ground. This phasor diagram is shown in Figure 2.
On the other extreme, Figure 3 shows an ideally grounded system. Here the neutral is by definition at the same potential as the neutral. If phase A is shorted to ground then it’s also now at the neutral potential. From a customer perspective, phase A is in an outage condition, and the other two phases are unaffected.
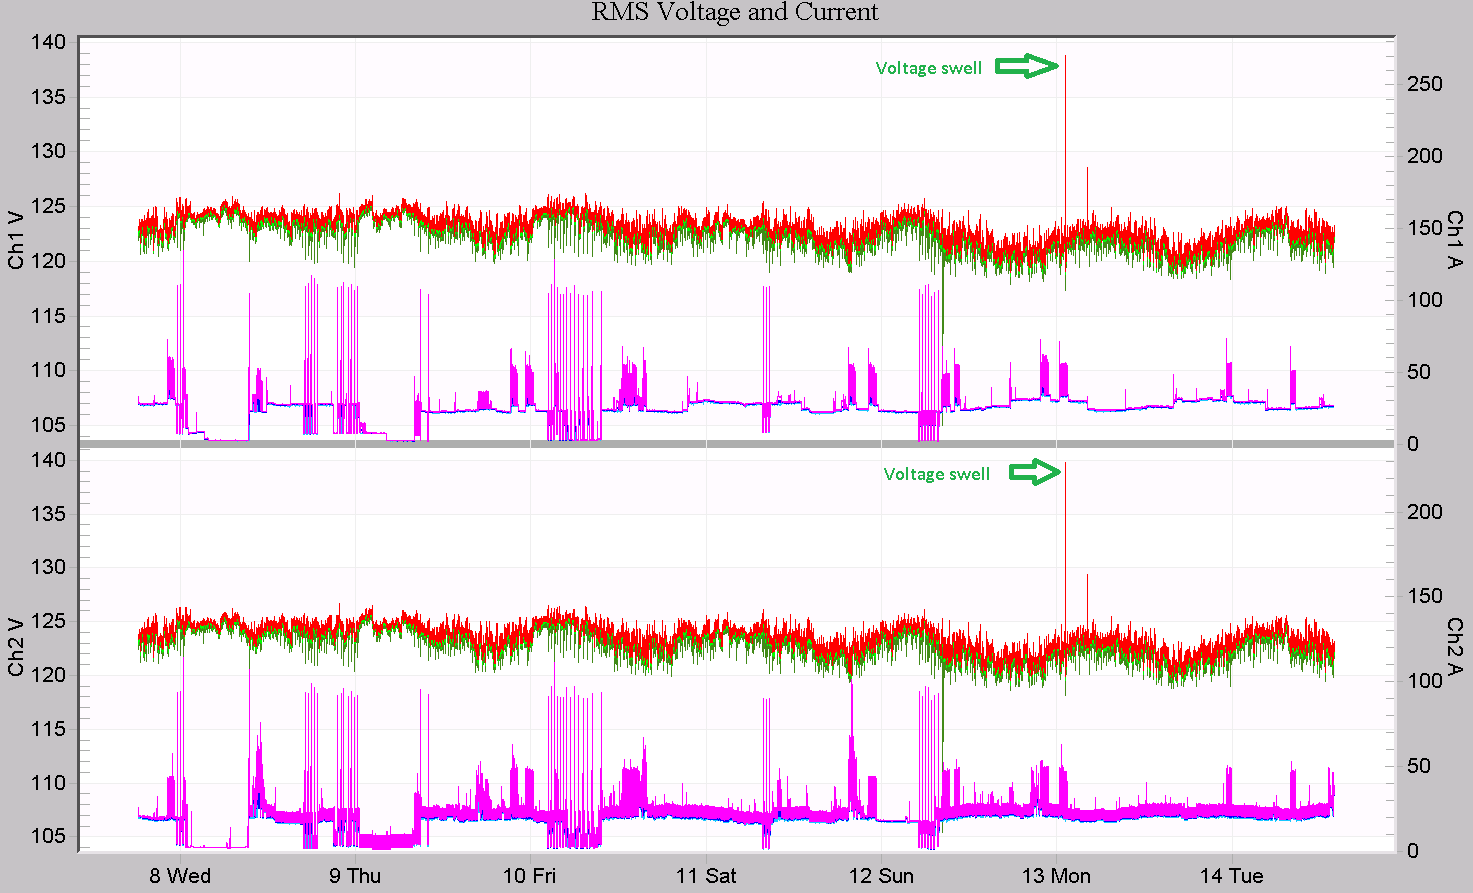
Figure 4 is the more typical situation. Here the circuit is grounded at several points throughout the network. If phase A is faulted, the fault current shifts the neutrals throughout the circuit away from the ground/neutral potential at the substation. Pulling the neutral closer to the original A phasor has the effect of increasing the distance to phasors B and C from ground – i.e. they increase – a voltage swell. The bounds of this shift are set by the two extremes – an ungrounded case (factor of 1.73), and an ideal grounding case (no increase, factor of 1.00).
The IEEE has categorized the expected level of voltage swell from a single line-to-ground fault based on the system grounding and protection type. These levels, from ANSI/IEEE C62.92-1987, IEEE Guide for the Application of Neutral Grounding in Electrical Utility Systems are listed in the following table:
| System | Overvoltage Factor |
|---|---|
| Ungrounded System | 1.82 |
| Four-Wire Multigrounded System (Spacer Cable) | 1.5 |
| Three-Or Four-Wire Unigrounded System (Open Wire) | 1.4 |
| Four-Wire Multigrounded System (Open Wire-Gapped Arrester) | 1.25 |
| Four-Wire Multigrounded System (Open-Wire Metal-Oxide Arrester) | 1.35 |
These factors include an initial voltage that’s 5% high (e.g. 1.05 per-unit), so these numbers are 5% higher than expected from theory (e.g. 1.73 x 1.05 = 1.82 in the ungrounded case). As an example, if phase A is shorted to ground in a four-wire multi-grounded system, phase A will read as close to zero volts near the fault, while the other two phases may increase up to 18% to 28% (1.25 to 1.35 per-unit). This swell only occurs during the fault itself – when the recloser is open, no fault current is flowing, no neutral shift occurs, and thus the other two phase revert to their normal levels. Multiple reclose attempts will appear as several short voltage swells followed by a return to nominal levels for downstream residential customers on the non-faulted phases.
Recloser Swell Example
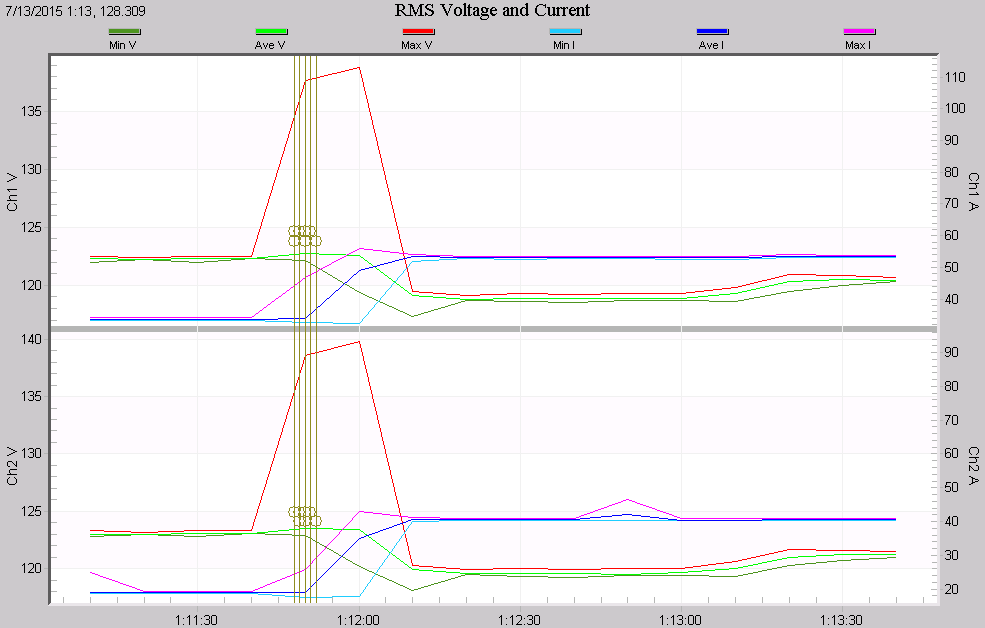
A recording from a Guardian PQ monitor captured this effect recently. In Figure 5, the basic RMS Voltage and Current graph is shown, with min/max/ave voltage and current displayed for both legs of a single-phase residential service. Everything looks relatively normal except for the voltage spikes to almost 140V on Monday the 13th. A loose neutral condition can cause excessive voltage rise, but it’s usually matched by corresponding sag on the other leg. Here both legs show a swell to almost 140V, but with no equivalent sag. Zooming in (Figure 6) confirms the swell with no sag, and also shows that nothing unusual in the load current was happening, suggesting no loose neutral or load-induced swell. The vertical annotations indicate that waveforms were captured; these will reveal more detail.
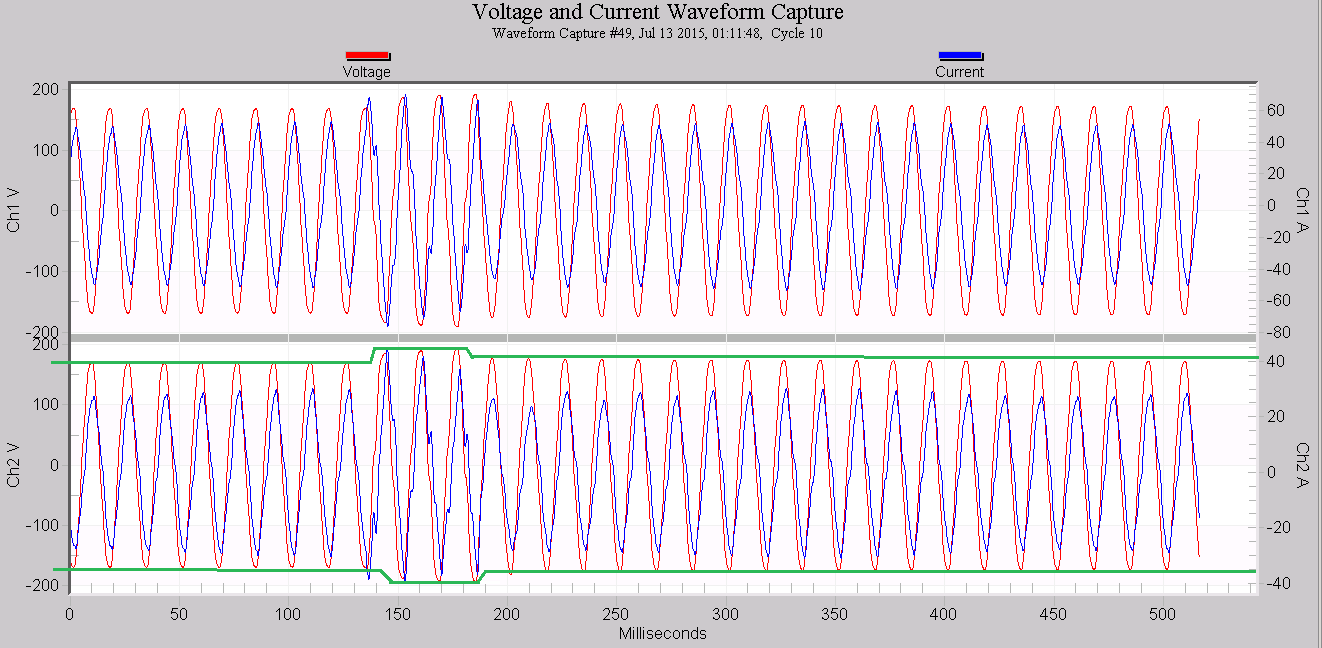
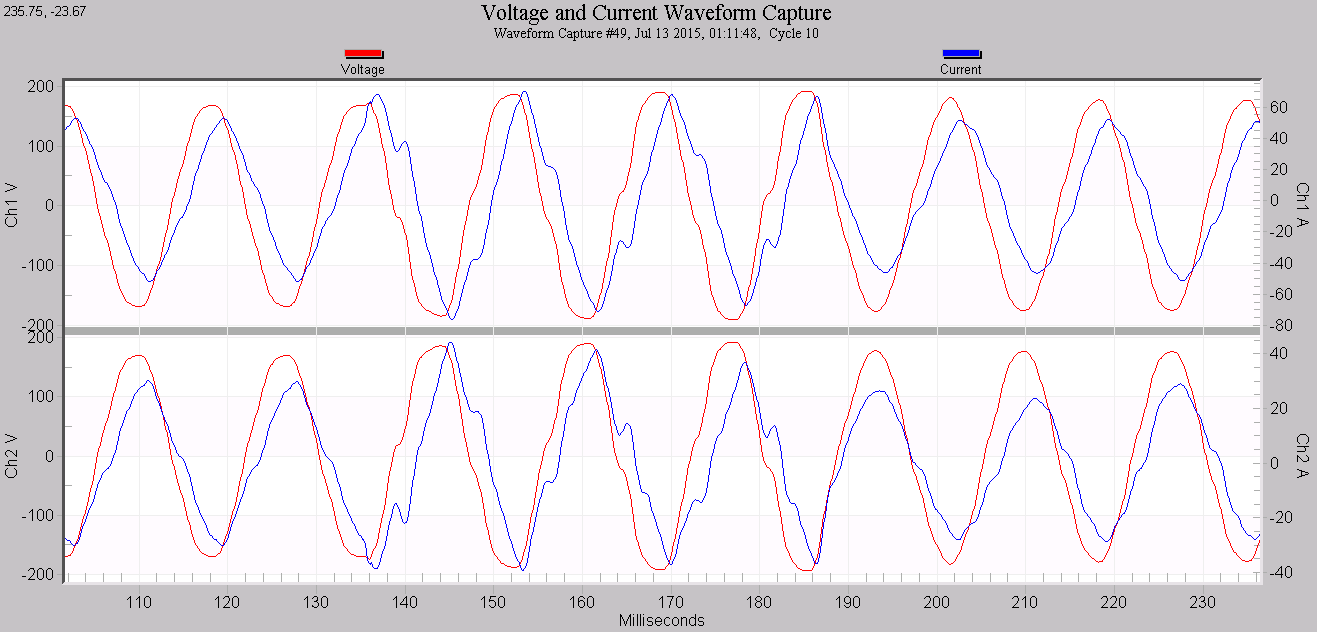
The first waveform capture in the series is shown in Figure 7. Looking at the voltage waveforms (red), the disturbance appears to last just a few cycles and is mostly a magnitude change. The envelope is marked in green in the lower plot. Zooming in on this section (Figure 8) reveals some mild waveshape distortion in the voltage and current, but no ringing or other switching/resonance issues (e.g. ferroresonance, another possible voltage swell cause). The change in current distortion happens at the exact instant the voltage also changes (circled in green), and the magnitude of the current change is small relative to the voltage change, further indicating that the load is not the root cause of the disturbance. The other waveform capture show the same pattern.
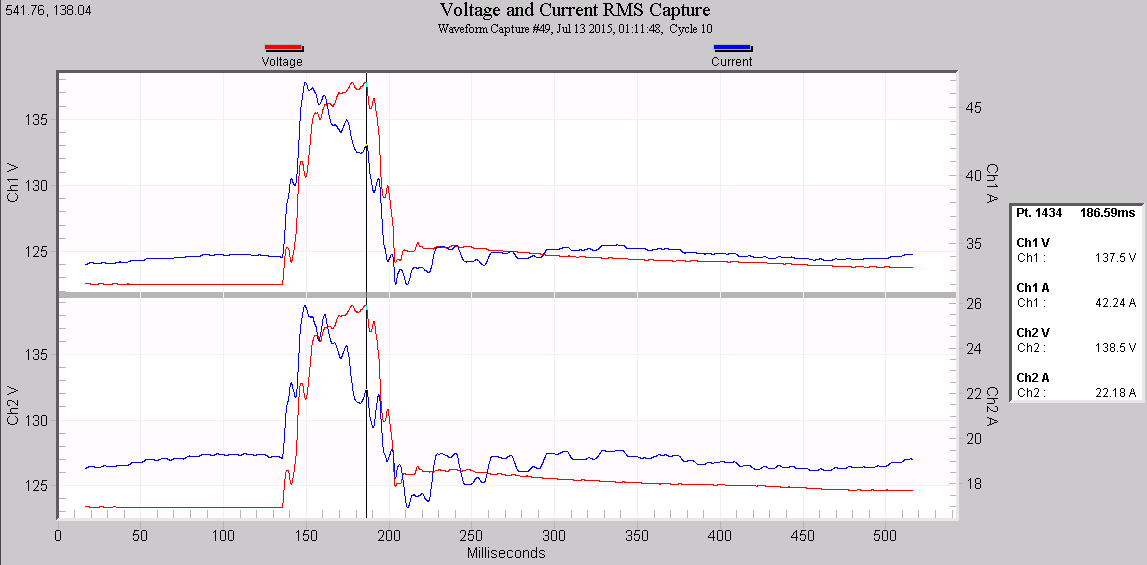
Since the disturbance is primarily an RMS voltage event, the RMS capture provides a much better view than raw waveform capture. The RMS Capture graph for the same waveform is shown in Figure 9. The voltage swell is very clear, and using the point table, the swell is quantified as an increase of 138.7V/123.3V = 1.125, or 138.7V/120V = 1.16 per-unit. The duration is 202.6 ms – 136.2 ms = 66.4 ms, or 4 cycles.
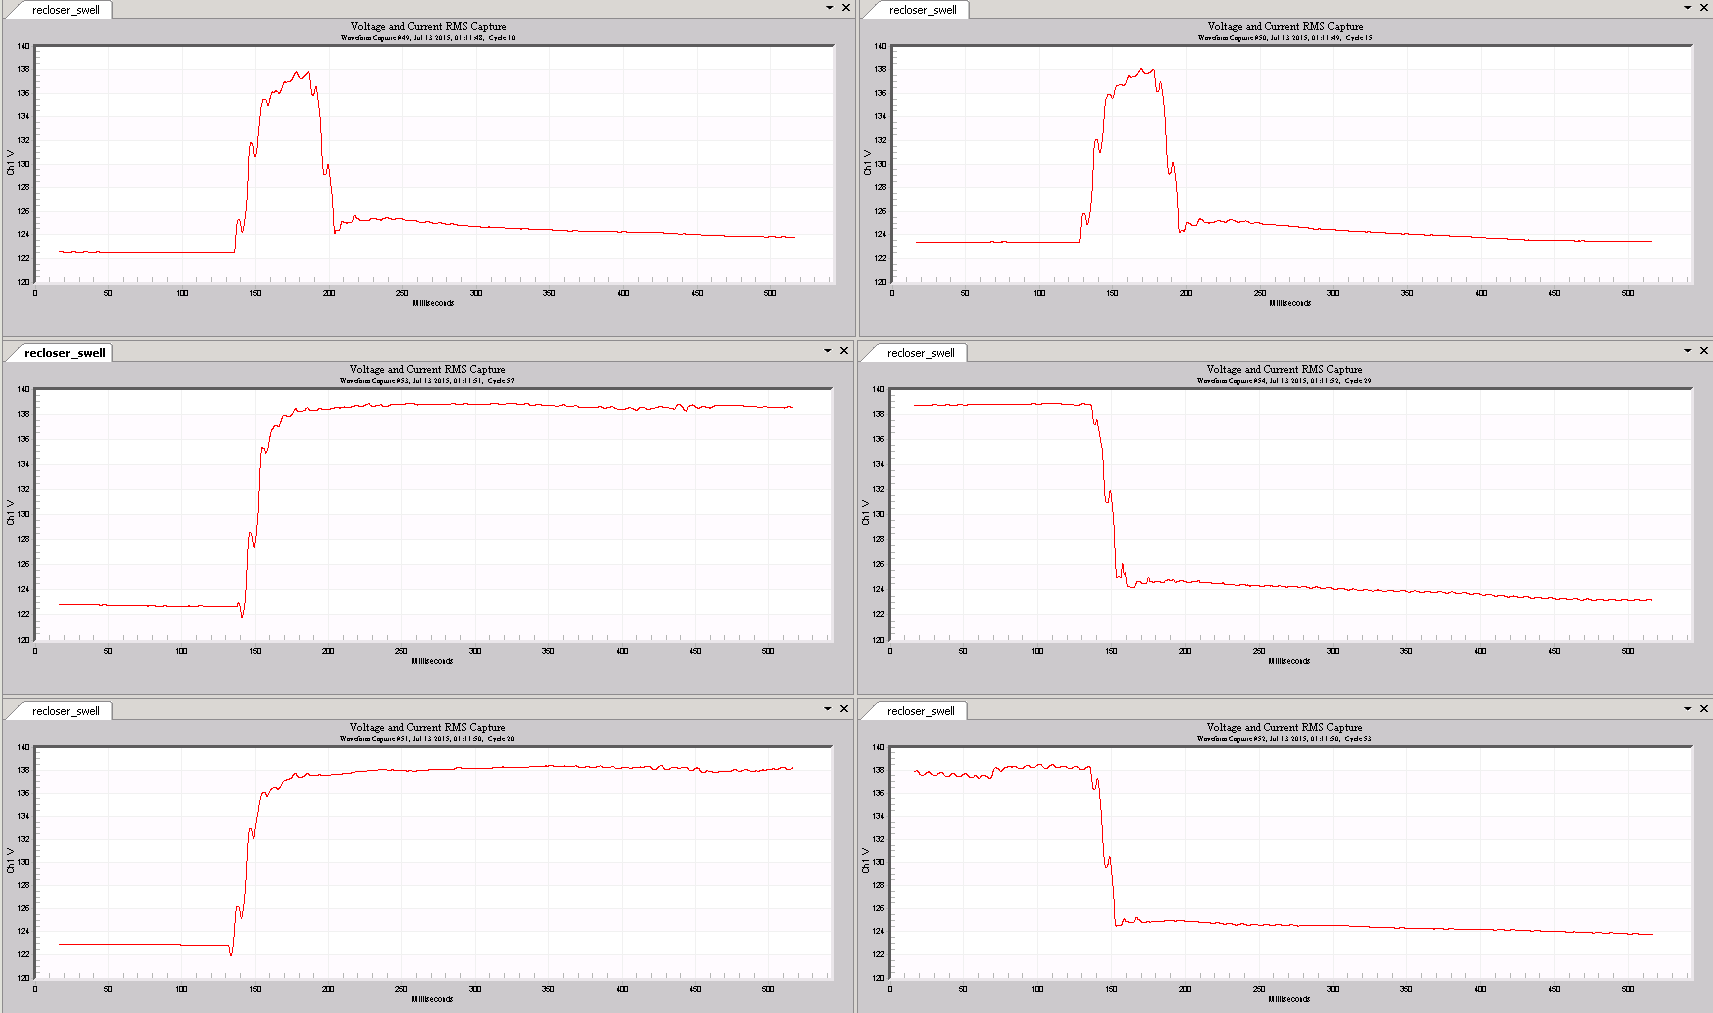
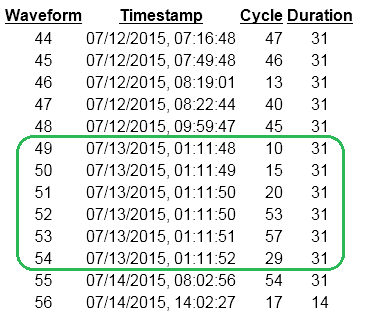
All six RMS captures in this timeframe are shown in Figure 10 (graphed with just one voltage channel, and scaling manually set identical for each graph for clarity). The top two plots are the first two captures, both identical 4 cycle swells. The latter two sets of captures (bottom plots) show two longer swells, with the beginning and end of each captured separately. The waveform timestamps from the Waveform Capture Report (Figure 11) can be used to compute the duration of the final events.
In the report, the applicable captures are circled in green. The four swells are almost exactly 1 second apart. The first two swells are exactly 4 cycles long, and the final two are both 33 cycles long. The precise timing and pattern – four events separated by one second, the first two 4 cycles, the last two 33 cycles – is highly suggestive of a recloser operation. But instead of sags or interrupts, we have voltage swells.
The overvoltage factor of 16% is in line with the 25% max expected with a multi-grounded system. In this recording, an upstream line fault to neutral on a different phase of this circuit occurred. A single-phase recloser attempted to clear the fault, reclosing four times in the 4/4/33/33 cycle pattern. During each reclose period, the neutral point in the circuit phasor shifted, raising the voltage on the other two phases. Because a residential service is only fed by one phase, the customer only experienced the swells, not the other dropped phase. The fault was not cleared by the recloser, and after the fourth attempt it locked open, restoring voltage to normal on the other two phases (and leaving the faulted phase interrupted).
Conclusion
A 140V voltage spike in the RMS voltage stripchart from a residential PQ recording can be indicative of a loose neutral, switching problem with a capacitor bank, or faulty voltage regulator, to list just a few possibilities. Recloser operations may be added to the list. Fortunately their characteristic timing and lack of severe distortion in waveshape distinguishes them from other more serious events. Swells are best spotted in the RMS Voltage and Current stripchart. Once spotted, the waveform capture graphs may be used to separate RMS changes from other waveshape signatures, and the RMS capture graph and timestamps help quantify the swell magnitude and timing. Conclusively identifying a swell as a recloser operation allows for corrective action (e.g. better grounding) if needed, and prevents searching for other possible causes of a swell.
